The winter of 2025-2026 was unusually chilly across eastern North and South Carolina. The period December 2025 through February 2026 was the coldest winter season for most local cities since 2010-2011. Temperatures dipped as low as -1°F in Lumberton, NC on February 2, 2026, the first time it had dropped below zero there since Christmas of 1989. This winter also brought a significant snowstorm to both Carolinas on January 31-February 1, officially the largest snowfall in Wilmington (5.8 inches) in the past 36 years.
Top Five Coldest Winters Since 2010 Sorted by Average Temperatures
| Rank | Wilmington, NC | Myrtle Beach, SC | Lumberton, NC | Florence, SC |
| 1 | 42.6°F 2010-2011 | 43.0°F 2010-2011 | 41.8°F 2010-2011 | 43.2°F 2010-2011 |
| 2 | 45.5°F 2014-2015 | 46.1°F 2025-2026 | 43.8°F 2025-2026 | 45.1°F 2025-2026 |
| 3 | 45.7°F 2025-2026 | 46.4°F 2014-2015 | 44.1°F 2014-2015 | 45.3°F 2014-2015 |
| 4 | 46.9°F 2024-2025 | 46.9°F 2024-2025 | 45.2°F 2013-2014 | 46.6°F 2013-2014 |
| 5 | 48.0°F 2013-2014 | 47.0°F 2013-2014 | 46.1°F 2024-2025 | 46.9°F 2020-2021 |
La Niña Should End
This winter experienced La Niña as sea surface temperatures across the tropical East Pacific Ocean ran up to 1.0°C below normal. La Niña is the cold phase of the El Niño-Southern Oscillation, a naturally occurring shift in water temperatures across the tropical Pacific Ocean that brings global weather and climate impacts. La Niña likely helped contribute to below-normal winter precipitation and steady to persistent drought conditions. Local winter rainfall totals ranged from six to eight inches, about one to three inches below normal or about 70 to 80 percent of a normal winter's precipitation
|
Animation of recent sea surface temperature anomalies (difference from normal) across the tropical Pacific Ocean. Blue colors along equator south of Hawaii are associated with this winter's La Niña. These cool readings are expected to fade completely this spring. Data is courtesy of NWS CPC. |
Model based probabilities of La Niña (blue), neutral (gray), or El Niño (red) conditions developing in 2026. Graphic courtesy of the International Research Institute for Climate and Society at Columbia Climate School |
Climate models suggest La Niña will end this spring, replaced by neutral ENSO conditions that may last through the coming summer months. There is little linkage between ENSO phase and temperatures across the Carolinas during the spring. If weak La Niña conditions were to linger well into spring, local climatology suggests it may boost the potential that we remain unusually dry.
Increased Drought and Wildfire Risk
|
Six-month rainfall deficits are as large as nine inches in Wilmington and Myrtle Beach. |
The U.S. Drought Monitor shows that the Carolinas are currently experiencing moderate to locally severe drought conditions. This is due to persistently below normal rainfall over the past six months. The three months of climatological winter (December 2025 through February 2026) were drier than normal and all four of local long-term climate monitoring stations across southeastern North Carolina and northeastern South Carolina recorded below normal precipitation totals.
|
The U.S. Drought Monitor shows moderate to locally severe drought is ongoing across most of eastern North and South Carolina |
The NWS Climate Prediction Center's Seasonal Drought Outlook shows drought should continue through the Spring months across eastern North and South Carolina |
|
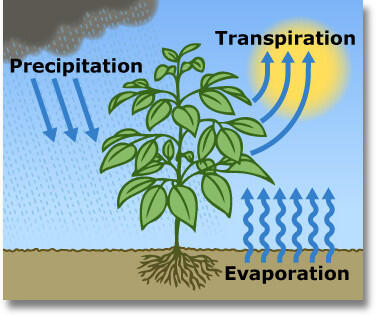
Evaporation (water moving from the soil into the air) plus transpiration (water moving from plants into the air) equals evapotranspiration. |
Outlooks from the NWS Climate Prediction Center show that drought will likely persist through the spring months. Given the accumulated rainfall deficits over the past six months, drought may linger even if rainfall were to return to near normal values.
The combination of water loss due to evaporation plus water usage by plants, together termed evapotranspiration, increases dramatically during the spring. It would take above normal rainfall amounts to meet this increasing evapotranspiration demand plus overcome the accumulated rainfall deficits of the past six months. Those with agricultural or water supply responsibilities may need to consider enacting plans to deal with drought this spring.
Forecast rainfall and drought unfortunately suggest the risk of wildfire will remain higher than normal through the remainder of the spring across eastern portions of North and South Carolina. The latest Wildland Fire Potential Outlook from the National Interagency Fire Center (NIFC) states:
"...looking at the entirety of the Southern Area, it was the driest November to February period since at least the late 1970s, with only a handful of spots experiencing near or slightly above average precipitation. This dryness comes after the lowest impact hurricane season in more than a decade. Many areas that rely on beneficial tropical moisture with weather stations that have over 100 years of reliable data are experiencing a top five driest six-month period, according to an analysis from the Southeast Regional Climate Center.
The scope of this hydrological drought may contribute to multiple portions of the region being in high fire danger simultaneously, from the Plains to the Appalachians and coastal regions. Otherwise, as unusually warm weather takes hold in March, green-up will get into full swing, increasing pressure on the water table and already depleted soil moisture. Areas that do not see sufficient soil moisture recharge could also have lingering issues well into the growing season."
Red areas on the maps below indicate where NIFC meteorologists have specific concerns about heightened wildland fire risk this spring.
|
NIFC Wildland Fire Potential Outlook for March 2026 |
NIFC Wildland Fire Potential Outlook for April 2026 |
NIFC Wildland Fire Potential Outlook for May 2026 |
Spring Temperatures and the Last Spring Freeze
Outlooks from the Climate Prediction Center show high probabilities (60-70 percent) that the Carolinas will experience above-normal temperatures through the remainder of March. The three-month temperature outlook that extends out through April and May trends only slightly toward above-normal temperatures.
|
March 2026 temperature outlook from the National Weather Service Climate Prediction Center |
Across our portion of the eastern Carolinas the last freezing temperatures of spring usually occur during March. There is considerable year-to-year variability depending on local weather patterns and in a few years freezes have occurred well into April. The day after the last freeze begins the agricultural growing season when tender blooming plants and annuals can safely withstand outdoor weather conditions.
The National Weather Service will issue frost advisories and freeze warnings in advance of any forecast cold weather conditions that could be hazardous to tender plants.
|
|
|
Severe Weather Season Begins
Warming spring temperatures create a more unstable atmosphere that can help produce thunderstorms. The atmosphere several miles aloft often remains quite chilly through April and May, and this large temperature contrast helps produce a spike in severe thunderstorm activity during the spring months.
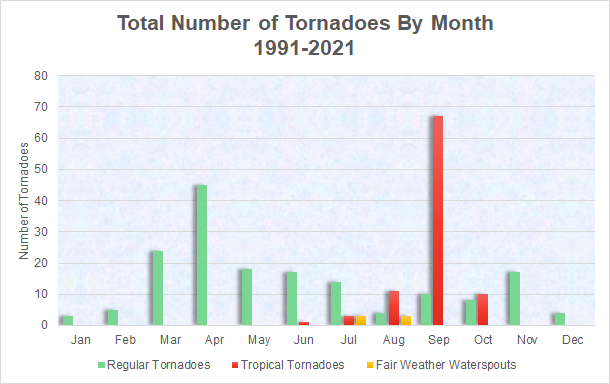
Across the eastern Carolinas, local research shows two annual peaks in tornado occurrence: one in March and April associated with severe thunderstorms, and a second in September associated with landfalling tropical storms and hurricanes. This spring peak in tornado occurrence was associated with devastating tornado outbreaks on March 28, 1984 and April 16, 2011; as well as more recent smaller tornado events on May 14, 2024 and March 16-17, 2025.
|
Monthly Tornado history across the NWS Wilmington, NC forecast area |
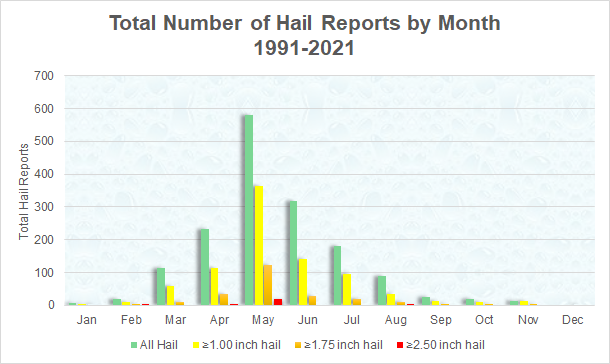
Local climatology shows the annual peak in hailstorms occurs during April, May, and June. For very large hail (1.75" or golf ball size or larger) over half of reported events have occurred in May. Giant hail (2.5" or larger) almost exclusively falls during the month of May.
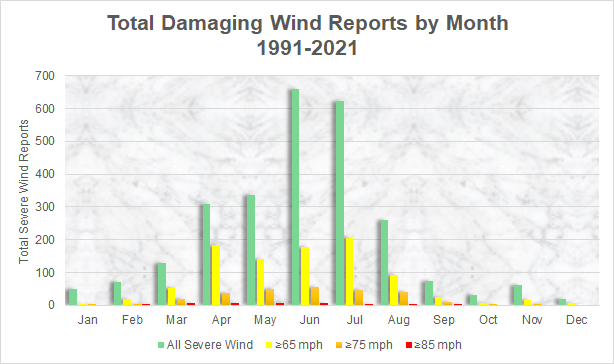
Damaging thunderstorm winds typically peak in occurrence during the summer, but begin to increase in frequency during the spring months.
 |
 |
A detailed local severe weather climatology is available at https://www.weather.gov/ilm/SevereClimo
Coastal Flooding Risk
There are two periods of concern for coastal flooding this spring, both associated with New Moons in April and May. Astronomical tides alone during both of these periods will approach within six inches of minor flood stage at the beaches. If a storm system is near the area or if persistent onshore winds are occurring during these times, coastal flooding could easily occur.
|
Wrightsville Beach, NC astronomical tides for April and May 2026. Higher tides associated with New Moons on April 17 and May 16 will create a heightened risk of coastal flooding. |
Our most significant coastal flooding usually occurs during late summer and fall during tropical cyclones or in the winter during strong Nor'easter storm systems. You can monitor total water level forecasts incorporating tides, storm surge, and other factors for three locations in our area using these resources:
Other Links of Interest
Research and Page Author: Tim Armstrong
Last Updated: March 6, 2026


 Coastal Flood