Lumberton, North Carolina Spring and Fall Freeze Statistics
|
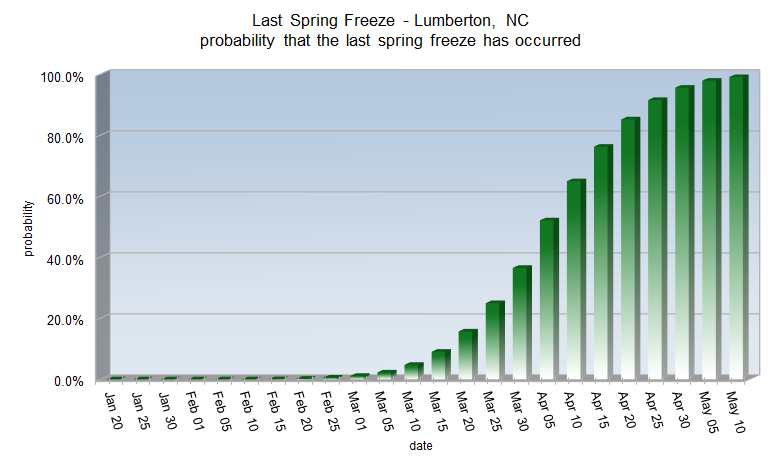
Lumberton's average date for the last spring freeze is April 4
Spring freeze statistics sorted by probability
| Probability |
Date |
| 1% |
Feb 28 |
| 5% |
Mar 10 |
| 10% |
Mar 15 |
| 25% |
Mar 25 |
| 50% |
Apr 4 |
| 75% |
Apr 14 |
| 90% |
Apr 23 |
| 95% |
Apr 29 |
| 99% |
May 9 |
Earliest last spring freeze: February 24, 1903
Latest last spring freeze: May 10, 1980
|
Spring freeze statistics sorted by date
| Date |
Probability |
| Jan 25 |
0.0% |
| Feb 1 |
0.0% |
| Feb 5 |
0.0% |
| Feb 10 |
0.0% |
| Feb 15 |
0.1% |
| Feb 20 |
0.2% |
| Feb 25 |
0.6% |
| Mar 1 |
1.2% |
| Mar 5 |
2.3% |
| Mar 10 |
4.8% |
| Mar 15 |
9.1% |
| Mar 20 |
15.7% |
| Mar 25 |
25.0% |
| Mar 30 |
36.6% |
| Apr 5 |
52.1% |
| Apr 10 |
65.0% |
| Apr 15 |
76.3% |
| Apr 20 |
85.2% |
| Apr 25 |
91.6% |
| Apr 30 |
95.6% |
| May 5 |
97.9% |
| May 10 |
99.1% |
|
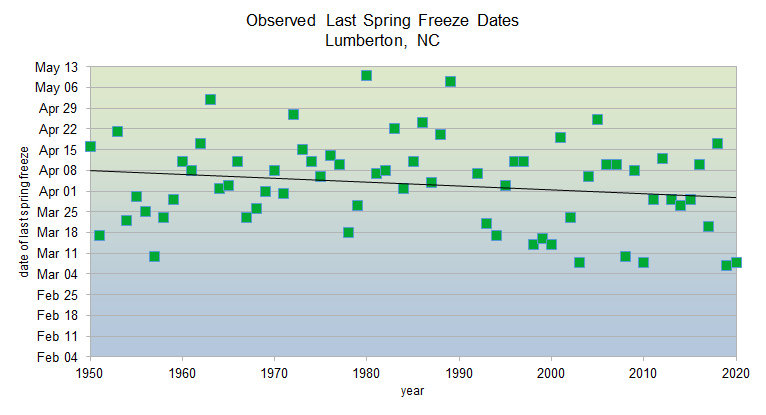
Since 1950, the date of Lumberton's last spring freeze has shifted 1.3 days earlier per decade.
|
|
Lumberton's average date for the first fall freeze is October 29
Fall freeze statistics sorted by probability
| Probability |
Date |
| 1% |
Sep 28 |
| 5% |
Oct 7 |
| 10% |
Oct 12 |
| 25% |
Oct 20 |
| 50% |
Oct 29 |
| 75% |
Nov 7 |
| 90% |
Nov 15 |
| 95% |
Nov 20 |
| 99% |
Nov 29 |
Earliest first fall freeze: October 3, 1981
Latest first fall freeze: December 1, 1948
|
Fall freeze statistics sorted by date
| Date |
Probability |
| Oct 1 |
1.6% |
| Oct 5 |
3.2% |
| Oct 10 |
7.0% |
| Oct 15 |
13.5% |
| Oct 20 |
23.2% |
| Oct 25 |
36.0% |
| Nov 1 |
56.5% |
| Nov 5 |
67.8% |
| Nov 10 |
79.8% |
| Nov 15 |
88.7% |
| Nov 20 |
94.3% |
| Nov 25 |
97.5% |
| Nov 30 |
99.0% |
| Dec 5 |
99.7% |
| Dec 10 |
99.9% |
| Dec 15 |
100.0% |
| Dec 20 |
100.0% |
| Dec 25 |
100.0% |
| Dec 30 |
100.0% |
|


Since 1950, the date of Lumberton's first fall freeze has shifted 1.8 days later per decade.
|
|
Lumberton's average growing season length is 208 days
Growing season statistics sorted by probability
| Probability |
Days |
| 1% |
259 |
| 5% |
244 |
| 10% |
236 |
| 25% |
223 |
| 50% |
208 |
| 75% |
193 |
| 90% |
180 |
| 95% |
172 |
| 99% |
157 |
Shortest growing season: 168 days in 1980
Longest growing season: 261 days in 1946
|
Growing season statistics sorted by days
| Days |
Probability |
| 160 |
98.6% |
| 170 |
95.9% |
| 180 |
90.0% |
| 190 |
79.6% |
| 200 |
64.6% |
| 210 |
46.8% |
| 220 |
29.6% |
| 225 |
22.3% |
| 230 |
16.1% |
| 235 |
11.2% |
| 240 |
7.4% |
| 245 |
4.7% |
| 250 |
2.9% |
| 255 |
1.7% |
| 260 |
0.9% |
| 270 |
0.2% |
| 280 |
0.1% |
| 290 |
0.0% |
| 300 |
0.0% |
|

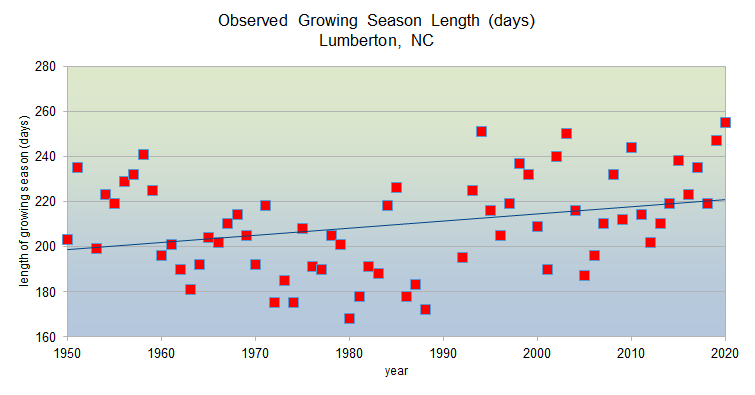
Since 1950, Lumberton's growing season has become 3.2 days longer per decade.
|
Research and Page Author: Tim Armstrong
Last Updated: February 28, 2021


 Coastal Flood