Wilmington, North Carolina Spring and Fall Freeze Statistics
|
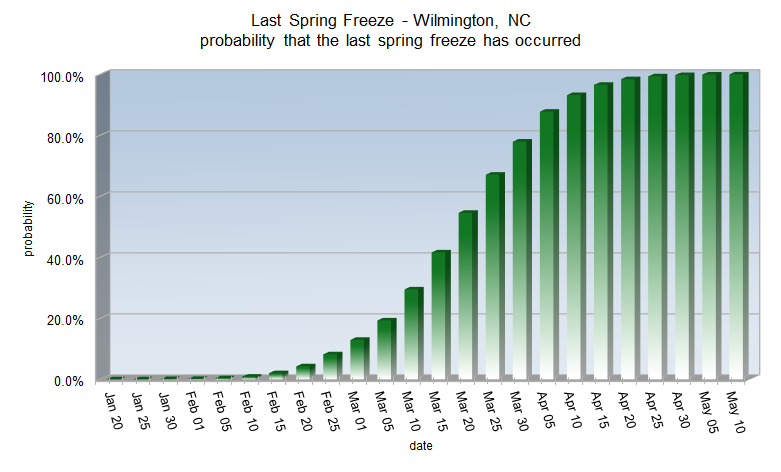
Wilmington's average date for the last spring freeze is March 18
Spring freeze statistics sorted by probability
| Probability |
Date |
| 1% |
Feb 10 |
| 5% |
Feb 21 |
| 10% |
Feb 26 |
| 25% |
Mar 7 |
| 50% |
Mar 18 |
| 75% |
Mar 28 |
| 90% |
Apr 6 |
| 95% |
Apr 12 |
| 99% |
Apr 22 |
Earliest last spring freeze: January 26, 1921
Latest last spring freeze: April 21, 1983
|
Spring freeze statistics sorted by date
| Date |
Probability |
| Jan 25 |
0.0% |
| Feb 1 |
0.2% |
| Feb 5 |
0.3% |
| Feb 10 |
0.9% |
| Feb 15 |
2.0% |
| Feb 20 |
4.3% |
| Feb 25 |
8.2% |
| Mar 1 |
13.0% |
| Mar 5 |
19.5% |
| Mar 10 |
29.5% |
| Mar 15 |
41.6% |
| Mar 20 |
54.6% |
| Mar 25 |
67.1% |
| Mar 30 |
77.9% |
| Apr 5 |
87.8% |
| Apr 10 |
93.2% |
| Apr 15 |
96.5% |
| Apr 20 |
98.4% |
| Apr 25 |
99.3% |
| Apr 30 |
99.7% |
| May 5 |
99.9% |
| May 10 |
100.0% |
|
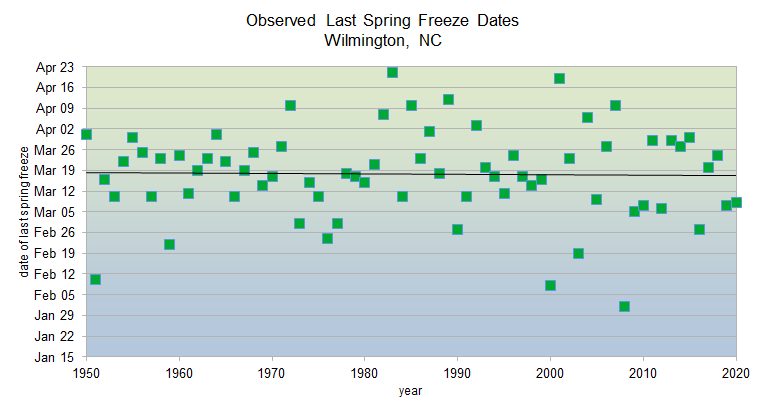
Since 1950, the date of Wilmington's last spring freeze has shifted 0.2 days earlier per decade.
|
|
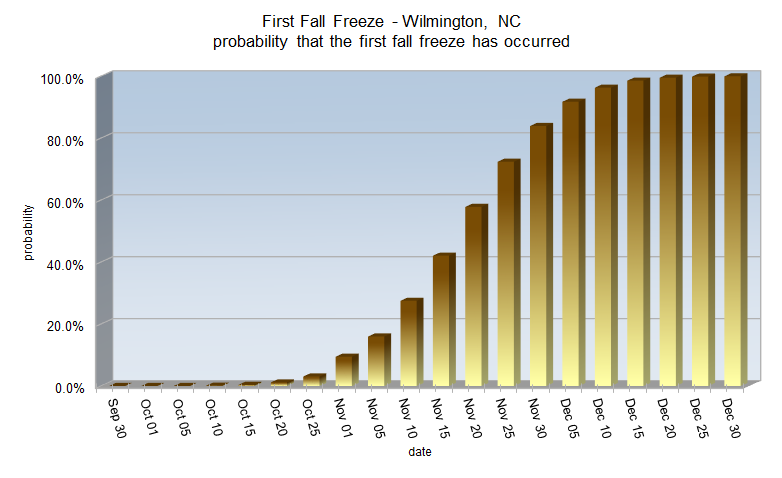
Wilmington's average date for the first fall freeze is November 17
Fall freeze statistics sorted by probability
| Probability |
Date |
| 1% |
Oct 19 |
| 5% |
Oct 27 |
| 10% |
Nov 1 |
| 25% |
Nov 9 |
| 50% |
Nov 17 |
| 75% |
Nov 26 |
| 90% |
Dec 3 |
| 95% |
Dec 8 |
| 99% |
Dec 16 |
Earliest first fall freeze: October 16, 1876
Latest first fall freeze: December 29, 1918
|
Fall freeze statistics sorted by date
| Date |
Probability |
| Oct 1 |
0.0% |
| Oct 5 |
0.0% |
| Oct 10 |
0.1% |
| Oct 15 |
0.4% |
| Oct 20 |
1.2% |
| Oct 25 |
3.1% |
| Nov 1 |
9.5% |
| Nov 5 |
16.0% |
| Nov 10 |
27.5% |
| Nov 15 |
42.1% |
| Nov 20 |
57.8% |
| Nov 25 |
72.4% |
| Nov 30 |
83.9% |
| Dec 5 |
91.8% |
| Dec 10 |
96.3% |
| Dec 15 |
98.6% |
| Dec 20 |
99.5% |
| Dec 25 |
99.9% |
| Dec 30 |
100.0% |
|
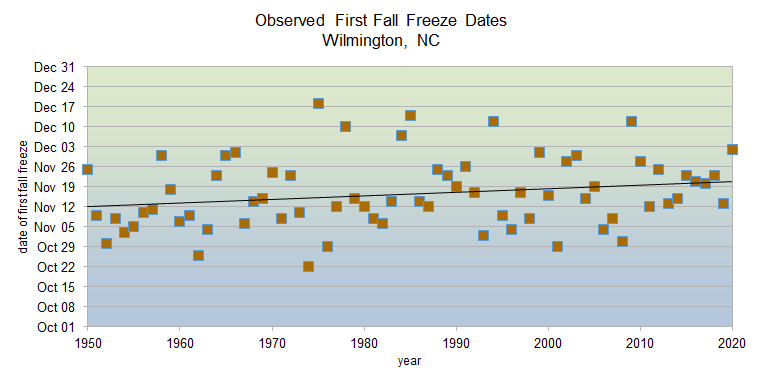
Since 1950, the date of Wilmington's first fall freeze has shifted 1.3 days later per decade.
|
|
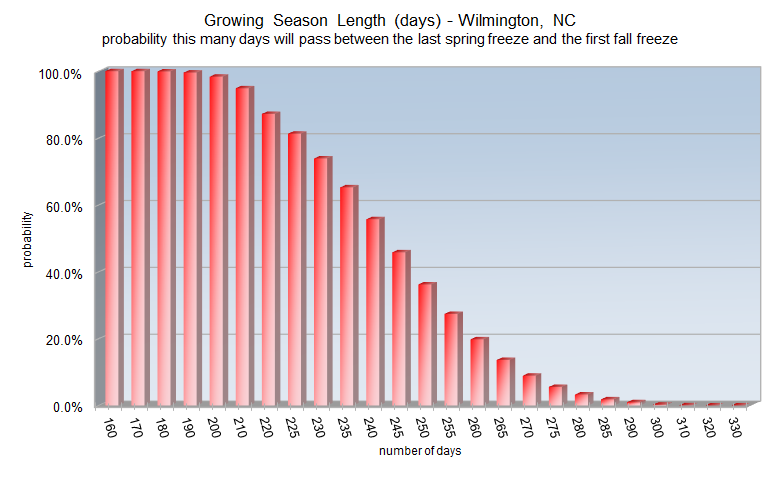
Wilmington's average growing season length is 243 days
Growing season statistics sorted by probability
| Probability |
Days |
| 1% |
290 |
| 5% |
276 |
| 10% |
269 |
| 25% |
256 |
| 50% |
243 |
| 75% |
229 |
| 90% |
217 |
| 95% |
210 |
| 99% |
196 |
Shortest growing season: 192 days in 2001
Longest growing season: 301 days in 1909
|
Growing season statistics sorted by days
| Days |
Probability |
| 160 |
100.0% |
| 170 |
100.0% |
| 180 |
99.9% |
| 190 |
99.6% |
| 200 |
98.3% |
| 210 |
94.9% |
| 220 |
87.2% |
| 225 |
81.3% |
| 230 |
73.9% |
| 235 |
65.3% |
| 240 |
55.7% |
| 245 |
45.8% |
| 250 |
36.2% |
| 255 |
27.4% |
| 260 |
19.8% |
| 270 |
8.9% |
| 280 |
3.3% |
| 290 |
1.0% |
| 300 |
0.2% |
|
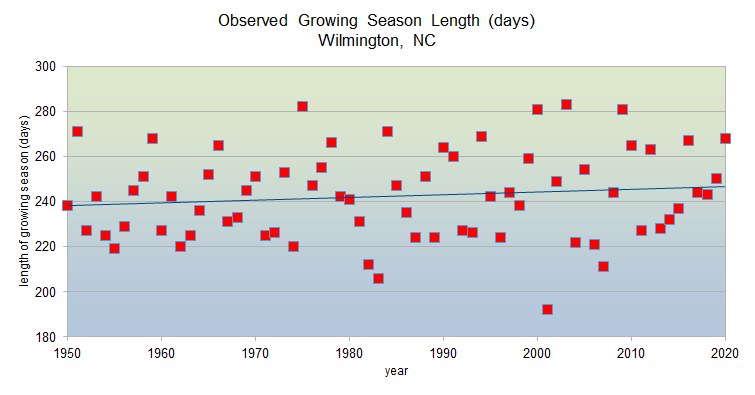
Since 1950, Wilmington's growing season has become 1.2 days longer per decade.
|
Research and Page Author: Tim Armstrong
Last Updated: February 28, 2021


 Coastal Flood