Florence, South Carolina Spring and Fall Freeze Statistics


			| 
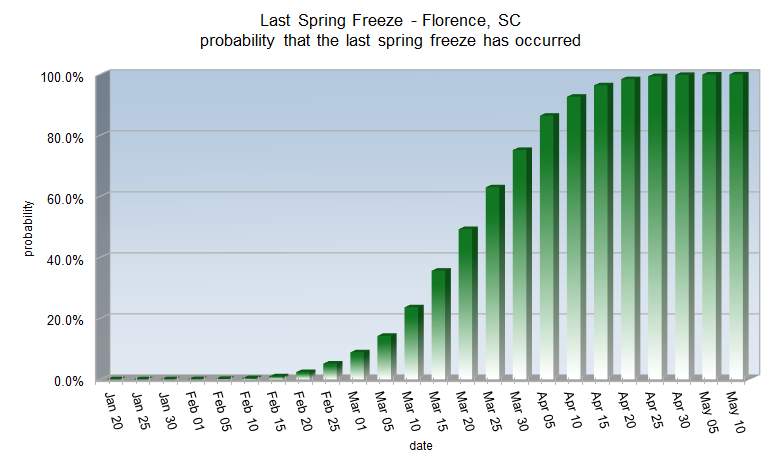
			 Florence's average date for the last spring freeze is  March 20 
			  
			Spring freeze statistics sorted by probability 


						| Probability | 
						Date | 
					 
					
						| 1% | 
						Feb 15 | 
					 
					
						| 5% | 
						Feb 24 | 
					 
					
						| 10% | 
						Mar 1 | 
					 
					
						| 25% | 
						Mar 10 | 
					 
					
						| 50% | 
						Mar 20 | 
					 
					
						| 75% | 
						Mar 29 | 
					 
					
						| 90% | 
						Apr 7 | 
					 
					
						| 95% | 
						Apr 12 | 
					 
					
						| 99% | 
						Apr 22 | 


			Earliest last spring freeze: Feb 10, 1975 
			Latest last spring freeze: April 20, 1983 
			 | 


			Spring freeze statistics sorted by date 


						| Date | 
						Probability | 
					 
					
						| Jan 25 | 
						0.0% | 
					 
					
						| Feb 1 | 
						0.0% | 
					 
					
						| Feb 5 | 
						0.1% | 
					 
					
						| Feb 10 | 
						0.4% | 
					 
					
						| Feb 15 | 
						1.0% | 
					 
					
						| Feb 20 | 
						2.4% | 
					 
					
						| Feb 25 | 
						5.2% | 
					 
					
						| Mar 1 | 
						8.9% | 
					 
					
						| Mar 5 | 
						14.3% | 
					 
					
						| Mar 10 | 
						23.6% | 
					 
					
						| Mar 15 | 
						35.6% | 
					 
					
						| Mar 20 | 
						49.3% | 
					 
					
						| Mar 25 | 
						63.0% | 
					 
					
						| Mar 30 | 
						75.2% | 
					 
					
						| Apr 5 | 
						86.4% | 
					 
					
						| Apr 10 | 
						92.7% | 
					 
					
						| Apr 15 | 
						96.4% | 
					 
					
						| Apr 20 | 
						98.4% | 
					 
					
						| Apr 25 | 
						99.4% | 
					 
					
						| Apr 30 | 
						99.8% | 
					 
					
						| May 5 | 
						99.9% | 
					 
					
						| May 10 | 
						100.0% | 


			 | 


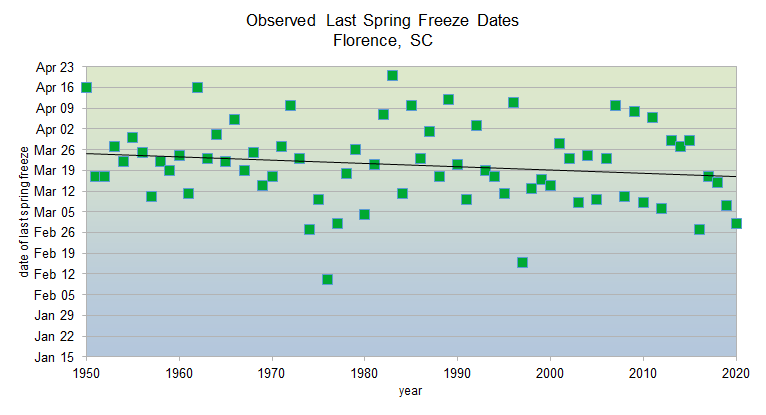
			Since 1950, the date of Florence's last spring freeze has shifted 1.1 days earlier per decade.    
			 | 


			| 
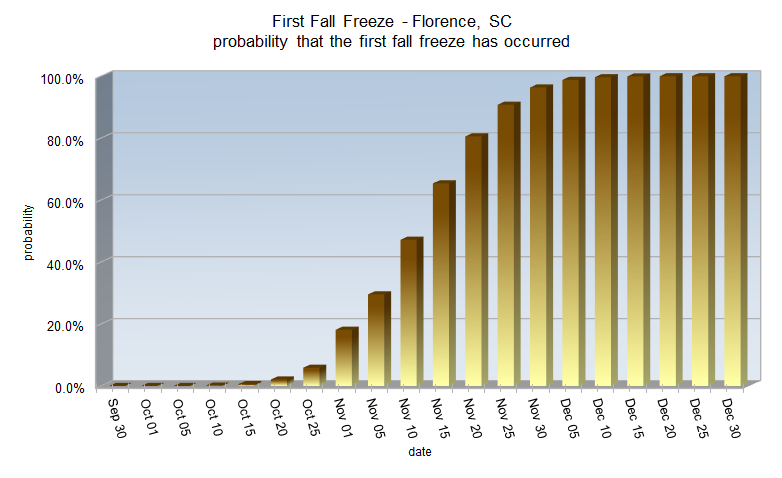
			 Florence's average date for the first fall freeze is  November 10 
			  
			Fall freeze statistics sorted by probability 


						| Probability | 
						Date | 
					 
					
						| 1% | 
						Oct 16 | 
					 
					
						| 5% | 
						Oct 24 | 
					 
					
						| 10% | 
						Oct 28 | 
					 
					
						| 25% | 
						Nov 3 | 
					 
					
						| 50% | 
						Nov 10 | 
					 
					
						| 75% | 
						Nov 17 | 
					 
					
						| 90% | 
						Nov 24 | 
					 
					
						| 95% | 
						Dec 5 | 
					 
					
						| 99% | 
						Dec 11 | 


			Earliest first fall freeze: October 14, 1988 
			Latest first fall freeze: December 11, 1948 
			 | 


			Fall freeze statistics sorted by date 


						| Date | 
						Probability | 
					 
					
						| Oct 1 | 
						0.0% | 
					 
					
						| Oct 5 | 
						0.0% | 
					 
					
						| Oct 10 | 
						0.2% | 
					 
					
						| Oct 15 | 
						0.6% | 
					 
					
						| Oct 20 | 
						2.1% | 
					 
					
						| Oct 25 | 
						5.9% | 
					 
					
						| Nov 1 | 
						18.2% | 
					 
					
						| Nov 5 | 
						29.6% | 
					 
					
						| Nov 10 | 
						47.2% | 
					 
					
						| Nov 15 | 
						65.4% | 
					 
					
						| Nov 20 | 
						80.6% | 
					 
					
						| Nov 25 | 
						90.8% | 
					 
					
						| Nov 30 | 
						96.4% | 
					 
					
						| Dec 5 | 
						98.8% | 
					 
					
						| Dec 10 | 
						99.7% | 
					 
					
						| Dec 15 | 
						99.9% | 
					 
					
						| Dec 20 | 
						100.0% | 
					 
					
						| Dec 25 | 
						100.0% | 
					 
					
						| Dec 30 | 
						100.0% | 


			 | 


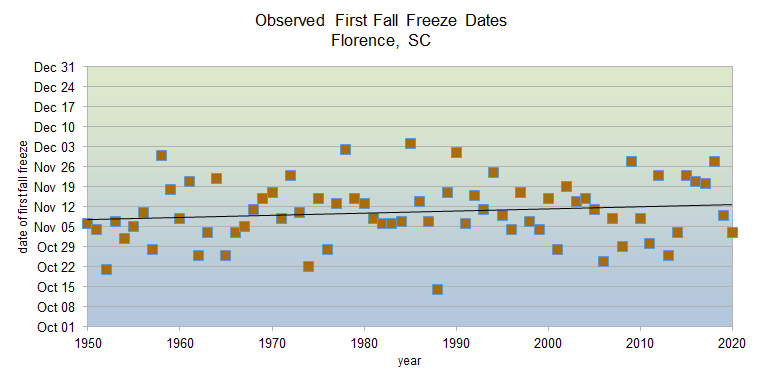
			Since 1950, the date of Florence's first fall freeze has shifted 0.8 days later per decade.  
			 | 


			| 
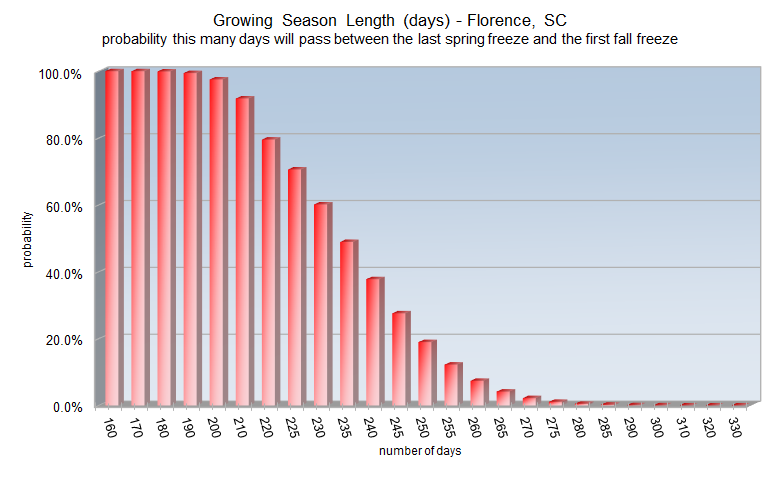
			 Florence's average growing season length is 235 days 
			  
			Growing season statistics sorted by probability 


						| Probability | 
						Days | 
					 
					
						| 1% | 
						275 | 
					 
					
						| 5% | 
						263 | 
					 
					
						| 10% | 
						257 | 
					 
					
						| 25% | 
						246 | 
					 
					
						| 50% | 
						235 | 
					 
					
						| 75% | 
						223 | 
					 
					
						| 90% | 
						212 | 
					 
					
						| 95% | 
						206 | 
					 
					
						| 99% | 
						194 | 


			Shortest growing season: 192 days in 1962 
			Longest growing season: 273 days in 1997 
			 | 


			Growing season statistics sorted by days 


						| Days | 
						Probability | 
					 
					
						| 160 | 
						100.0% | 
					 
					
						| 170 | 
						100.0% | 
					 
					
						| 180 | 
						99.9% | 
					 
					
						| 190 | 
						99.4% | 
					 
					
						| 200 | 
						97.5% | 
					 
					
						| 210 | 
						91.8% | 
					 
					
						| 220 | 
						79.5% | 
					 
					
						| 225 | 
						70.6% | 
					 
					
						| 230 | 
						60.1% | 
					 
					
						| 235 | 
						48.9% | 
					 
					
						| 240 | 
						37.8% | 
					 
					
						| 245 | 
						27.6% | 
					 
					
						| 250 | 
						18.9% | 
					 
					
						| 255 | 
						12.2% | 
					 
					
						| 260 | 
						7.4% | 
					 
					
						| 270 | 
						2.2% | 
					 
					
						| 280 | 
						0.5% | 
					 
					
						| 290 | 
						0.1% | 
					 
					
						| 300 | 
						0.0% | 


			 | 


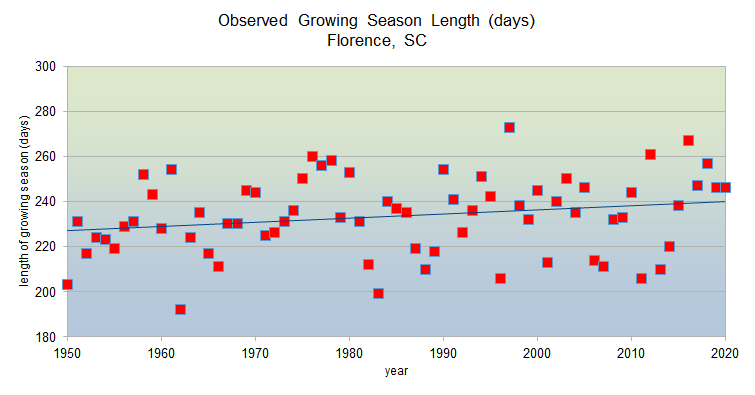
			Since 1950, Florence's growing season has become 1.8 days longer per decade.    
			 | 


Research and Page Author: Tim Armstrong
Last Updated: March 4, 2021