Marion, South Carolina Spring and Fall Freeze Statistics
|
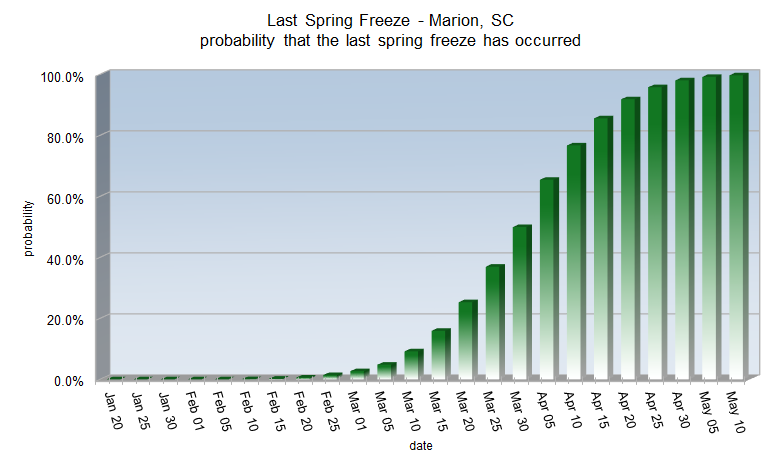
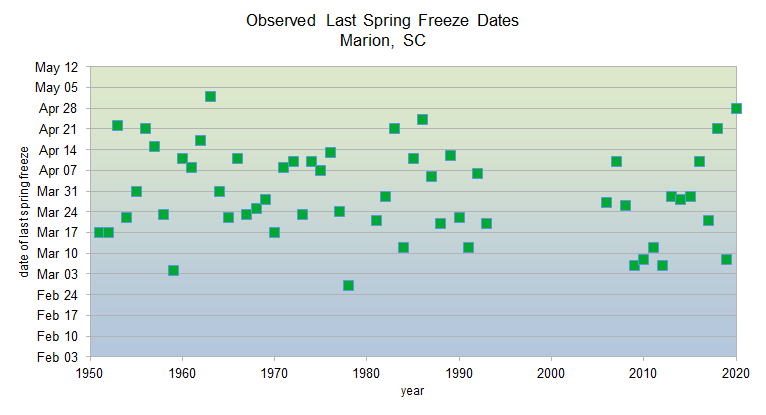
Marion's average date for the last spring freeze is March 30
Spring freeze statistics sorted by probability
| Probability |
Date |
| 1% |
Feb 22 |
| 5% |
Mar 5 |
| 10% |
Mar 10 |
| 25% |
Mar 19 |
| 50% |
Mar 30 |
| 75% |
Apr 9 |
| 90% |
Apr 18 |
| 95% |
Apr 23 |
| 99% |
May 4 |
Earliest last spring freeze: Feb 26, 1945
Latest last spring freeze: May 2, 1963
|
Spring freeze statistics sorted by date
| Date |
Probability |
| Jan 25 |
0.0% |
| Feb 1 |
0.0% |
| Feb 5 |
0.0% |
| Feb 10 |
0.1% |
| Feb 15 |
0.2% |
| Feb 20 |
0.6% |
| Feb 25 |
1.4% |
| Mar 1 |
2.7% |
| Mar 5 |
4.8% |
| Mar 10 |
9.2% |
| Mar 15 |
15.9% |
| Mar 20 |
25.3% |
| Mar 25 |
36.9% |
| Mar 30 |
49.9% |
| Apr 5 |
65.4% |
| Apr 10 |
76.7% |
| Apr 15 |
85.6% |
| Apr 20 |
91.8% |
| Apr 25 |
95.8% |
| Apr 30 |
98.0% |
| May 5 |
99.2% |
| May 10 |
99.7% |
|
Since 1950, Marion has 19 years of missing climate data. This makes it difficult to determine a statistically accurate change in spring freeze dates.
|
|
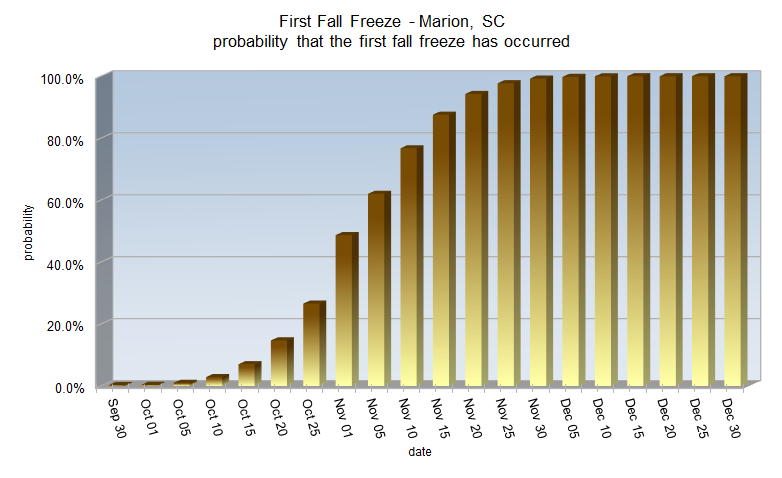
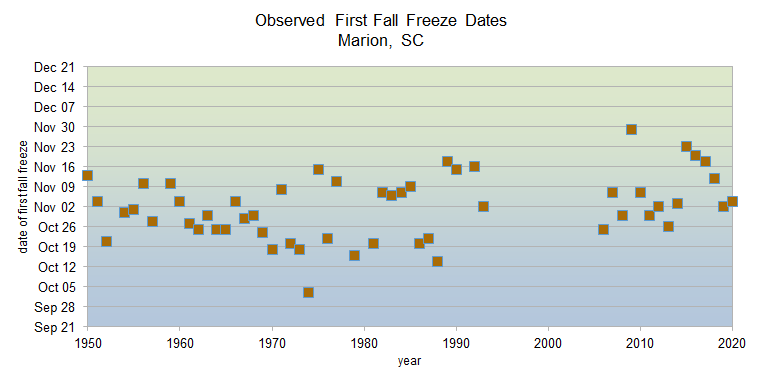
Marion's average date for the first fall freeze is November 1
Fall freeze statistics sorted by probability
| Probability |
Date |
| 1% |
Oct 4 |
| 5% |
Oct 12 |
| 10% |
Oct 17 |
| 25% |
Oct 24 |
| 50% |
Nov 1 |
| 75% |
Nov 9 |
| 90% |
Nov 16 |
| 95% |
Nov 20 |
| 99% |
Nov 28 |
Earliest first fall freeze: October 3, 1974
Latest first fall freeze: December 11, 1948
|
Fall freeze statistics sorted by date
| Date |
Probability |
| Oct 1 |
0.4% |
| Oct 5 |
1.0% |
| Oct 10 |
2.9% |
| Oct 15 |
7.1% |
| Oct 20 |
14.7% |
| Oct 25 |
26.6% |
| Nov 1 |
48.7% |
| Nov 5 |
62.0% |
| Nov 10 |
76.7% |
| Nov 15 |
87.6% |
| Nov 20 |
94.3% |
| Nov 25 |
97.7% |
| Nov 30 |
99.2% |
| Dec 5 |
99.8% |
| Dec 10 |
99.9% |
| Dec 15 |
100.0% |
| Dec 20 |
100.0% |
| Dec 25 |
100.0% |
| Dec 30 |
100.0% |
|
Since 1950, Marion has 19 years of missing climate data. This makes it difficult to determine a statistically accurate change in fall freeze dates.
|
|
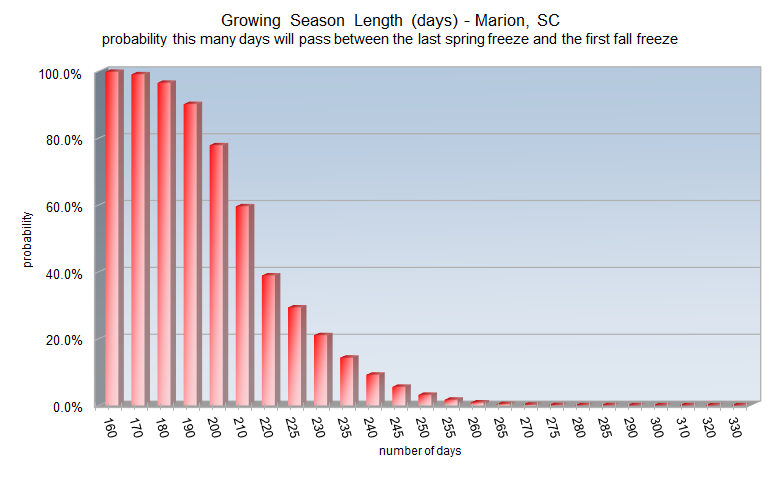
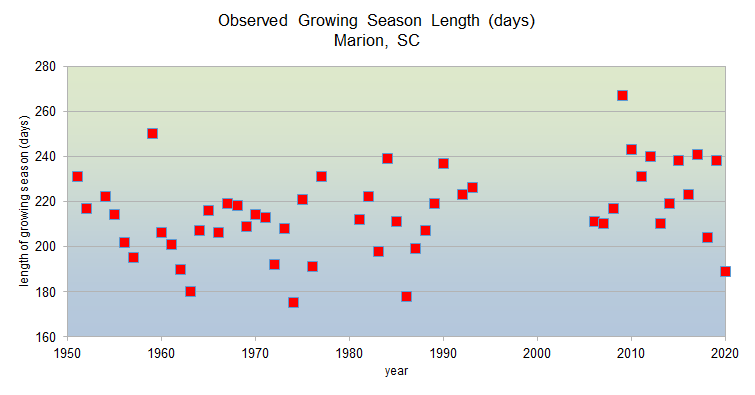
Marion's average growing season length is 215 days
Growing season statistics sorted by probability
| Probability |
Days |
| 1% |
259 |
| 5% |
246 |
| 10% |
239 |
| 25% |
227 |
| 50% |
215 |
| 75% |
202 |
| 90% |
190 |
| 95% |
183 |
| 99% |
170 |
Shortest growing season: 175 days in 1974
Longest growing season: 267 days in 2009
|
Growing season statistics sorted by days
| Days |
Probability |
| 160 |
99.8% |
| 170 |
99.0% |
| 180 |
96.5% |
| 190 |
90.1% |
| 200 |
77.8% |
| 210 |
59.6% |
| 220 |
38.9% |
| 225 |
29.3% |
| 230 |
21.0% |
| 235 |
14.3% |
| 240 |
9.2% |
| 245 |
5.6% |
| 250 |
3.2% |
| 255 |
1.7% |
| 260 |
0.9% |
| 270 |
0.2% |
| 280 |
0.0% |
| 290 |
0.0% |
| 300 |
0.0% |
|
Since 1950, Marion has 19 years of missing climate data. This makes it difficult to determine a statistically accurate change in growing season length.
|
Research and Page Author: Tim Armstrong
Last Updated: March 6, 2021


 Coastal Flood