September is the beginning of meeorological fall -- a transition season when lowering sun angles, shorter days, and longer nights cause temperatures to drop. Cold fronts bringing cooler and drier air from Canada will begin to arrive as fall progresses. High temperatures normally in the 80s throughout September fall into the mid 60s by the end of November. Late fall is also when many locations across the eastern Carolinas will experience their first frosty morning since last winter or spring.
How is meteorological fall different from fall on the calendar?
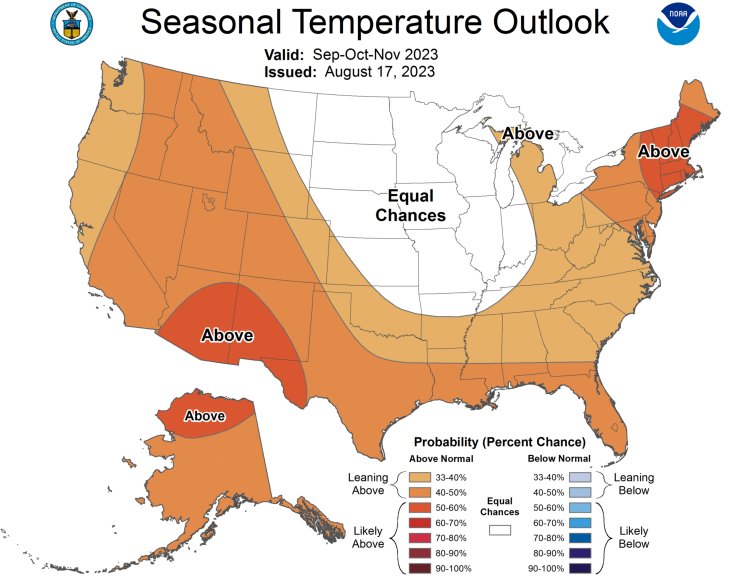
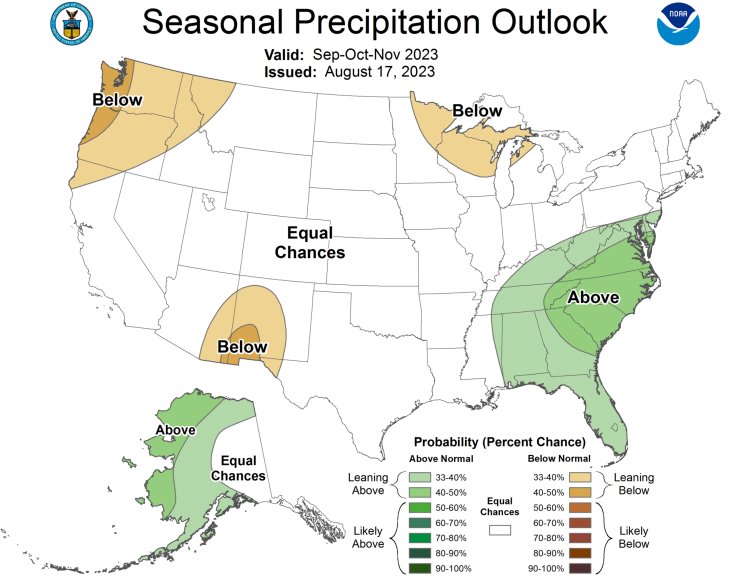
The NWS Climate Prediction Center is predicting a slightly increased chance for above normal temperatures across the Southeast this fall. Their precipitation outlook shows a slightly increased potential for above normal rainfall across all of North and South Carolina.
|
Fall 2023 temperature outlook from the Climate Prediction Center |
Fall 2023 precipitation outlook from the Climate Prediction Center |
Temperatures
Factors that may affect temperatures across the Carolinas this fall include:
Recent Climate Change is being caused by increasing atmospheric concentration of greenhouse gases from the extraction and burning of fossil fuels and the clearing of forests. Greenhouse gases such as carbon dioxide and methane trap heat within the atmosphere that would otherwise radiate out into space. Average temperatures across the Carolinas have increased by over 1° F since record-keeping began, somewhat less than the nearly 2° F average increase for the planet as a whole.
Climate.gov: How have global temperatures changed?
NC Climate Office: Climate Change in North Carolina
|
|
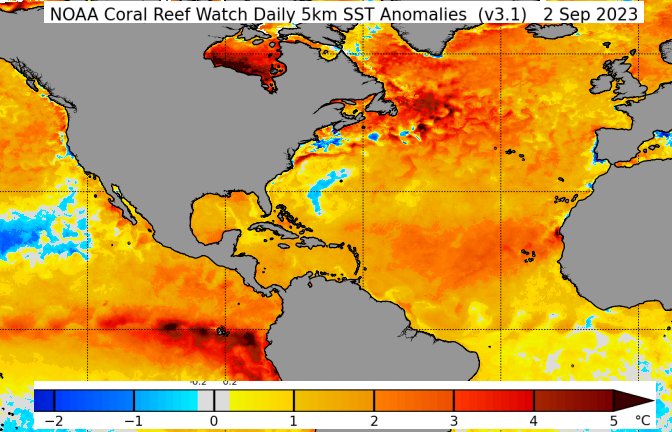
Also of concern are above-normal sea surface temperatures across much of the North Atlantic Ocean. (See graphic at right) Between the Carolinas and Bermuda water temperatures are close to normal. But near the Canadian maritime provinces and across the tropical Atlantic off the African coast sea water temperatures are as much as 2° to 5° C (3.6° to 9.0° F) above normal. Air moving across unusually warm ocean water will remain warm itself, possibly affecting our air temperatures through the fall and into the coming winter too.
El Niño, a natural periodic warming of ocean waters across the tropical Pacific ocean, causes shifts in the weather across large portions of the planet. Across the Carolinas, El Niño is well known for its tendency to help create wet winters. But during the fall months El Niño's biggest local influence can be its suppression of tropical storms and hurricanes across the Atlantic Ocean. This is due to increased Atlantic wind shear that often accompanies El Niño, weakening some storms while preventing others from forming at all.
What are El Niño and La Niña and how do they affect the weather?
Last winter the "El Niño Southern Oscillation" (ENSO) was in its cold phase known as La Niña. La Niña transitioned to neutral ENSO conditions during the spring, then to El Niño this summer.
Over the past 20 years there have been three times when winter La Niña conditions quickly transitioned to El Niño: 2018, 2009, and 2006. The following table shows how local September through November temperatures compared to normal during each of these years.
| Wilmington | Lumberton | N. Myrtle Beach | Florence | |
| 1991-2020 AVERAGE FALL TEMPERATURE | 65.6° | 63.9° | 66.0° | 65.2° |
| 2018 observed (anomaly) | 67.7° (+2.1°) | 66.7° (+2.8°) | 68.4° (+2.4°) | 67.4° (+2.2°) |
| 2009 observed (anomaly) | 65.3° (-0.3°) | 64.0° (+0.1°) | 67.2° (+1.2°) | 64.5° (-0.7°) |
| 2006 observed (anomaly) | 63.8° (-1.8°) | 62.3° (-1.6°) | 64.0° (-2.0°) | 63.4° (-1.8°) |
| Recent El Niño Averages (anomaly) | 65.6° (+0.0) | 64.3° (+0.4°) | 66.5° (+0.5°) | 65.1° (-0.1°) |
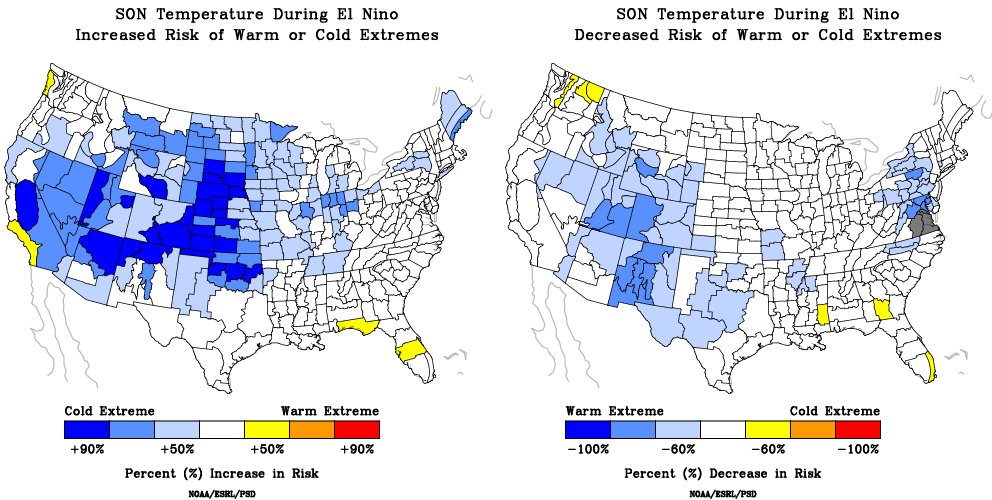
Although the fall of 2018 was very warm, the same climate setup in the fall of 2006 produced cooler than normal readings. This is admittedly a small sample but El Niño appears to have little consistent impact on our fall temperatures in the Carolinas. Research from NOAA's Physical Sciences Laboratory also confirms that eastern North and South Carolina temperatures during the fall are not significantly affected by El Niño.
|
Change in risk of warm or cold temperature extremes during the fall months (September - November) during El Niño years. The eastern Carolinas see no significant impact. Research and graphics from NOAA PSD. |
The first freezing temperatures of the fall usually reach the eastern Carolinas before Thanksgiving Day. The average date of the first freeze ranges from October 29 in Lumberton, NC to November 21 in Georgetown, SC, but there is considerable year-to-year variability. This first freeze thankfully brings an end to mosquitoes, but also to summer gardens as tomatoes, peppers, and other annual plants are killed.
In Wilmington, the season's first freeze has occurred as early as October 16 (in 1878) and as late as December 29 (in 1918). But in Southport, NC first freeze dates have been even more extreme: the 1945 growing season didn't end in Southport until temperatures finally fell to freezing on January 10, 1946! That growing season of 327 days is the longest on record for any local city.
|
|
|
Rainfall & Tropical Cyclones
|
Hurricanes Matthew and Florence brought severe flooding to the Carolinas in 2016 and 2018. Tropical moisture brought in by Hurricane Joaquin caused catastrophic South Carolina flooding in 2015. Fall seasons without hurricanes are often quite dry. |
Fall in the Carolinas is associated with tremendous rainfall variability from year to year. This is mainly due to the uneven distribution of Atlantic tropical storms and hurricanes.
In fall seasons without a landfalling tropical cyclone across the Carolinas, it's tough for seasonal rainfall totals to reach the long term average regardless of whether we have La Niña, neutral, or El Niño conditions in place. These quiet fall seasons sometimes see September through November rainfall totals less than 10 inches accompanied by developing drought conditions.
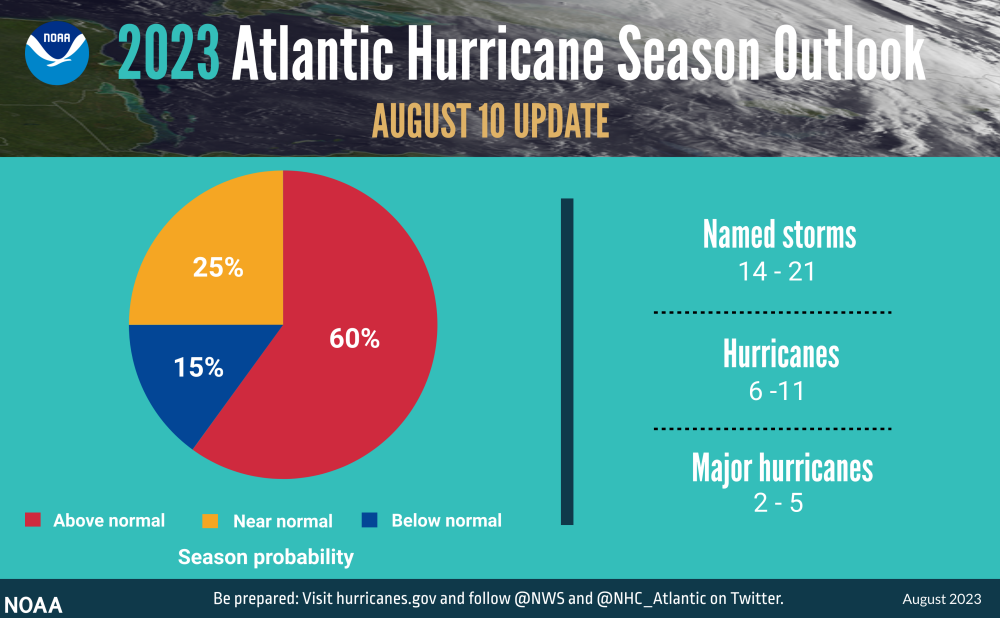
El Niño tends to create less active hurricane seasons compared to either neutral or La Niña years - however, exceptionally high water temperatures observed across most of the Atlantic Ocean this fall could offset El Niño's typical influence. This is why NOAA's seasonal hurricane outlook continues to show an above average number of storms.
The Climate Prediction Center is calling for "equal chances" for below, near, or above normal precipitation throughout the month of September. However for the fall season through November their outlook is for an increased potential for above normal precipitation. This implies the risk for larger rainfall totals may be from El Niño-enhanced rainfall events developing later in the year beyond September.
The following table shows how rainfall totals compared to normal during each of the fall seasons over the past 20 years when a winter La Niña quickly transitioned to El Niño.
| Wilmington | Lumberton | N. Myrtle Beach | Florence | |
| 1991-2020 AVG. FALL RAINFALL | 16.91" | 10.17" | 14.14" | 10.58" |
| 2018 observed (anomaly) | 32.75" | 26.36" | 23.32" | 19.65" |
| 2009 observed (anomaly) | 15.69" | 6.95" | 11.64" | 8.78" |
| 2006 observed (anomaly) | 17.34" | 10.91" | 12.61" | 11.36" |
| Recent El Niño Averages (anomaly) | 21.93" | 14.74" | 15.86" | 13.26" |
The Climate Prediction Center updated its seasonal hurricane outlook in August to increase the overall number of storms to 14 to 21, and to increase the odds to 60 percent that this hurricane season will see above normal activity. The Atlantic Hurricane Season runs through November 30.
 |
Across the eastern Carolinas fall is typically the most active portion of the hurricane season. Since 1870 when weather records began in Wilmington, over half (57 percent) of all tropical cyclones which produced measured tropical storm force (39 mph) or greater gusts have occurred in September or October.
| Month | Number of storms which produced 39+ mph gusts at the Wilmington NWS/Weather Bureau since 1870 | Percent of all storms |
| May | 2 storms | 3% |
| June | 3 storms | 4% |
| July | 8 storms | 11% |
| August | 19 storms | 25% |
| September | 30 storms | 40% |
| October | 13 storms | 17% |
Preparedness for hurricanes starts now. NOAA maintains a curated list of resources for help get you and your family ready: https://www.noaa.gov/hurricane-prep
Fall Beach Hazards
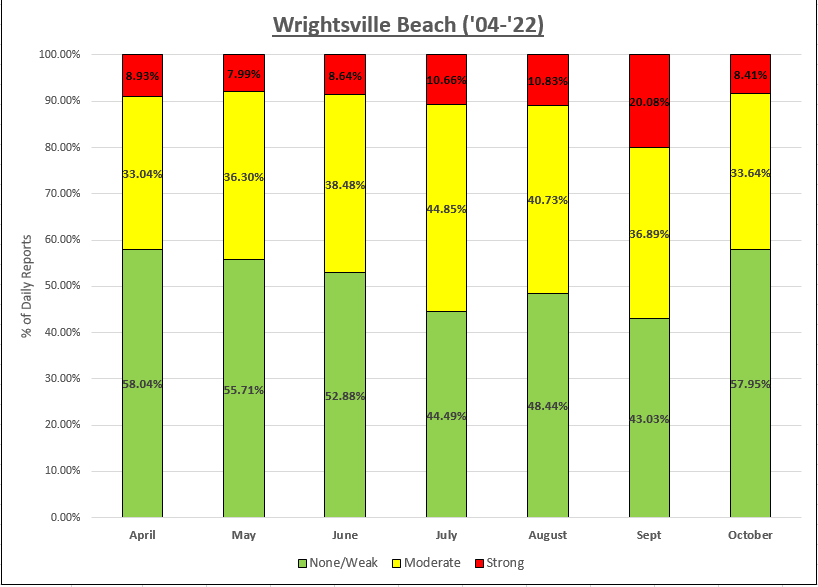
Tropical storms and hurricanes can have impacts on the beaches of North and South Carolina even when the storms are located thousands of miles away. Long-period swells generated by hurricanes travel great distances across the ocean and can create large surf and dangerous rip currents when they reach the beaches. Since 2004 when the National Weather Service in Wilmington began collecting daily surf reports from lifeguards, September has been the most active month for "moderate" or "strong" rip current reports -- often the result of waves generated by hurricanes well offshore.
NOAA/USLA Rip Current Safety Toolkit
|
Monthly compilation of lifeguard supplied rip current reports from Wrightsville Beach 2004 through 2022. September has the highest incidence of moderate or strong rip currents of any month during the warm season. Graphic: Meteorologist Vicky Oliva. |
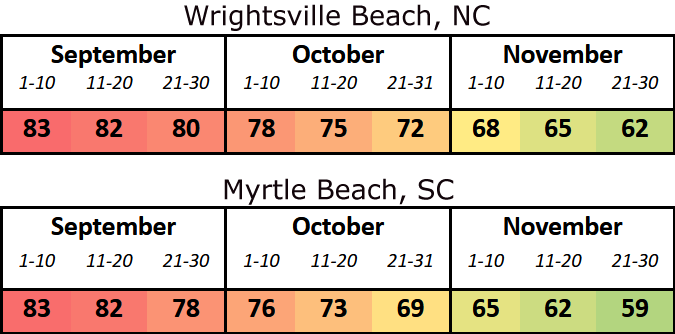
Ocean water temperatures will cool over the next few months due to longer nights and cooler air temperatures. Temperatures in the surf typically fall into the 70s by the beginning of October, and into the 60s by the beginning of November.
|
Average ocean water temperatures for Wrightsville Beach, NC and Myrtle Beach, SC through the fall season |
If your plans include spending time in the water this fall, first check our beach forecasts which include surf height, temperatures, lightning risk, rip current risk, and more.
Coastal Flooding Potential
There are several periods this fall when astronomical tides will be large enough to cause concern for coastal flooding at our local beaches and along tidal creeks and rivers. "Sunny day" flood events occur when strong winds or storms are not necessary to create minor coastal flooding due to tides high enough by themselves. Specific dates when this type of flooding could occur include:
Tides will be particularly high during September's Full Moon (September 29) and during October's Full Moon (October 28.) These full moons are within 2-3 days of the Moon's monthly perigee -- its closest approach in its orbit to Earth when the Moon's tidal influence is strongest.
Landfalling tropical storms or hurricanes can produce coastal flooding regardless of the astronomical tides. And as we move into November, non-tropical storms called Nor'easters can produce strong winds and coastal flooding too.
|
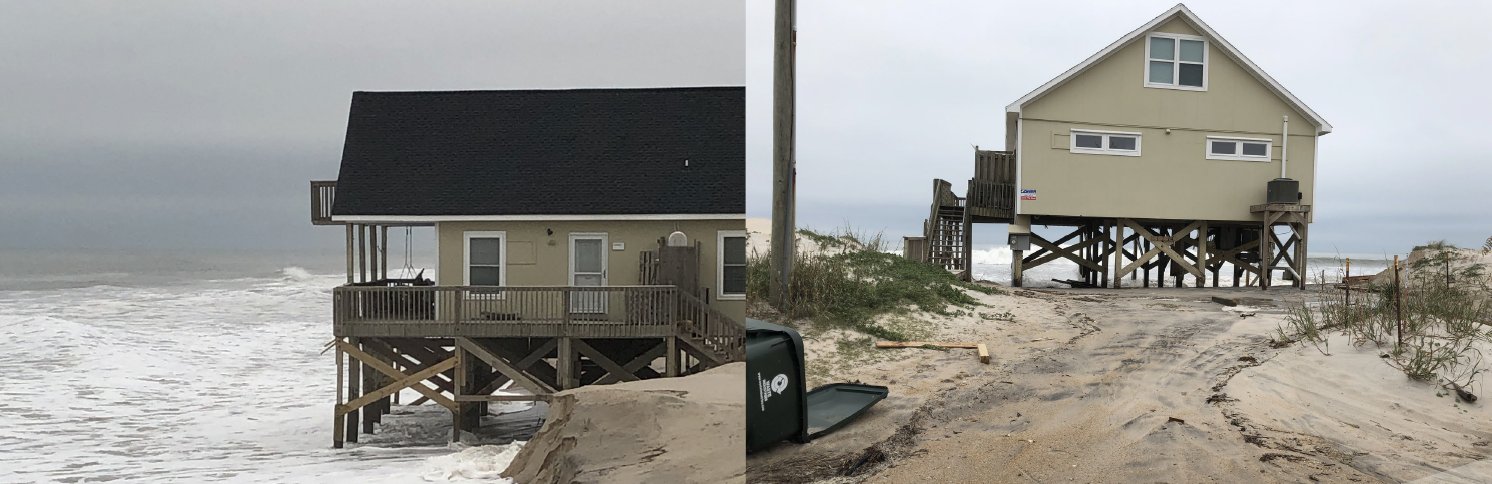
A significant coastal storm in November 2019 produced coastal flooding and beach erosion. This photo provided by Surf City Emergency Management shows surf eroding sand from beneath a home on the beach. |
River Flooding Potential
Rainfall totals this summer were near normal to slightly above normal for most locations across the eastern Carolinas. Although some spots became abnormally dry for brief periods during June and August, at no point did drought conditions develop across southeastern North Carolina or northeastern South Carolina.
Conditional river simulations from the NWS Southeast River Forecast Center (SERFC) show the chances for river flooding this fall are near normal to slightly below normal. Rainfall from Tropical Storm Idalia back in August will keep water levels high along the Waccamaw River through the middle portion of September.
Conditional river simulations and other current and forecast river information are available for a number of points along local rivers:
|
Record river flooding unleashed by Hurricane Florence in September 2018 destroyed a section of U.S. Highway 421 just north of Wilmington |
Waccamaw River
Lumber River
Cape Fear & Northeast Cape Fear Rivers
Black Creek & Pee Dee River
Lynches River
Black River
Additional Reading
NOAA Hurricane Season Outlook August 2023 Update: https://www.cpc.ncep.noaa.gov/products/outlooks/hurricane.shtml
CPC: ENSO Recent Evolution, Current Status and Predictions
National Ocean Service High Tide Flooding Outlook: https://tidesandcurrents.noaa.gov/high-tide-flooding/monthly-outlook.html
NWS Wilmington Tropics Main Page: https://www.weather.gov/ilm/tropical
NWS Wilmington Significant Local Events Archive: https://www.weather.gov/ilm/SignificantLocalEvents
Daily Climate Normals and Records for Wilmington, Florence, North Myrtle Beach, and Lumberton.
Research and Author: Tim Armstrong
Last Updated: September 7, 2023


 Coastal Flood