NWS Birmingham, Alabama
Weather Forecast Office
Tornado Outbreak - February 17th, 2008
Event Summary for Central Alabama
A strong upper level low ejected out of the Southern Plains and tracked across the Tennessee Valley on February 17th. Strong southerly winds dramatically increased the moisture content across Central Alabama in a short period of time. Surface dew points rose into the 60s across a large part of the area. The skies actually cleared for a time in many areas allowing temperatures to soar into the 70s. An upper level jet streak and the strong upper low provided upper level lift, moisture was plentiful at several levels, and atmospheric instability was sufficient enough for supercell development.
Before noon, a broken squall line, containing supercells, developed along the Alabama Mississippi state line and tracked eastward across Central Alabama. These storms intensified during the afternoon hours. By sunset, damage was reported at numerous locations generally along and south of a line from Demopolis to Wedowee.
Tornado watches were in effect for portions of Central Alabama between 530 am and 800 pm. A total of 26 tornado warnings and 7 severe thunderstorm warnings were issued between 1059 am and 505 pm by the National Weather Service Forecast Office in Birmingham.
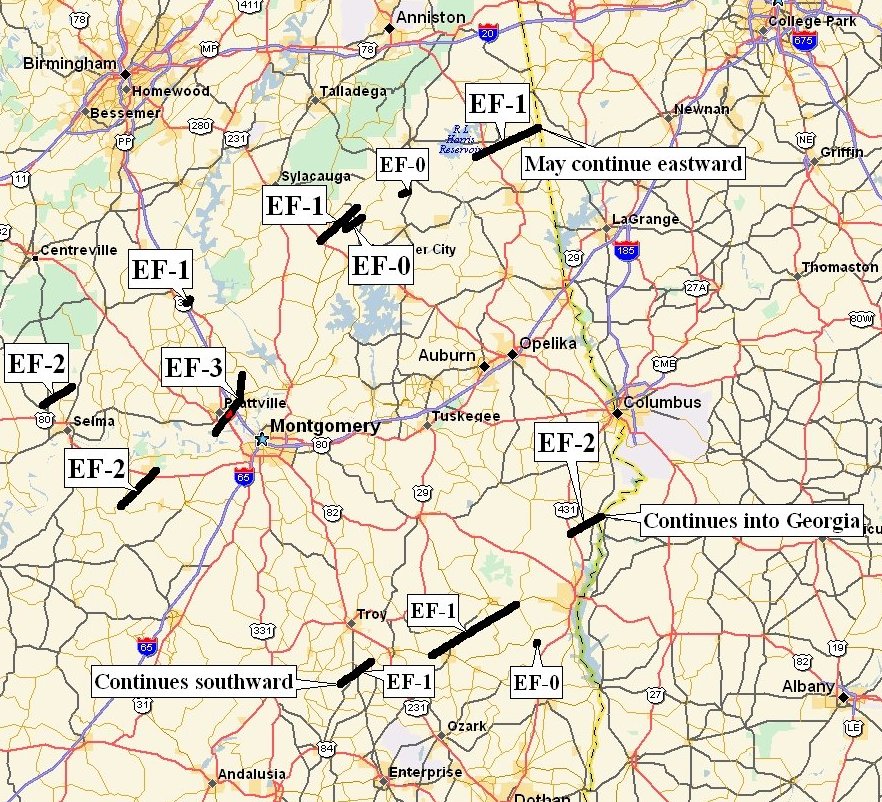
The following tornado damage paths have been identified in Central Alabama:
EF-3 Prattville/Millbrook Tornado- Autuaga & Elmore Counties
EF-2 Collirene Tornado - Lowndes County
EF-2 Cottonton Tornado - Russell County
EF-2 Summerfield Tornado - Dallas County
EF-1 Wedowee Tornado - Randolph County
EF-1 Clanton Tornado - Chilton County
EF-1 Spring Hill Tornado - Pike County
EF-1 Goodwater Tornado - Coosa & Tallapoosa Counties
EF-0 Bakerhill Tornado- Barbour County
EF-1 Gaino Tornado - Barbour County
EF-1 Blue Springs Tornado - Barbour County
EF-0 Mellow Valley Tornado - Clay County
EF-0 Hackneyville Tornado - Tallapoosa CountyPreliminary Local Storm Reports
Central Alabama Tornado Damage Paths
Severe Weather Episode Data
|
|
||||||||||||||||||||
Current Hazards
National Outlooks
Tropical
Local Storm Reports
Public Information Statement
Graphical Hazardous Weather Outlook
Current Conditions
Regional Weather Roundup
Rivers and Lakes
Drought Monitor
Forecasts
Graphical Forecasts
Forecast Discussion
Air Quality
Fire Weather
Aviation Weather
Climate and Past Weather
Past Events
Storm Data
Tornado Database
Daily Rainfall Plots
Tropical Cyclone Reports
Warnings and Other Products
Tornado Warnings
Severe Thunderstorm Warnings
Flash Flood Warnings
Winter Weather Warnings
Special Weather Statements
Non-Precipitation Warnings
Flood/River Flood Warnings
Productos en Español
Conciencia y Preparación
Previsión de 7 Días
Weather Safety
NOAA Weather Radio
Severe Weather Preparedness
Severe Safety Rules
Tornado Safety Rules
Severe Safety w/ ASL
Awareness Weeks
Severe Weather
Hurricane Preparedness
Summer Safety Campaign
Winter Weather
US Dept of Commerce
National Oceanic and Atmospheric Administration
National Weather Service
NWS Birmingham, Alabama
465 Weathervane Road
Calera, AL 35040
205-664-3010
Comments? Questions? Please Contact Us.