| |
Temperatures |
Precipitation |
| Site |
Max |
Min |
Avg |
Norm |
Dep |
Hi |
Lo |
Sum |
Norm |
Dep |
| Fayetteville (NW AR) |
93.0 |
68.4 |
80.7 |
76.9 |
+3.8 |
103 |
56 |
3.37 |
3.17 |
+0.20 |
| Harrison (NC AR) |
89.1 |
68.0 |
78.5 |
77.6 |
+0.9 |
99 |
56 |
3.78 |
3.42 |
+0.36 |
| Jonesboro (NE AR) |
90.3 |
69.6 |
80.0 |
80.0 |
0.0 |
102 |
61 |
3.12 |
3.41 |
-0.29 |
| Fort Smith (WC AR) |
96.9 |
74.2 |
85.5 |
82.3 |
+3.2 |
107 |
63 |
2.65 |
3.60 |
-0.95 |
| Little Rock (C AR) |
95.7 |
75.3 |
85.5 |
80.8 |
+4.7 |
107 |
65 |
1.81 |
3.16 |
-1.35 |
| Texarkana (SW AR) |
98.5 |
74.6 |
86.5 |
82.0 |
+4.5 |
107 |
64 |
1.19 |
2.98 |
-1.79 |
| El Dorado (SC AR) |
95.4 |
72.4 |
83.9 |
81.8 |
+2.1 |
103 |
61 |
2.32 |
3.40 |
-1.08 |
| Pine Bluff (SE AR) |
97.1 |
74.1 |
85.6 |
80.9 |
+4.7 |
107 |
63 |
1.37 |
3.38 |
-2.01 |
Temperatures were generally well above average with precipitation amounts generally below average.
| |
| Temperature records broken in August. Check out the records below. |
| Site |
Record High (Date of Occurrence) |
| Jacksonville/LR AFB |
104T (8/25) |
| Little Rock |
103T (8/25), 107 (8/26) |
| Monticello |
102 (8/24) |
| Mount Ida |
105T (8/26) |
| North Little Rock |
101 (8/24) |
| |
|
Some parts of the state received near normal amounts of rainfall, but for many locations hot and dry conditions occurred. While this is not unusual for August since it is on average the hottest/driest month of the year across Arkansas, above normal temperatures and below normal rainfall led to an increase in wildfire danger and drought conditions by the end of the month. There wasn't much severe weather in Arkansas during the month but a few rounds of active weather occurred. What was likely the most unique severe weather report for August occurred on August 7th when tennis ball size hail fell across north central Arkansas.
|
|
|
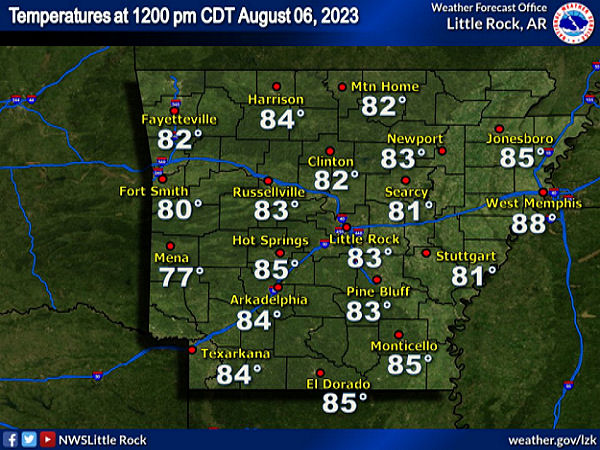
| In the picture: Temperatures as of 12 PM on August 6th were in the 70s and 80s across the state. |
|
| |
|
After a hot start to the month with a few rounds of rain and thunderstorms across the state cooler temperatures were observed from August 6-8. In many places, high temperatures were more than 15 degrees below normal for early August. This cooldown have many hope for an early Fall, but much hotter weather returned and persisted through much of the month.
|
|
|
| In the picture: The hottest day of the year at many locations occurred on August 26th when numerous sites recorded highs at or above 105. |
|
| |
|
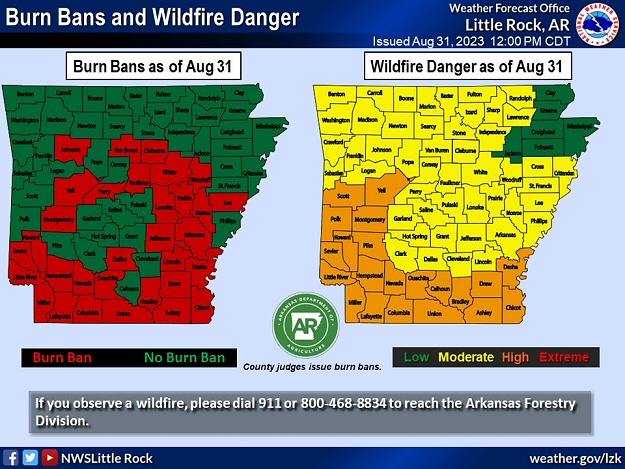
Conditions continued to dry out for much of the mid to later part of the month which led to worsening wildfire danger and drought conditions. The hottest day of the year for much of the state occurred on August 26th when highs were at or above 105 at several sites. Toward the end of the month there was some relief from the heat, but this wouldn't last long as hot temperatures returned in early September.
|
|
|
| In the picture: Two maps of Arkansas that shows counties under burn bans and wildfire danger as of August 31st. |
| Number of 100° (or higher) Days in 2023 (through 8/31) |
| Site |
Number of 100° Days |
| Texarkana |
23 |
| Fort Smith |
22 |
| Pine Bluff |
20 |
| Little Rock |
15 |
| Hot Springs |
14 |
| Russellville |
11 |
| Fayetteville |
8 |
| North Little Rock |
8 |
| Monticello |
5 |
| Temperature and Precipitation Trends |
| |
 |
| In the picture: Temperatures at Little Rock (Pulaski County). Click to enlarge. |
|
 |
| In the picture: Precipitation at Little Rock (Pulaski County). Click to enlarge. |
|
 |
| In the picture: Precipitation across Arkansas. |
|
|
|