Analysis of the 31 May 2008 South-central/Southeast Kansas Early Morning Very Large Hail Event
Andy Kleinsasser
National Weather Service, Wichita, KS
29 January 2009
1. Introduction
During the predawn hours of May 31, 2008 between roughly 0900 and 1400 UTC, numerous elevated supercells producing very large hail affected much of south-central Kansas, as well as portions of Central and southeast Kansas. These storms trained east-southeast, with the harder hit areas including Reno, Sedgwick, extreme southern Harvey, Kingman, northern Sumner, southern Butler, Elk and Montgomery counties, where hailstone sizes ranged from 1 to 2.25 inches in diameter (quarters-tennis balls). However, Cowley and Chautauqua counties, namely in and near the communities of Burden, Dexter, New Salem, Cedar Vale and Chautauqua, were hardest hit, where hailstone diameters ranged from 2.75 to 4.25 inches (baseballs-softballs). Click here for a map and listing of SPC storm reports. Some locations across south-central and southeast Kansas were hit more than once with the very large hail that morning, since much of the activity redeveloped and trained over the same areas. The Wichita WFO received 17 reports of golfball size or larger hail that morning, and issued 24 convective warnings, all of which were severe thunderstorm warnings. The large hail, which at times was driven by strong winds, inflicted nearly $20 million dollars in damage.
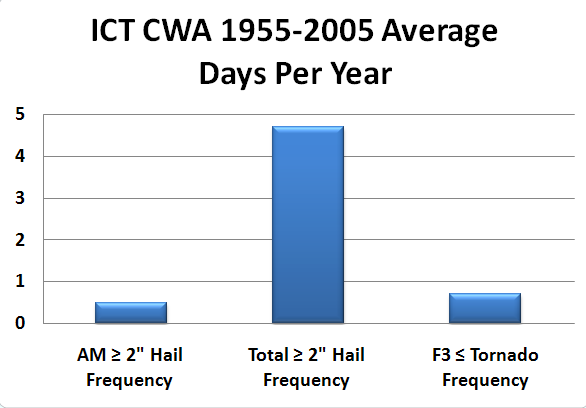
| According to NCDC, from 1955-2005 across the Wichita CWA, 2-inch or larger hail occurred on 236 days out of the 50 years of data (roughly 18,250 days). That averages to 4.7 days per year that 2-inch or larger hail occurred across the Wichita CWA. Out of that number, a relatively small percentage occurred during the AM hours (midnight-noon), which averages out to about one 2-inch or larger AM hail event every other year. Narrowing down the time frame even more, counting only 2-inch or larger hail events between the hours of 2am and 10am, reduces the average frequency from one event every other year to one event every 3-4 years. So needless to say, early morning very large hail events are fairly rare. In comparison, across the Wichita CWA, F3 or greater tornadoes occurred on 37 days out of the 50 years of 1955-2005 NCDC data, which averages out to one F3 or greater tornado across the Wichita CWA roughly every 1.5 years or so. |
 |
While both WFO ICT and SPC to some degree anticipated the potential for early morning/predawn thunderstorm development on the 31st across portions of south-central/southeast Kansas, forecasted severe thunderstorm coverage and hail sizes were underestimated by quite a bit. This is NOT meant to criticize, since forecasters on duty during the afternoon/evening hours on the 30th were likely preoccupied (and rightly so) with the real-time potential for severe convection ahead of the front over eastern Kansas/Oklahoma that afternoon/evening (on the 30th). And as we all have heard, "the main thing is the main thing"; in this case correctly assessing real-time severe thunderstorm potential is more important than a forecast. Additionally, WFO ICT was smack dab in the middle of a very active, several day severe thunderstorm pattern, which likely prevented forecasters from assessing any one potential event too closely due to workload issues.
Nevertheless, it is the hope that this review will aid forecasters' understanding and anticipation of these relatively rare late night/early morning very large hail events due to the obvious threat to life and especially property they present. Additionally, such events typically present considerable difficulties in anticipating staffing strategies during just about the worst time of the day staffing-wise (predawn-early morning hours). Better anticipating these early morning very large hail events will hopefully prevent forecasters from being "surprised" and regretfully understaffed
2. Synoptic Overview
00 UTC 05/31: Upper air maps from 00 UTC and 12 UTC on the 31st (corresponding maps are side-by-side for comparison) indicated a strong shortwave trough at 00 UTC progressing across the western Great Lakes, with an associated cold front trailing southwestward into the central/southern plains. Rich 925-850mb moisture resided east of the front, with a 925-850mb thermal ridge nosing northeastward into southern Kansas. Notice the easterly 850mb wind at DDC, indicative that the southern portions of the front had possibly stalled or was beginning to stall, and return back northward. This notion is supported by the relatively zonal flow across the central/southern plains per the 500-250mb maps, with the brunt of mid/upper forcing passing well northeast of the area. At 700mb, a fairly tight temperature gradient existed west-east from the Texas Panhandle east into western Oklahoma. From 500-250mb, the strongest westerly flow stretched from the Great Lakes southwestward toward the Great Basin, with southern Kansas on the southern fringe of these stronger westerlies. An additional area of stronger 300-250mb winds were approaching from the Desert Southwest.
12 UTC 05/31: By 12 UTC, the 925-850mb moisture/instability axis extended from the eastern Great Lakes west-southwestward into southern Kansas/northern Oklahoma, south of the now east-west oriented trailing baroclinic zone. An 850-700mb thermal ridge nosed northeast into southern Kansas, with strong theta-e advection across southern Kansas (although the 850-700mb thermal and moisture fields were likely contaminated from the ongoing convection). At 500-250mb, the area was underneath a coupled upper jet structure from jet energy to the northeast and southwest, along with good upper diffluence. Ascent underneath this coupled jet structure likely aided in strengthening the low-level jet over the southern/central plains, forcing the stalled front to return northward as a warm front between 00 UTC and 12 UTC on the 31st.. Dynamic lift in concert with ample instability and strengthening 925-700mb theta-e advection allowed thunderstorms to form across south-central/southeast Kansas.
|
Figure 1. Regional radar loop from 0842 UTC to 1442 UTC on May 31st, 2008. Note: click all images to enlarge; the enlarged image may need to be clicked a 2nd time to enlarge to 100%. Notice in particular the strong 850-500 mb directional shear per area profilers and VWPs. Storms were likely rooted just above 1000m AGL (yellow flags). Some locations recieved large hail more than once that morning, due to the evident cell training. Cowley and Chautauqua counties were hit especially hard. Also notice the many discrete and deviant cells (left/right splits), indicating supercell structures. The more deviant cells (both left and right movers) produced on average the largest hail, and rightly so. The deviant motion acted to increase low-level storm-relative (SR) inflow (especially for right movers) per a modest south/southwesterly low-level jet, which in turn increased updraft strength. The deviant motion also increased mid-level storm-relative flow, thereby enhancing the mid-level pressure gradient force and thus strengthening the mid-level mesocyclone and associated updraft. This aided in storm tilt, reducing the chances for significant precipitation-loading back into the updraft, and also separated the hailstone trajectories from the rain, aiding in large hail reaching the ground with minimal melting. Finally, the convection altered the near-storm environment as evident by the increase in 700-500 mb profilers with time to the west/southwest of the convection, resulting in greater effective bulk shear and mid-level SR flow. |
 |
|
Figure 2. MSAS surface analysis loop from 00-10 UTC on the 31st. The northern end of the front across the upper midwest progressed east, while the southern end over the central/southern plains remained more stationary, and eventually lifted back north. Rich moisture and warmer temperatures resided south of the boundary. Notice the pressure falls from 06 UTC onward across the southern/central high plains, likely due to increased ascent underneath the upper jet dynamics, which acted to increase the low-level jet and lift the warm front northward. The dewpoint at both Wichita and Medicine Lodge increased about 10 F from 00-10 UTC. |
 |
|
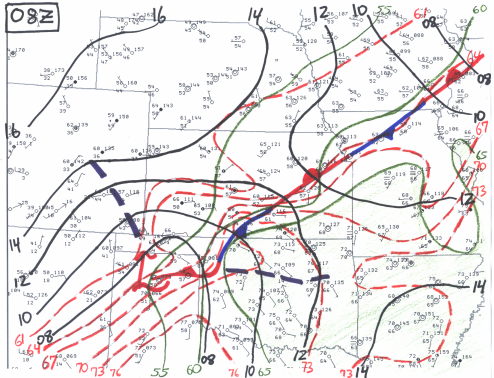
Figure 3. 08 UTC surface analysis, about one hour before thunderstorm initiation. Notice the tight thermal and moisture gradient across the quasi-stationary front. Thunderstorm initiation occurred across western Reno county between Pratt and Hutchinson. The temperature/dewpoint was 74/68 F at WLD, with 60/57 F at HUT. Frontogenetical lift in this tight low-level baroclinic zone likely aided in thunderstorm initiation. |
 |
|
Figure 4. 4-panel loop, of water vapor imagery and PV 0.5, 1.0 and 1.5 pressure surfaces. Notice prior to initiation there is good correlation between the approaching PV 0.5 and to some extent the 1.0 anomalies and the approaching very dry mid-level air per water vapor imagery. PV surfaces at and above 1.5 appeared too high to pick up on this subtle PV anomaly. Maybe lower PV surfaces are better to diagnose during the warm season, when mid/upper features can often times be more subtle? |
 |
|
Figure 5. 4-panel upper level synoptic overview loop. Lower left isn't labeled: it is RUC40 500mb windspeed, streamlines and profilers. Later frames of the 0.5 PV surface are contaminated by convection. Before convection commences, notice the good correlation between the orientations of the approaching PV 0.5 anomaly and future thunderstorm cluster. The area was underneath the right entrance region of upper midwest upper jet energy, and also the left exit region of approaching jet energy from the west-southwest; this coupled jet structure likely aided in the large-scale ascent and also acted to increase the low-level jet. Notice again the dry pocket per water vapor imagery approaching from the west-southwest across northwest TX and western OK, which seems to correlate fairly well with the 0.5 PV pressure surfaces. |
 |
|
Figure 6. Real-time RUC80 pressure and wind loop for PV 0.5 (upper panels) and 1.0 (lower panels) surfaces. The subtle PV anomaly and associated jet steak can be traced from 18 UTC on the 30th over the desert southwest, about 15 hours before convection initiated, especially on the PV 0.5 pressure level. The 12 UTC NAM and GFS models on the 30th (24 hour forecasts--shown later) are quite similar to this loop. |
 |
3. Instability and Wind Shear
|
Figure 7. 4-panel loop of lift, moisture, wind shear and instability. The panels are labeled accordingly at the bottom of each frame. Notice the strengthening low-level jet per 1000 m AGL profilers as the night progressed, acting to greatly increase the isentropic ascent, moisture transport and convergence. RUC MUCAPE values were 2200-2700 j/kg (per steep mid-level lapse rates (shown on DDC sounding below) and rich low-level moisture. The AWIPS RUC depiction of MUCAPE was fairly similar to the corresponding MUCAPE on the SPC mesoanalysis page. Additionally, 2-7 to 2-8 km shear values (roughly the effective bulk shear for this event) ranged from 40-50 kts, more than adequate for strong updraft rotation given the amount of instability. Shear values also jived with those on the SPC mesoanalysis page. Notice after 06 UTC the northward surge of moisture/instability into southern KS. Lifted parcel heights were around 800mb (per DDC sounding below). |
 |
|
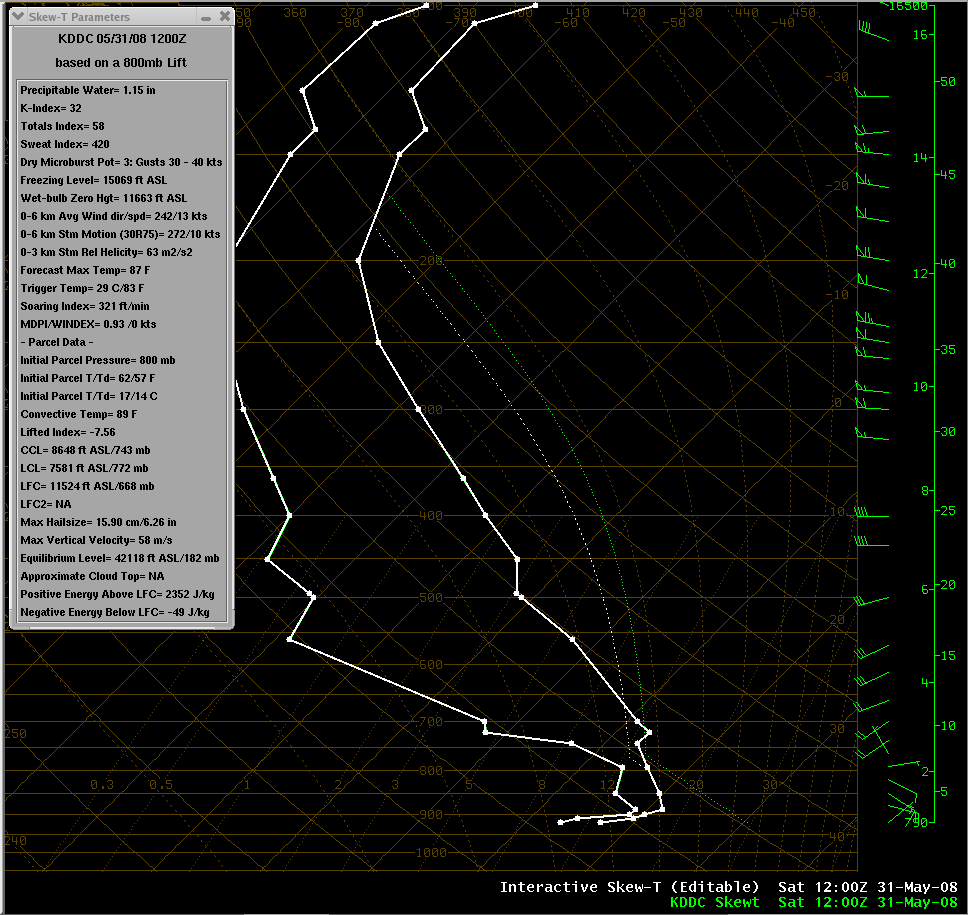
Figure 8. DDC 05/31 12 UTC sounding. Compared to surrounding morning soundings (SGF, TOP, OUN), DDC seemed the most representative of the thermodynamic environment over south-central/southeast Kansas. The parcel was lifted from 800mb, yielding a CAPE around 2300 j/kg. The freezing and -20C levels were around 14K and 22K ft AGL, respectively. Large amounts of CAPE existed in the 0 to -30 C column. The significant hail parameter for the DDC sounding was calculated at 1.2-1.5 (utilizing effective shear instead of 0-6 km shear). Effective bulk shear values weren't as strong on the DDC sounding as compared to area profilers closer to the storms. |
 |
|
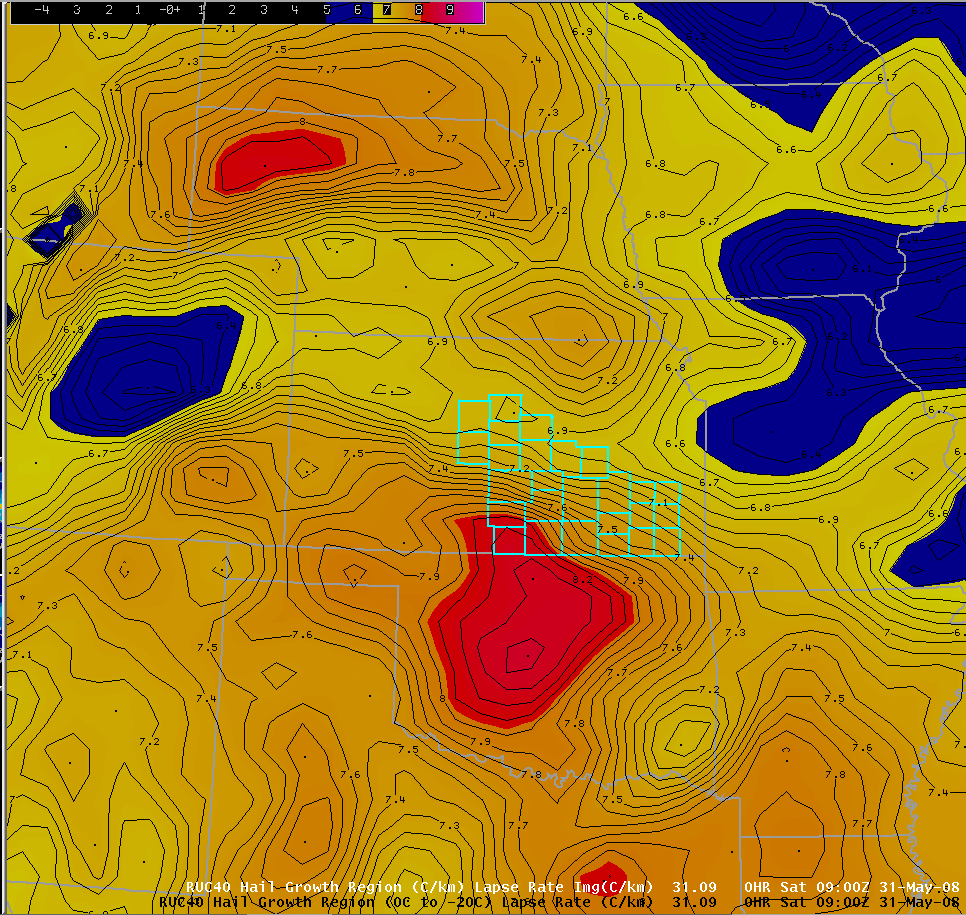
Figure 9. RUC40 hail growth (0 to -20C AWIPS best approximation) lapse rates for 09 UTC. Conditionally unstable conditions in the favored hail growth region were common across south-central Kansas and northern/western Oklahoma, with values around 8 C/km just south of where the storms developed/progressed east-southeast. |
 |
|
Figure 10. RUC40 significant hail parameter (SHIP) 06-12 UTC loop. Values greater than one generally indicate a favorable environment for 2-inch or greater hail (considered significant hail, SPC Meso-Analysis Page). However, the SHIP uses 0-6 km bulk shear values, which poses a problem for elevated situations like this. Given strongly veered wind profiles below the effective inflow base, the 0-6 to 0-8 km shear was a bit stronger (50-60 kts) than the effective shear (40-50 kts), per the SPC mesoanalysis page, which probably inflated SHIP values to some degree, although probably didn't grossly overestimate. The development of a SHIP that utilizes effective bulk shear rather than 0-6 km bulk shear would be much more useful in elevated situations. |
 |
|
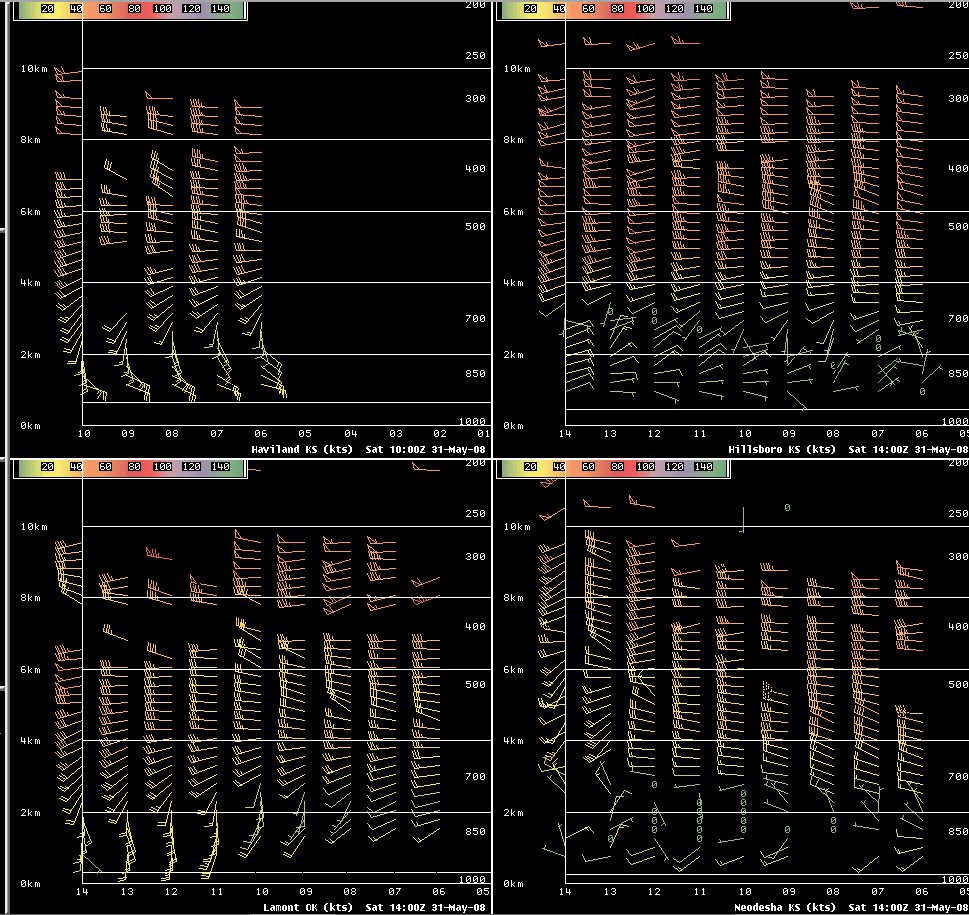
Figure 11. Haviland, Lamont, Hillsboro and Neodesha profilers between 06-14 UTC. The storms were likely rooted around 2 km MSL. Notice the strong directional effective shear, especially at Haviland and Lamont (these sites were closest to the convection). Speed shear wasn't quite as impressive, but nevertheless is present at all four locations. |
 |
4. Radar Analysis
|
Figure 12. VNX four-panel loop of digital VIL, composite reflectivity, layer 2 and layer 3 max reflectivity (clockwise from upper left) from 0832-1334 UTC. Notice the numerous VIL "blobs", and the corresponding greater than 57 dB layer 3 max reflectivities from Reno county east-southeast through southern portions of Sedgwick county, and into Cowley and Chautauqua counties. Portions of Reno, Sedgwick, extreme southern Harvey, Kingman northern Sumner, southern Butler, Elk and Montgomery counties experienced hailstone sizes ranging from 1 to 2.25 inches in diameter (quarters-tennis balls), while portions of Cowley and Chautauqua counties were pummeled with hailstone sizes ranging from 2.75 to 4.25 inches (baseballs-softballs). |
 |
|
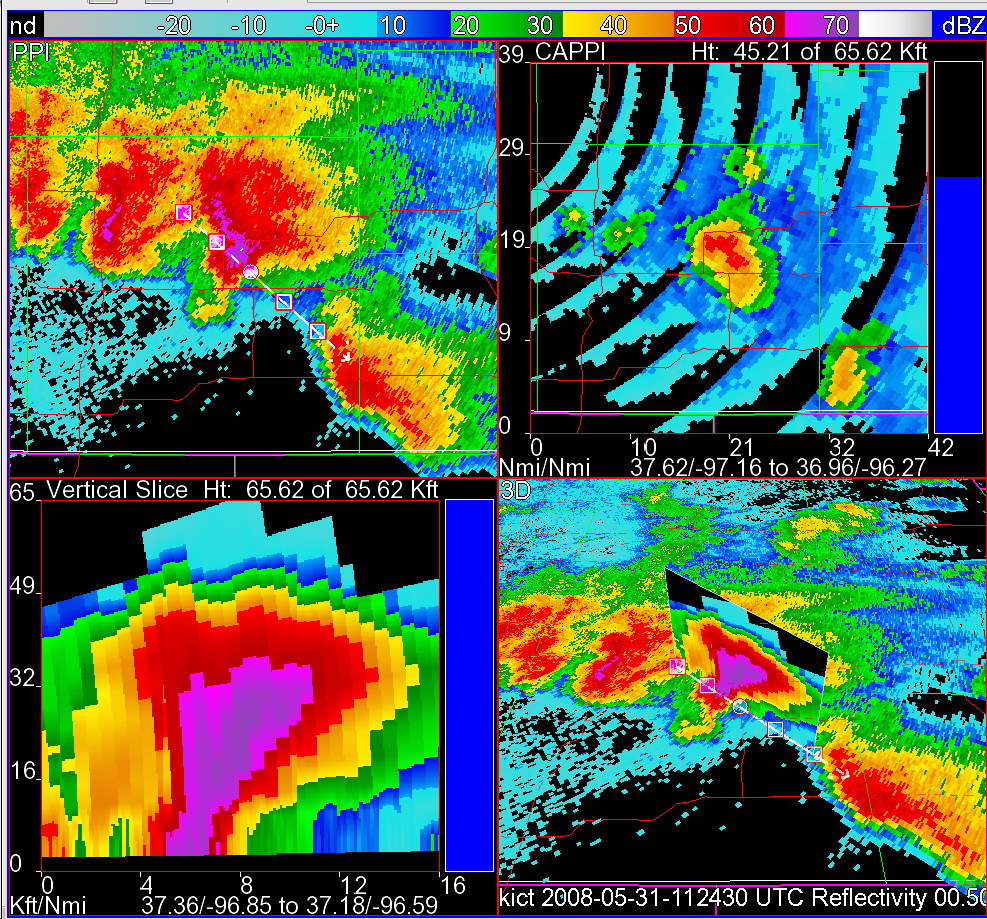
Figure 13. VNX 4-panel loop of 3.4 (upper) and 5.3 degree (lower) Z/SRM from 1103-1131 UTC, highlighting the storm that produced baseball-softball size hail in and around the communities of Burden, Dexter and New Salem in Cowley county. The beam height of the 3.4 degree slice (upper panels) on the storm of interest is at 30K ft, while the 5.3 degree slice (lower panels) is at 46K ft. This corresponded to persistent greater than 65 dB reflectivities at and above 30K ft (-20C level was around 22K ft), and greater than 50 dB reflectivities at and above 46K ft! Add in the persistent and deep mid-level rotation (upper right), tilt (see below), and strong storm near-top divergence (lower left), very large hail was inevitable. Furthermore, an additional storm near Cedar Vale produced up to baseball size hail. |
 |
|
Figure 14. ICT FSI 4-panel at 1124 UTC highlighting the storm of interest in Cowley county about the time baseball-softball size hail was occurring. Notice the impressive tilt indicated by the cross section in the lower left panel. Also notice the classic supercell shape and characteristics, including a hook echo, strong low-level reflectivity gradient, discrete storm mode, and hints of a V-notch. |
 |
|
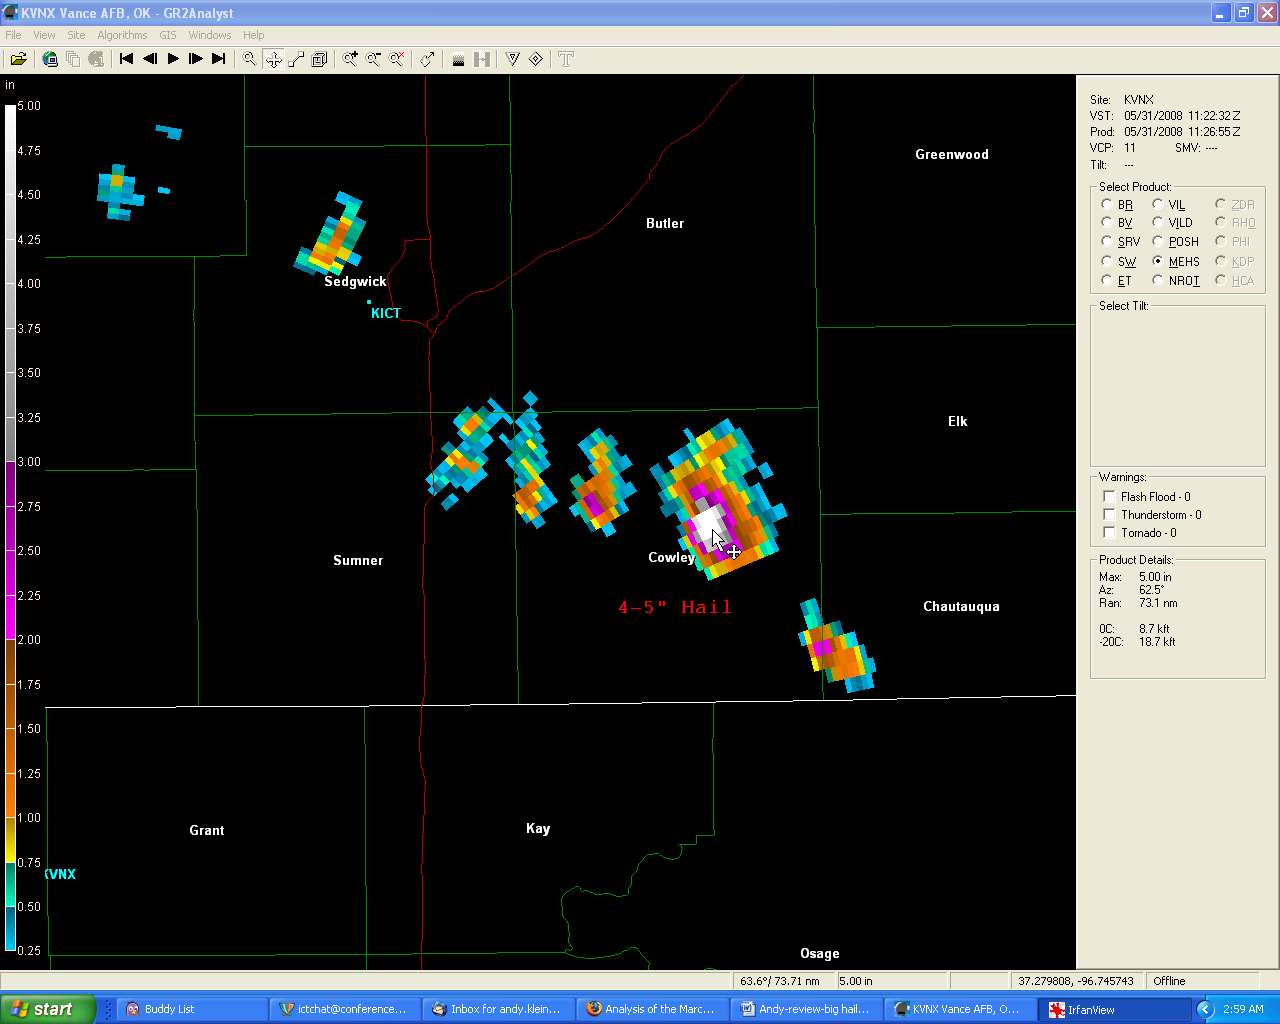
Figure 15. VNX MEHS (maximum estimated hail size) product via GR2Analyst for roughly the same time as in Figures 12 and 13. Estimated maximum hail sizes were 4-5 inches for the storm over northeast Cowley county, quite representative of the 4.25 inch hail that actually occurred. |
 |
5. Model Performance
|
Figure 16. 4-panel 5/30 12 UTC GFS and NAM 24 hour forecast of instability, shear and PV. Both models forecasted a dramatic increase in theta-e from the south as the night progressed, although both models probably progressed the theta-e gradient a bit too far north. NAM looked closest with the amount of instability, while the GFS was likely too low. Both models accurately forecasted 40-50 kt 2-7 km AGL shear. Furthermore, both models forecasted the subtle 0.5 surface PV anomaly progressing from the central/southern Rockies into the central/southern plains, which likely aided in convective initiation. |
 |
|
Figure 17. 4-panel 5/30 12 UTC GFS and NAM 24 hour forecast of 310K isentropic lift and moisture transport. Though not a perfect correlation, both models strongly hinted at strong isentropic ascent, convergence and strong moisture transport/advection increasing across southern Kansas and northern Oklahoma after 06-09 UTC. |
 |
|
Figure 18. 4-panel 5/30 12 UTC GFS and NAM 24 hour forecast of the SHIP, mid-level SR winds (yellow barbs), Bunker's elevated right-moving supercell motion (blue barbs), and PV 0.5 wind speed. Though not a direct correlation, both models forecasted a favorable environment for significant hail, especially the NAM where it forecasted SHIP values of roughly 1-2 (but remember the model SHIP values were likely overestimated some given that the slightly stronger 0-6 km shear values were used in the SHIP calculation instead of the more representative but slightly lower effective shear values). Additionally, both models indicated a weak coupled jet structure on the PV 0.5 surface over the area. Furthermore, the forecasted modest 15-25 kt mid-level SR flow (yellow barbs) proved sufficient to aid in storm tilt/organization for large hail (see "large hail" section of SOO page meso-analyst reference). Analysis of RUC and LAPS data indicated that the GFS' greater mid-level SR winds around 20-25 kts were more representative, further confirming the potential for large hail. However, in reality SR winds were probably locally much stronger (upwards of 40 kts?) due to deviant cell motions, and convection-induced strengthening of the near-storm 700-500 mb flow. |
 |
|
Figure 19. 4-panel 5/30 12 UTC GFS, NAM and EASTNMM4 24 hour QPF, and the 5/30 06 UTC WESTNMM4 30 hour QPF. Unfortunately, the locally run WRFARW16 and WRFARW32 models were not available. Though not a perfect correlation, these models firmly indicated 24-30 hours out that thunderstorms were a strong possibility across southern Kansas early on the 31st. |
 |
6. Discussion & Summary
Very large hail events during the early morning hours have occurred only a handful of times across the Wichita CWA over the past 10 years, but its threat to life and especially property can be significant. One such event occurred during the early morning hours on April 24, 2006, pummeling portions of primarily West Wichita with up to baseball size hail, inflicting an estimated $70 million in property damage (Caruso, 2006). The hail storm on May 31, 2008 affected some of the same areas as the April 24, 2006 storm, with hail reaching golfball to softball size from Reno county southeastward into Chautauqua county. Locations in and around the communities of Dexter, Burden, New Salem, Cedar Vale and Chautauqua were hardest hit, with total damages from these events at nearly $20 million dollars.
So what caused the thunderstorms to form, and why was the resultant hail so large? Strong 925-700mb isentropic ascent and moisture transport per a strengthening low-level jet increased across northern Oklahoma/southern Kansas as the night progressed, in response to lift underneath a weak coupled jet structure and approaching subtle PV anomaly. Both this frontal and mid/upper lift were detected by pressure falls on an MSAS 3-hour pressure tendency plot. The rich low-level moisture in concert with steep hail growth lapse rates resulted in elevated CAPE values around 2500 j/kg. Strong effective bulk shear on the order of 45-50 kts aided in deep and persistent updraft rotation. Additionally, modest to at times strong mid-level SR flow per deviant cell motions, and increased (convection induced) near-storm 700-500 mb winds in wake of the convection likely locally increased the effective bulk shear, and also the pressure gradient force in the mid-levels of the storms, strengthening the mesocyclone. Furthermore, the deviant cell motions (especially the right movers) took advantage of increased low-level storm inflow and associated updraft strength per a modest south/southwesterly low-level jet. Finally, the stronger mesocyclones created favorable hail trajectories/storm tilt, allowing hail and liquid to fall separate, and thus minimizing significant melting.
Did the models predict this event 24 hours out? Though not a perfect correlation, both the GFS and NAM strongly suggested the potential for convection across central/south-central/southeast Kansas during the late night to early morning hours per forecasted strong isentropic ascent and moisture transport, a weak coupled upper jet structure, increasing elevated instability, and model derived QPF. In addition to the NAM and GFS, the WESTNMM4 and EASTNMM4 models (in AWIPS) suggested a strong chance for deep moist convection per forecasted QPF. Both the NAM and GFS correctly forecasted 45-50 kts of effective bulk shear and modest 15-25 kt mid-level storm-relative winds, although the stronger GFS was likely closer to reality. With regard to instability, the NAM was likely closest to reality predicting MUCAPE values around 2500 j/kg; the GFS likely underdid the instability predicting MUCAPE values around 1500 j/kg. Furthermore, per the SHIP parameter, both models (but especially the NAM) suggested the potential for significant hail across south-central and southeast Kansas, with values at or greater than 1 (the NAM forecasted SHIP values as high as 2).
What did I learn from this review? 1) Given a source of lift for thunderstorm initiation and maintenance, NEVER underestimate ample instability/shear combinations for large hail no matter what time the clock reads, as Figure 11, Figure 12 and Figure 13 attest to. 2) MSAS, LAPS or RUC 3-hr pressure change plots can be helpful in assessing developing/ongoing regions of ascent. 3) Subtle mid/upper disturbances are sometimes more difficult to ascertain on the PV 1.5 or 2.0 surfaces; lower surfaces such as 0.5 or 1.0 at times are more useful in detecting subtle mid/upper level disturbances. This may especially be true during the warm season when the tropopause is typically higher. 4) Beware of utilizing the SHIP for elevated convection, since 0-6 km bulk shear is used in the equation instead of the more appropriate effective bulk shear. 5) Utilizing mid-level (roughly 3-6 km AGL) SR flow progs (in tandem with effective bulk shear) can be useful in determining potential magnitudes of mesocyclones and associated tilt for favorable hail trajectories. Values greater than 20-25 kts are most favorable per Mesoscale Analyst Reference - ICT SOO Intranet. 6) A large area of convection can greatly enhance not only the surface near-storm environment, but also the mid-levels, increasing mid-level flow and enhancing the effective bulk shear and mid-level SR flow. 7) If extra manpower is available, don't hesitate to tag-team the forecast package, especially if several bouts of hazardous weather are expected within the first 48-72 hours.
Could the coverage and magnitude of this event been better anticipated? For what it's worth, the NAM and GFS 24 hour forecasts (but especially the NAM) suggested the potential for elevated supercells with significant hail during the late night/early morning hours on the 31st. But the decision to forecast a relatively rare event such as this proves quite challenging for even the most seasoned veteran forecaster. No one desires to lose credibility by often "crying wolf", and in turn creating a disservice for our users. But in contrast, not forecasting significant events when appropriate would also create a disservice. Additionally, as stated earlier, forecasters on duty during the afternoon/evening hours of the 30th were likely preoccupied (and rightly so) with the real-time potential for severe convection, possibly preventing a more thorough analysis of the potential for overnight convection. Furthermore, the Heartland (including WFO ICT) was smack dab in the middle of a very active, several day severe thunderstorm pattern, which also likely helped this event to "fall through the cracks" due to workload issues. Finally, since an event like this is so rare, maybe we're lulled into a mentality that significant hail can only occur during the afternoon/evening hours, and doesn't occur during the late night/early morning hours? This is somewhat analogous to the mentality that wind advisory criteria doesn't occur during the nighttime hours.
7. References
Caruso, J. 2006: Analysis of the April 24, 2006 Destructive Hailstorm in Wichita, Kansas
SPC Mesoscale Analysis Archive
Capabilities of Thermodynamic and Kinematic Severe Weather Parameters - WDTB website
Mesoscale Analyst Reference - ICT SOO Intranet Site
Radar Assistance Reference, Hail Forecasting - ICT SOO Intranet site
SPC Severe Thunderstorm Events Database

