1. Introduction
During the early morning hours on Monday, April 24th, 2006, two elevated supercell thunderstorms developed just to the west and northwest of Wichita, Kansas, with one of the storms forming over southeastern Reno County, while the second storm developed over western Sedgwick County. The latter, southern-most supercell became the one of clear interest as it moved eastward across the Wichita Metropolitan area between 1210 and 1230 UTC (710 and 730 AM CDT), producing destructive hail with the west side of the city bearing the brunt of the storm’s wrath. This storm produced very large hail on the west side of Wichita with hailstones ranging in size from 2.00 to 3.00 inches in diameter (Fig. 1). Property damage from this hailstorm was estimated at 70 million dollars. This local case review will compare the KICT and KVNX (Vance AFB) WSR-88D radar perspectives of this supercell. Storm environment information will also be presented.
2. Brief Summary of Severe Weather from April 23rd - 24th, 2006
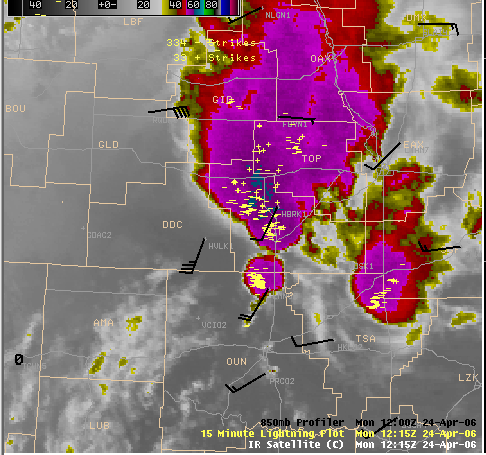
The period from the evening of April 23rd through the early evening of April 24th was very active in terms of the number of severe weather reports (Fig. 2a) and (Fig. 2b) across the NWS Wichita County Warning Area. Several mesoscale convective systems (MCSs) moved across central and southeastern Kansas during that period with the storms on the evening of the 23rd producing both severe wind and hail reports, while the storm reports on April 24th were predominately large hail including at least a half a dozen reports of hail of 2 inches in diameter or greater. Between 0900 and 1230 UTC on the 24th, an MCS tracked from central and south central Kansas rapidly through southeastern Kansas and northeastern Oklahoma with most of this thunderstorm activity remaining below severe levels. However, during this same time frame, a new cluster of thunderstorms also developed from west central Kansas across south central Kansas and north central Oklahoma with the storms over south central Kansas and north central Oklahoma becoming rapidly severe (fig3a, fig3b, fig3c). Figure 3c highlights the supercell which was producing very large hail in west Wichita at 1215 UTC.
3. Storm Environment Information
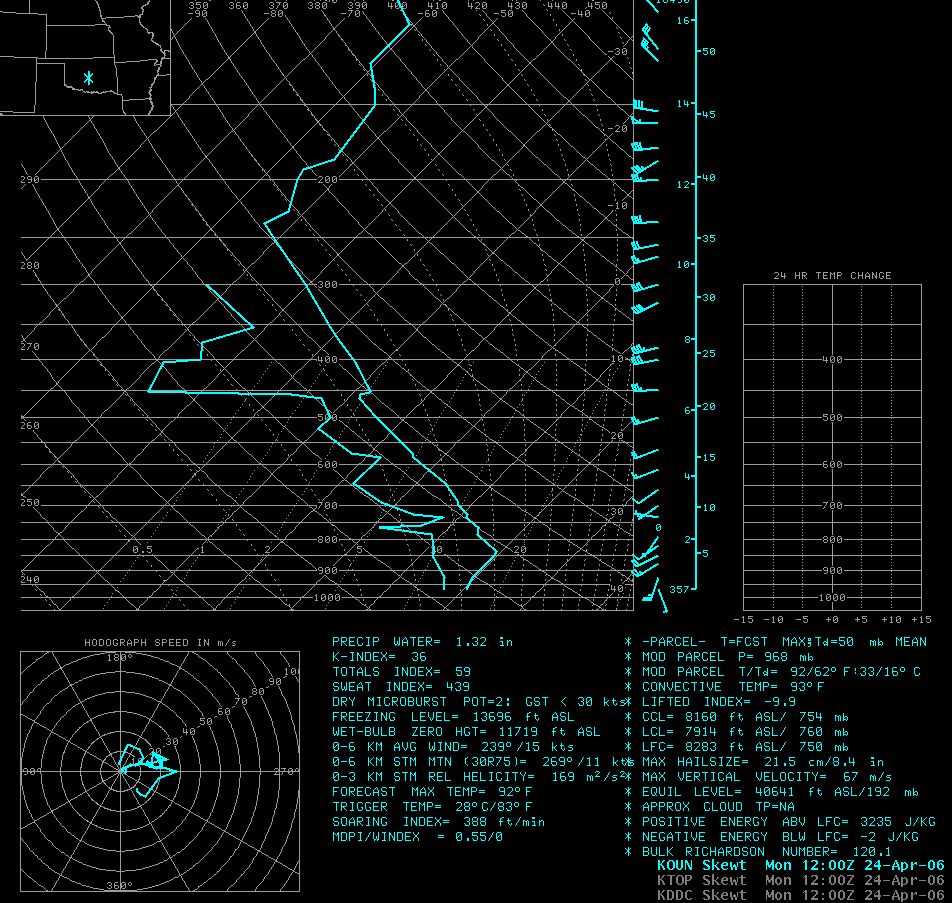
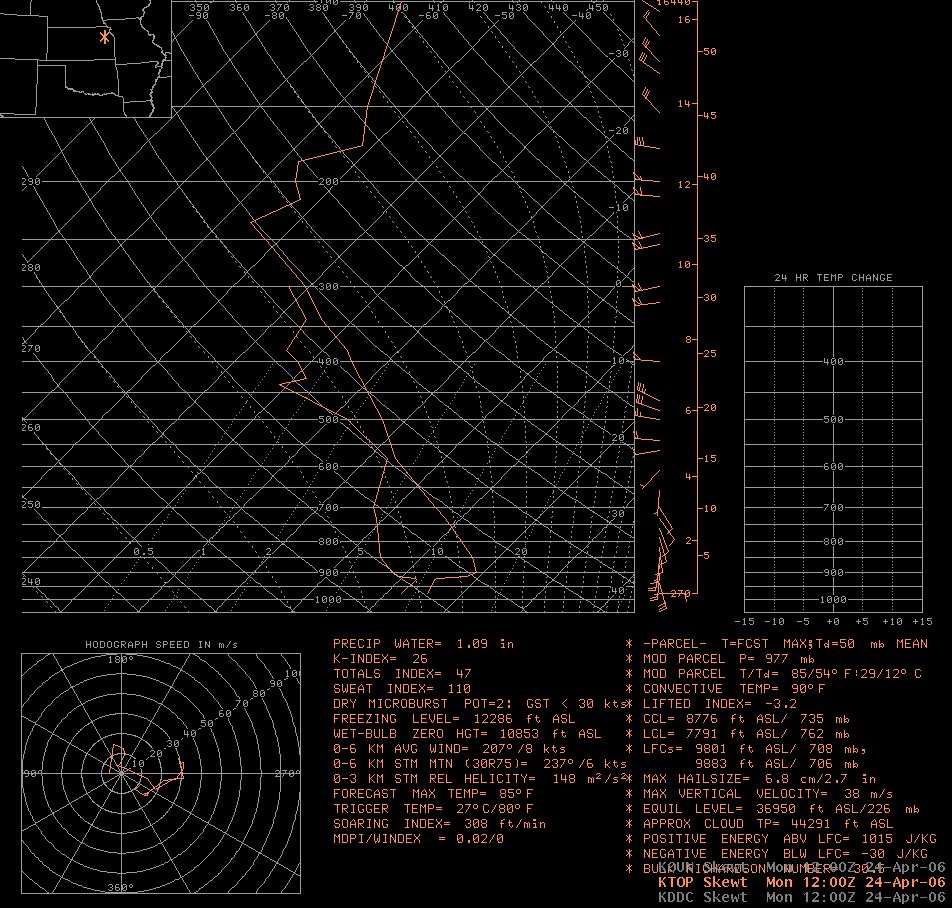
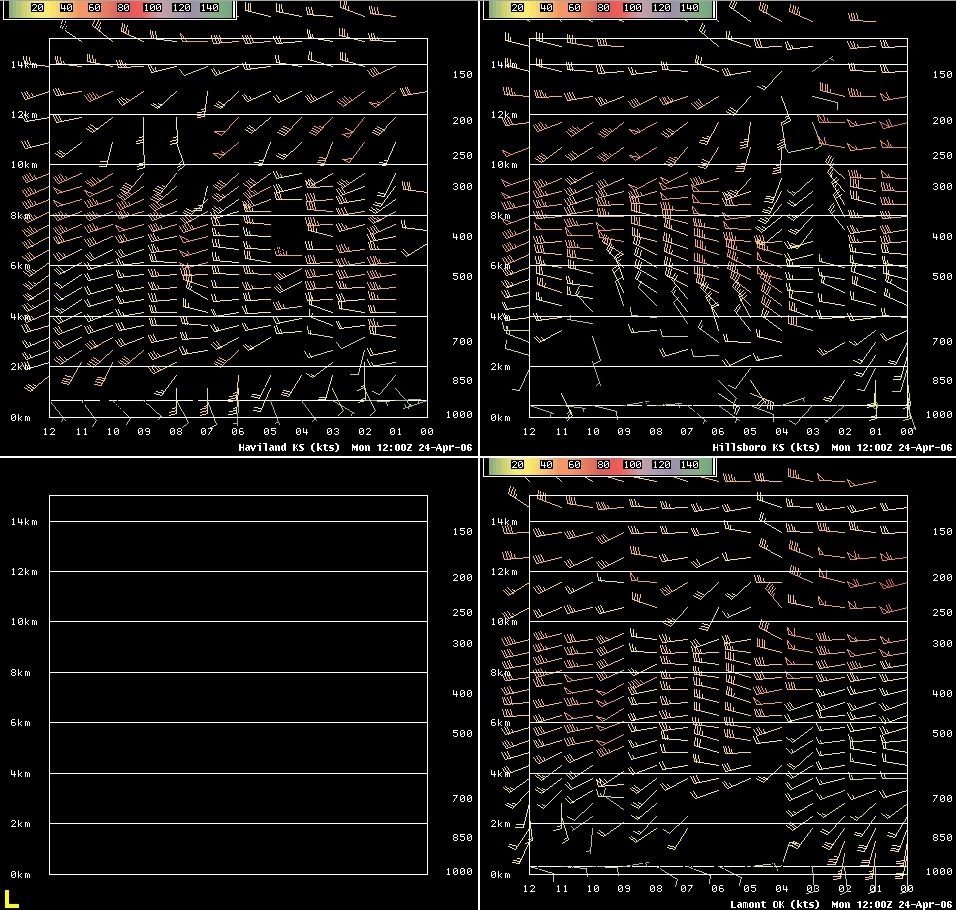
Very steep mid-level lapse rates were present during the early morning hours on April 24th (Fig. 4). Interpolation between the DDC, TOP, and OUN 12z upper air soundings (fig 5a, fig 5b, fig 5c) from the 24th indicated a freezing level height of approximately 12,700 ft AGL, with the minus 20 celsius height of approximately 21,700 ft AGL. The soundings from especially DDC and OUN confirmed the very steep mid-level lapse rates which is favorable for hail production along with an inversion between 750 and 850 mb.
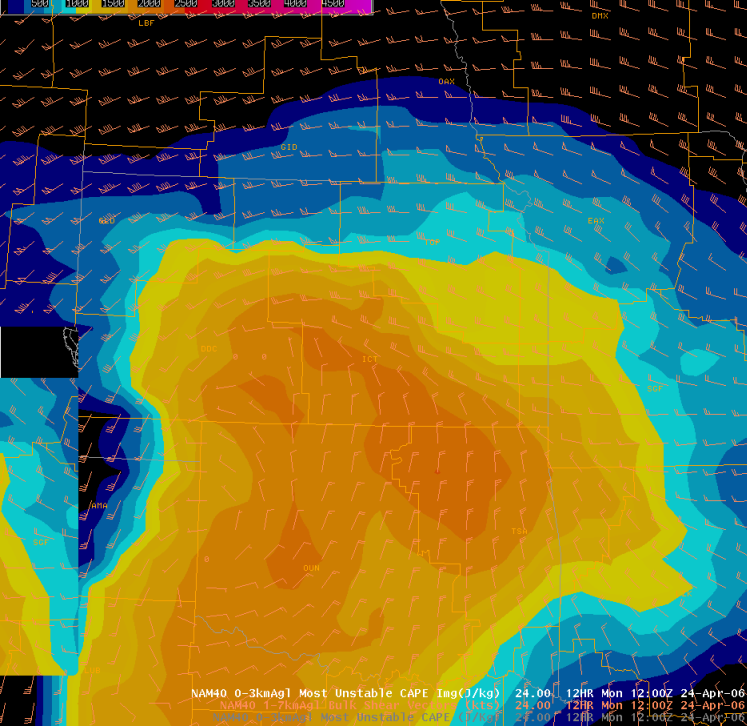
Figures 7a, 7b, 7c, 7d 7e, 7f, 7g, 7h contains several different images of hail-related parameters from the Storm Prediction Center Hourly Mesoanalysis Archive Page from the morning of April 24th. Of worthy note, the SPC Mesoanalysis page uses a Barnes surface objective analysis along with the RUC forecast as a first guess. The surface data is then merged with the latest RUC forecast upper air data to represent a 3-dimensional current objective analysis. Each grid point is then post-processed with a sounding analysis routine called NSHARP to calculate the individual technical fields pertinent to mesoscale analysis. Most-Unstable CAPE (MUCAPE) ranged from 2,500 to 4,000 J kg-1 in a bullseye across south central Kansas from 09 UTC through 12 UTC indicating a very unstable atmosphere. Effective Bulk Shear, often used for elevated storm environments, increased from 30 to 35 kt during that same three hour time period. According to SPC, supercells become more probable as the effective bulk shear vector increases in magnitude through the range of 25-40 kt and greater. CAPE values between the minus 10 celsius and minus 30 celsius layer ranged from approximately 400 to 700 J kg-1. The Significant Hail Parameter showed values ranging from 1 to 2 across the Wichita area. This parameter is not a forecast of hail size, but rather an indication of when significant (2 inch diameter or larger) hail is possible. According to SPC, in practice, maximum contour values of 1.5-2.0 or higher will typically be present when significant hail is going to be reported.
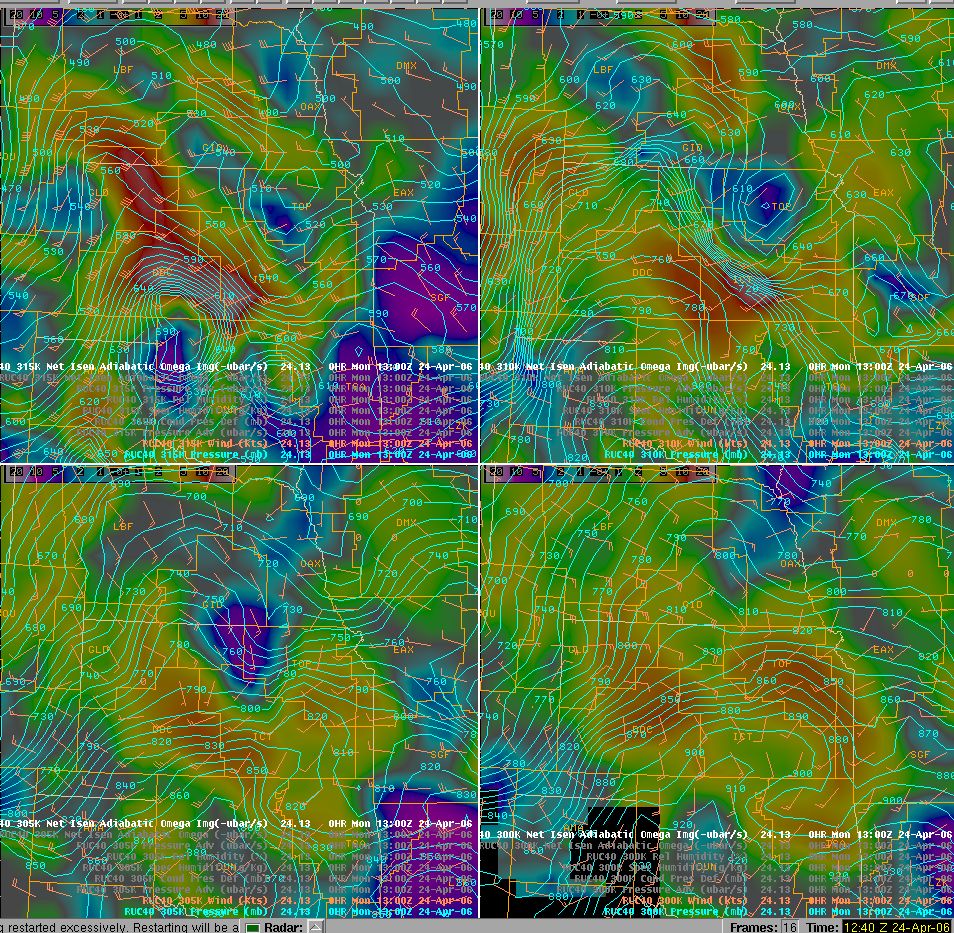
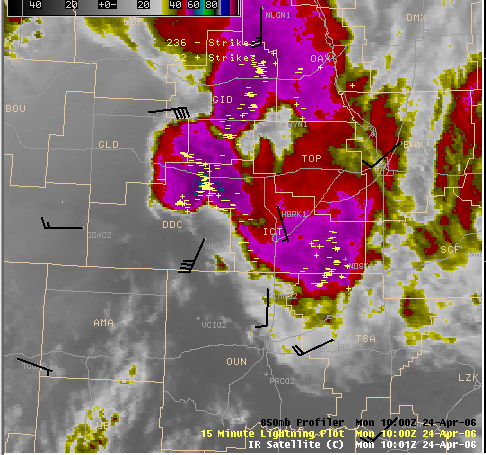
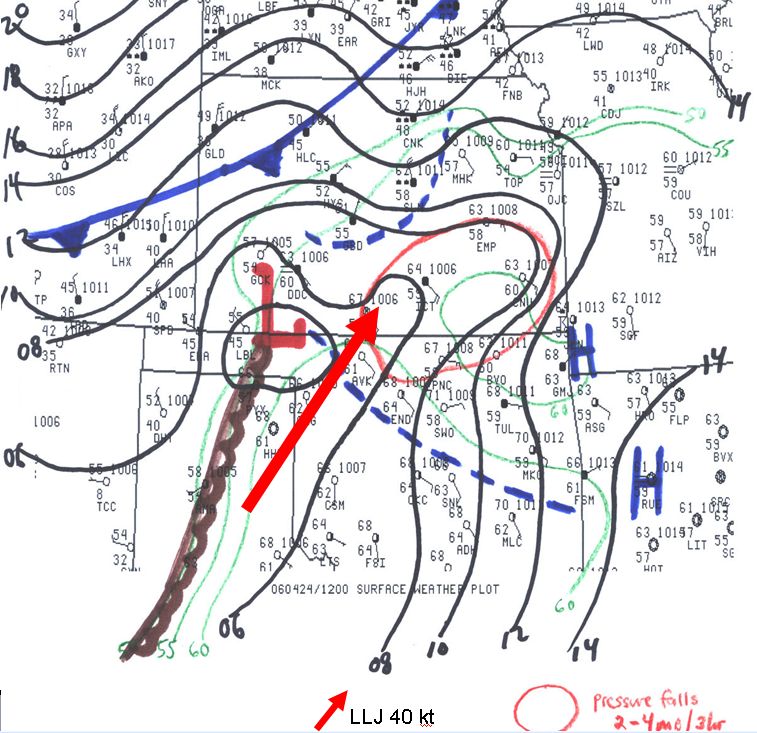
The above hail-related parameters were in place since at least 06 UTC on the 24th; however, although a few severe thunderstorm warnings were issued between 06 UTC and 11 UTC in central and south central Kansas, those storms appeared to be non-supercellular. So the question arises: What changed so dramatically toward 12 UTC to ignite the elevated supercells in south central Kansas and north central Oklahoma? Figures 8a_1 and 8a_2 may offer one possible explanation. The RUC40 showed strong isentropic lift occurring over western Kansas at 09 UTC had shifted eastward into south central Kansas by 13 UTC as the low-level jet veered and nosed into south central Kansas. The resultant strong lift could now interact with a very unstable atmosphere and sufficient effective bulk shear to produce organized severe weather. Figures 8b_1, 8b_2 and 8b_3 shows infrared satellite imagery from 10 to 12 UTC with 850 mb wind profiler and fifteen minute lightning strike data overlaid. The 850 mb profiler data showed strong wind convergence across central and south central Kansas from 10 to 12 UTC which confirms the strong lift in the RUC40 isentropic data in figures 8a_1 and 8a_2. Figure 8c is a hand analyzed surface map valid at 12 UTC. Low pressure was located over the eastern Oklahoma Panhandle with a thunderstorm outflow boundary extending from near the low across northwest and central Oklahoma. Meso high centers can be seen over southwest Missouri and western Arkansas. From this analysis, it can be inferred that the low-level jet was contributing to strong lift and resultant surface pressure falls over south central Kansas as warm, moist, unstable air was lifted to the northeast of the convective outflow boundary in Oklahoma.
Figure 9 shows regional VAD Wind Profiler data for the early morning hours. The Lamont profiler indicated winds around the 2 km AGL level (800-850 mb) backed to a southerly component while increasing in speed from 10 UTC through 12 UTC. This likely resulted in increased deep layer shear and perhaps allowed for increased storm organization and intensity. Figure 10 shows a 12 UTC upper air observed sounding at Lamont, Oklahoma from the SPC Observed Soundings Analysis page. This observed sounding confirms several of the hail-related parameters in Figures 7a, 7b, 7c, 7d 7e, 7f, 7g, 7h from the SPC Hourly Mesoanalysis page such as impressive MUCAPE of 3200 J kg-1, cloud bearing layer shear of 42 kt, and steep mid-level (700-500 mb) lapse rates of 8.2 oC km-1, and also the backed winds at 850 mb discussed earlier regarding Fig. 9. This sounding also indicated a Significant Hail Parameter value of 2.9. The instability and shear combination present on the 12 UTC Lamont sounding would support supercellular storms and hail of significant size. It is very unfortunate however, that the 12 UTC Lamont observed sounding would not have been available off of the SPC Observed Soundings Analysis page until 14 or 15 UTC. The Lamont sounding is often available at 0600, 1100 and 1800 UTC. The above environment assessment should be considered preliminary. Further research is needed to determine why the storms suddenly turned supercellular toward 12 UTC on 24 April 2006 in south central Kansas.
4. Model Performance
The NAM40 (both 00 and 06 UTC/24th runs) along with the RUC40 (00 through 11 UTC/24th runs) performed reasonably well with forecast MUCAPE at 12 UTC of 1800 to 2500 J kg-1. Actual analyzed MUCAPE values likely ranged from 2500 to 3200 J kg-1 based on the SPC mesoanalysis page and the 12 UTC observed Lamont upper air sounding (fig. 10). However, both the NAM40 and RUC40 seem to significantly underestimate the cloud bearing bulk shear present at 12 UTC, with analyzed effective bulk shear ranging from 30 to 42 kt per the SPC mesoanalysis page and the 12 UTC observed Lamont upper air sounding. For example, the 12 hour forecast valid at 12 UTC from the 00 UTC/24th NAM40 (figure 8d) projected only 10-15 kt of 1-7 km AGL bulk shear, while the 06 UTC run showed 15-25 kt for the same valid time (not shown). The RUC40 did not project 1-7 km AGL bulk shear of 30 kt or greater valid at 12 UTC until the 11 UTC run (not shown). Given their significant underestimation of the effective bulk shear, both the NAM40 and RUC40 models would have presented serious difficulties for short term forecasters trying to anticipate supercell development toward 12 UTC.
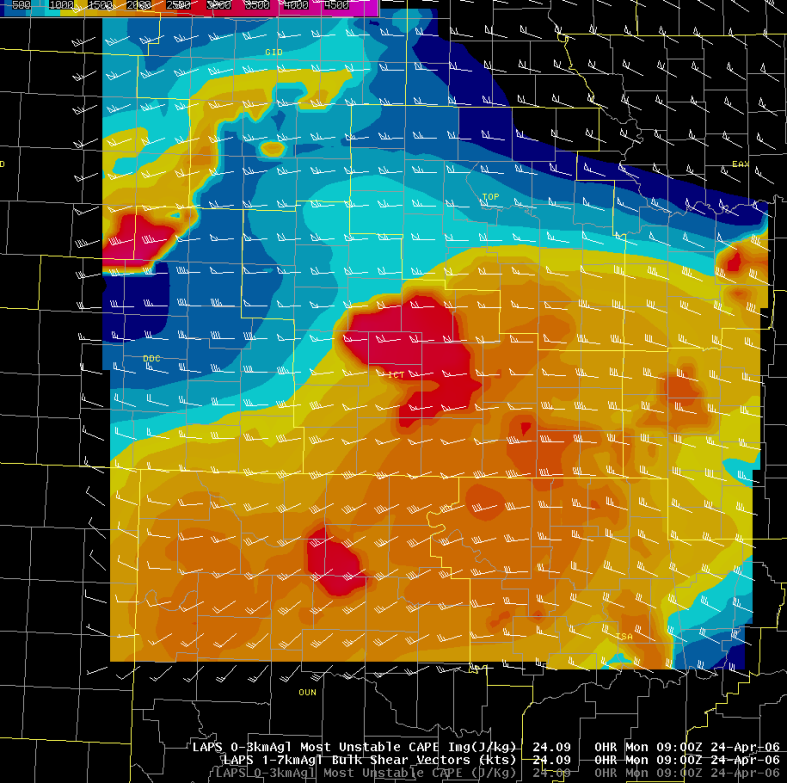
The AWIPS LAPS diagnostics slightly underestimated the MUCAPE from 09 through 12 UTC, showing values ranging from 1700 to 2000 J kg-1. However, LAPS did show strong 1-7 km AGL bulk shear ranging from 35 to 50 kt during the same time frame (figures 8e_1 and 8e_2), which was in reasonable agreement with the effective bulk shear values depicted on the hourly SPC Mesoanalysis page.
5. KICT and KVNX WSR-88D Perspectives
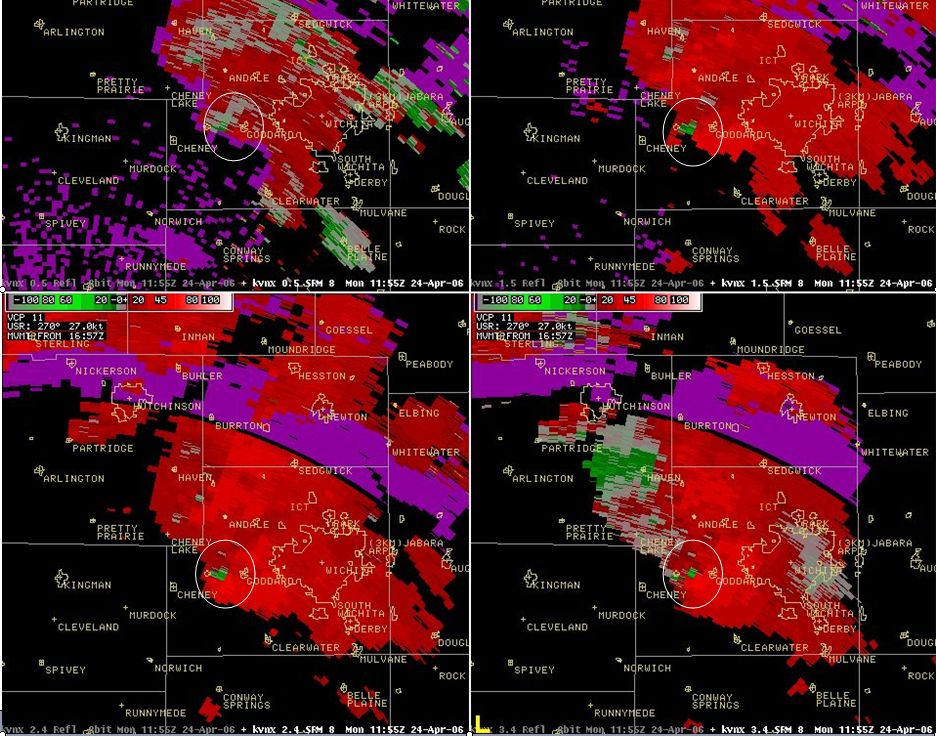
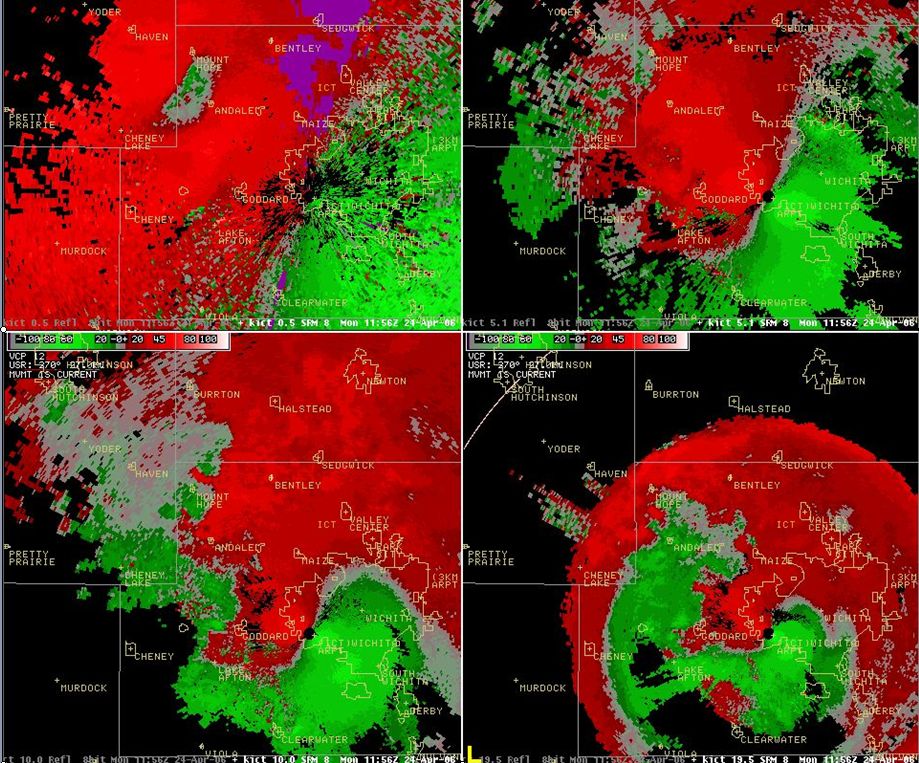
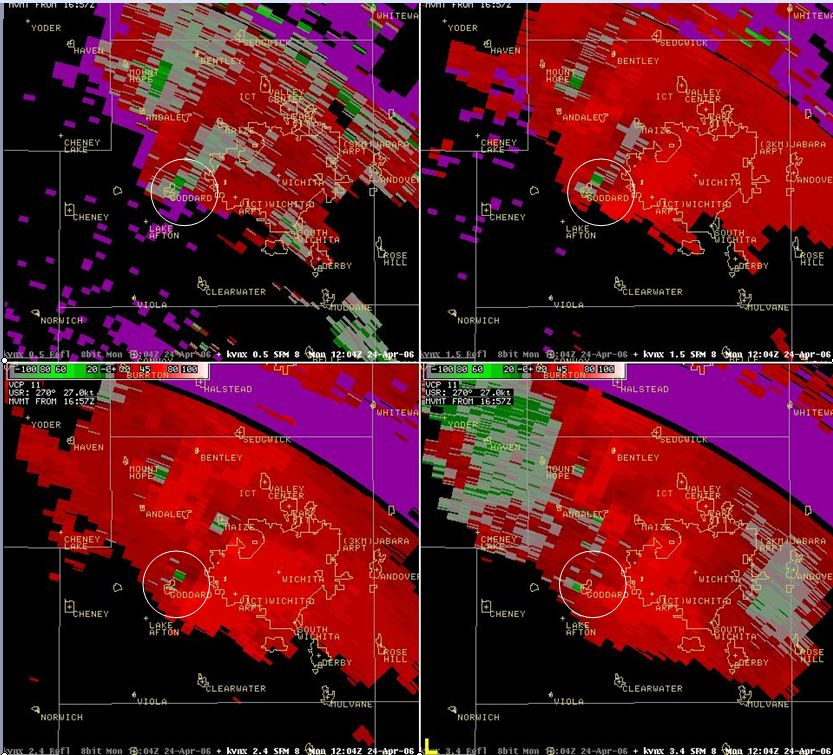
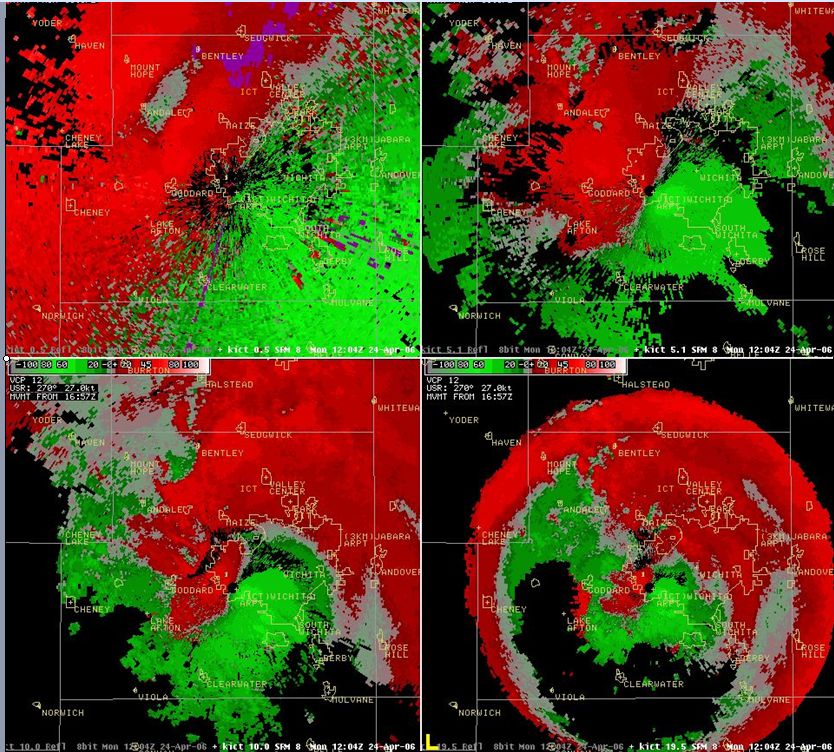
Between 1120 and 1131 UTC on the 24th, two storm echoes rapidly developed over south central Kansas, with one echo forming over southeastern Reno County and the second storm forming over northeastern Kingman County (fig. 11). Both storms developed at least weak, deep rotation within approximately 15 minutes of initial echo identification and intensified between 1131 and 1150 UTC forming at least moderate, deep mesocyclones. The southern-most supercell which came out of Kingman County into Sedgwick County developed a strong, deep mesocyclone (1 nm wide) by 1155z per KVNX WSR-88D just west of Goddard (figures 12a and 12b). KVNX showed rotational velocities of approximately 39 kt at 60 nm range at both 17,000 ft AGL and 23,000 ft AGL, indicating a strong mesocyclone. Also at this time, a strong reflectivity core aloft can be seen above both the freezing level and minus 20 celsius heights, and with deep, strong rotation present within the supercell, severe hail was probable at this point with significant severe hail possible (ref. Radar Assistance Web Site - Hail Forecasting). Figures 13a and 13b shows the much weaker KICT WSR-88D perspective only 1 minute later as the storm had already entered the KICT WSR-88D "cone of silence". Once the storm of interest had moved into western Sedgwick County around 1135 UTC, within the "cone of silence", it would necessitate that the radar operator utilize the KVNX WSR-88D (or another surrounding radar site) in order to properly diagnose the storm threatening the greater Wichita Metropolitan area. Figures 14a and 14b along with figures 15a and 15b show the KVNX WSR-88D and KICT WSR-88D Reflectivity/SRM 4 panels for 1204 UTC, respectively, with the supercell now bearing down on west Wichita. Clearly, the KVNX WSR-88D continued to show the supercell structure as the storm moved into west Wichita, while the KICT WSR-88D could not effectively sample the reflectivity core/structure or the mesocyclone with the supercell now well within the radar "cone of silence".
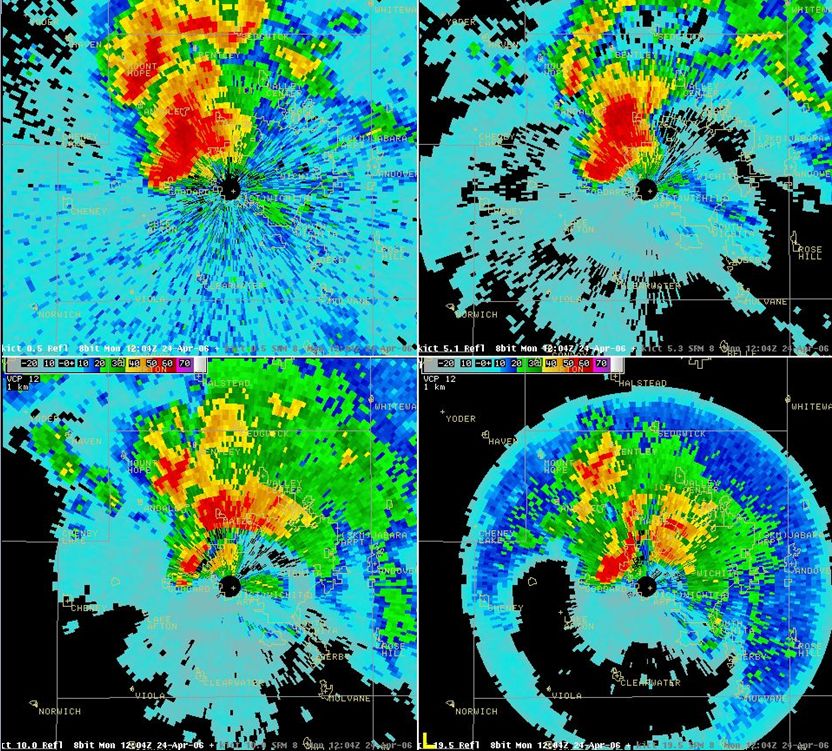
Figure 17a is a 4 panel from the KVNX WSR-88D at 1155 UTC showing Digital VIL, 1 km Composite Reflectivity, Layer 2 Max Reflectivity (24,000 - 33,000 ft AGL), and Layer 3 Max Reflectivity (33,000 - 60,000 ft AGL). This image reveals a very strong, elevated reflectivity core (60 dBZ above 33,000 ft AGL) well above the minus 20 celsius height, and given the deep, persistent rotation within the storm, this was indicative that significant severe hail was probable. Figure 17b shows the KICT WSR-88D corresponding 4 panel perspective at 1152 UTC. With the supercell well within the KICT WSR-88D "cone of silence" at this time, the strong elevated reflectivity core was not effectively sampled. Figure 17c is a 4 panel loop (1125 to 1229 UTC) from the KVNX WSR-88D showing the same parameters as in Fig. 17a. From the loop it can be seen that the very strong, elevated reflectivity core was persistent via KVNX for approximately 30 minutes prior to the storm hitting the west side of Wichita. The above radar comparisons illustrate the importance that radar operators utilize the KVNX WSR-88D for thunderstorms that are approaching or developing over the Wichita Metropolitan area.
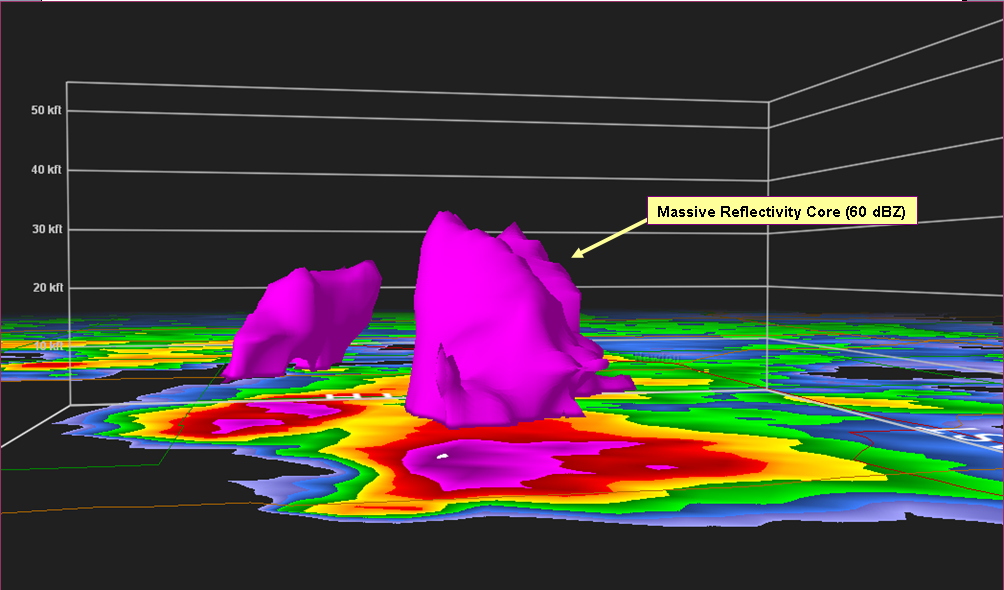 Figure 18a (click on image for full view) |
 Figure 18b (click on image for full view) |
 Figure 18c (click on image for full view) |
|
Figures 18a-c (above) are reflectivity cross sections from 1159 through 1209 UTC from the KVNX WSR-88D via the Gibson Ridge GR2AE radar software which utilizes level 2 WSR-88D data. These cross sections offer a unique, advantageous vertical perspective of the elevated supercell that impacted the Wichita Metropolitan area with very large hail. The very large and strong elevated reflectivity core can be seen extending well above the minus 20 celsius height in Figures 18a and b. Figure 18b also depicts a large overshooting top with this storm while Figure 18c reveals a weak echo region and mid-level overhang above a tight low-level reflectivity gradient. Therefore, the reflectivity structure in this supercell was very supportive of significant severe hail. A second supercell which was beginning to weaken can be seen just to the northwest of the Wichita supercell. Plans are to utilize the Gibson Ridge radar software locally at NWS Wichita beginning in the Spring 2007.
|
||
6. Summary
The elevated supercell thunderstorm that moved across the Wichita Metropolitan area during the early morning hours on April 24th, 2006 produced very large, destructive hail and caused widespread property damage (Fig. 19) to automobiles, homes, and businesses. This supercell was part of a number of mesoscale convective systems that moved across central and southeastern Kansas from April 23rd through April 24th. The storm environment was conducive for severe thunderstorms with large hail given the presence of very steep mid-level lapse rates, most unstable CAPE of 2500 J kg-1 or higher, and Effective Bulk Shear of 35 kt. Other parameters supportive of large hail were revealed on the SPC Mesoanalysis Page and the SPC Observed Soundings page. Intense isentropic lift in association with a veering low-level jet nosing into central and south central Kansas may have supported the development of the early morning supercells in south central Kansas. With the Lamont sounding suggesting a MUCAPE of 3200 J kg-1 and 42 kt of effective wind shear, it is plausible that the low-level jet and subsequent strong isentropic ascent were able to utilize this environment, producing significant hail. However further research is needed to determine why the early morning storms became supercellular while storms earlier in the night did not.
The NAM40 and RUC40 models performed reasonably well with their predicted MUCAPE at 12 UTC; however, both models significantly underestimated the effective bulk shear (1-7 km AGL in this case). The AWIPS LAPS slightly underestimated the MUCAPE at 12 UTC, however it did show strong 1-7 km AGL bulk shear from 09 through 12 UTC, similar to the effective bulk shear values depicted on the SPC Mesoanalysis page for the same time frame. Given that many of the traditional data sets that lend a hand in forecasting such events were rather ambivalent to the actual threat, forecasters are encouraged to utilize soundings such as the Lamont sounding as well as other real-time data sets such as the Wind Profiler Network, the RUC, and LAPS data as a means to produce a probabilistic outcome. Predicting this event as a 3 inch hail event occurring from 12 to 13 UTC was extremely difficult, especially given the NAM40 and RUC40 significant underestimation of the effective bulk shear. Our job as Meteorologists is to see if there is a way to make it easier to anticipate such an event the next time, which is in part a reason for this review.
This case review also demonstrated the importance of utilizing the KVNX WSR-88D radar when storms are threatening the Wichita Metropolitan area in order to avoid the "cone of silence" sampling issues with the KICT WSR-88D. This is due to the fact that the KICT WSR-88D radar is located at the southwestern edge of the Wichita City limits. Various 4 panel comparisons were made between the KVNX and KICT WSR-88D radars as the storm approached and moved through the Wichita City limits. The KVNX WSR-88D clearly showed the persistent, supercellular nature of the storm as it approached and moved through Wichita, whereas the KICT WSR-88D had serious sampling issues long before the storm entered the west side of town. This review also indicates that it is crucial that National Weather Service in Wichita is able to maintain a dedicated line to the KVNX WSR-88D radar in order to have proper, effective sampling of thunderstorms in Sedgwick County, including the City of Wichita with a population of in excess of 350,000 people.
Finally, plans are to utilize the Gibson Ridge radar software operationally at the National Weather Service in Wichita beginning in Spring 2007. This software will offer advantageous vertical cross sections of reflectivity and velocity to assist radar operators with severe storm detection.
7. References
Radar Assistance Web Site - Hail Forecasting via the WFO ICT SOO Intranet Page.

