|
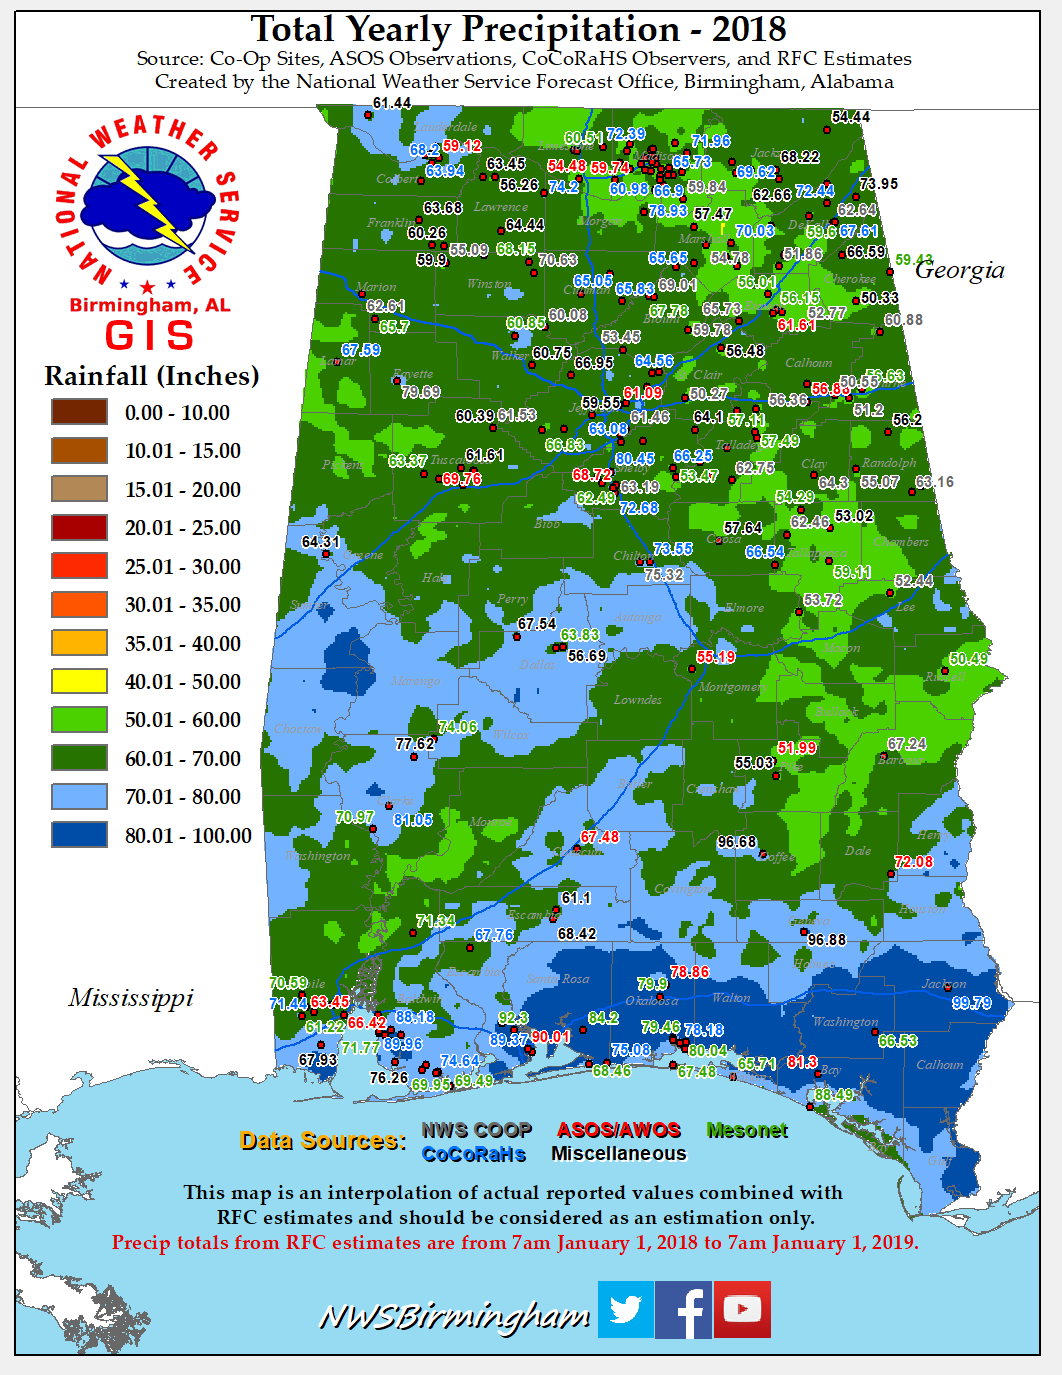
2018 will be remembered as a fairly normal year hydrology-wise, with somewhat above normal rainfall, scattered episodes of mostly minor river flooding, and periodic flash flood events from localized heavy rainfall. Rainfall for the year averaged between forty five and sixty five inches, with locally greater amounts. The driest areas were found in the southeastern sections.
January began on a dry note with monthly rainfall averaging from one to three inches in most areas, although three to five inches fell in portions of the Alabama and lower Tallapoosa River basins. This helped maintain the relatively dry conditions that had persisted from late 2017 across much of Central Alabama.
February was a different story as periodic storm systems brought above normal rainfall back to the area. Monthly totals averaged six to twelve inches along and north of a Selma to Anniston line, with four to six inches south of this area. However, due to the lingering dry antecedent conditions, only minor river flooding occurred during the month on portions of the Tombigbee and Black Warrior Rivers.
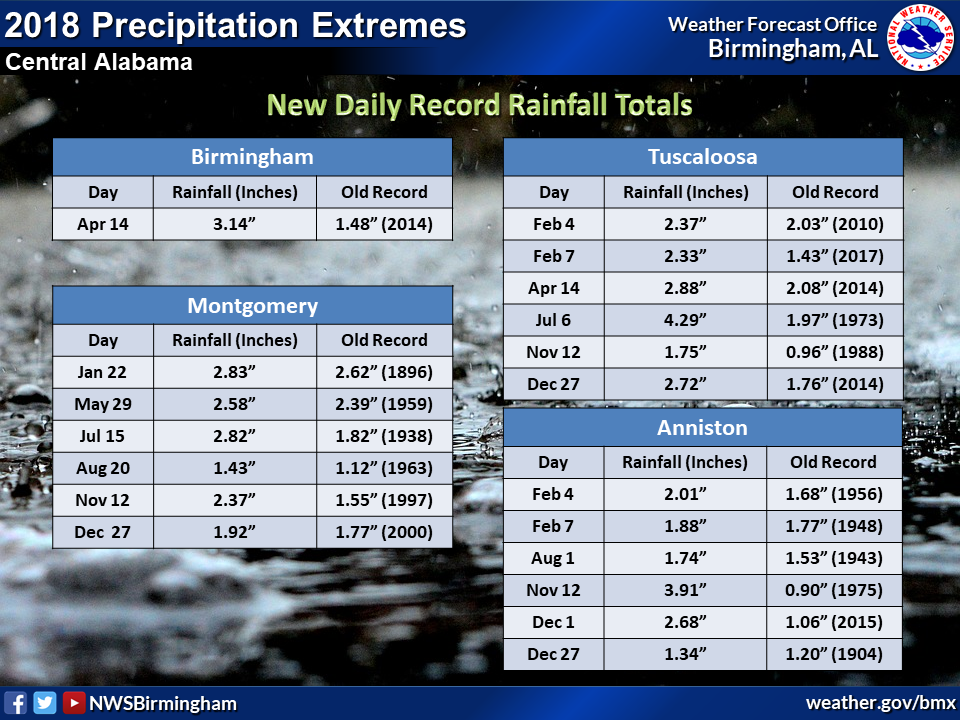
Below normal rainfall returned in March, but April transitioned to a typical early spring-time pattern. Rainfall of three to five inches occurred over the eastern sections of Central Alabama in April, and five to eight inches with locally greater totals in the western counties. Minor river flooding was observed on portions of the Black Warrior, Tombigbee and upper Cahaba Rivers during the month. Localized heavy rainfall also produced flash flooding during the early morning hours of the 15th in Dallas County. Several roadways were flooded from this rainfall, as well as portions of the Valley Grande Golf Course.
Above normal rainfall continued into May across much of Central Alabama, although monthly totals averaged below normal in east-central and southeast sections. On the 23rd, three to five inches of rain fell over Lee and Russell Counties. This produced significant flash flooding, with numerous roads flooded and washed out, as well as some bridge collapses in Lee County. Late in May, heavy rain fell from sub-tropical storm Alberto as it moved northward from the Gulf of America. From the 28th to the 31st, rainfall averaged three to four inches, with five to eight inches over portions of the lower Cahaba and Alabama River basins. However, due to the extended duration of the rainfall and relatively low antecedent stream flows, no significant flooding occurred on area rivers and streams. But, on the night of the 28th into the morning of the 29th, heavy rainfall produced widespread flash flooding over portions of Tuscaloosa, Hale, Greene, Dallas, Perry, Chilton and Elmore Counties. Many roadways and some apartments were flooded in the Eutaw area, and numerous streets were flooded in Marion with some water rescues needed. Numerous state and county roads were flooded in Perry County, with roadways and some homes also flooded in Chilton County.
As Central Alabama moved through the summer season, a typical pattern of scattered convection was observed. Periodic heavy rainfall from summertime thunderstorms produced localized episodes of flash flooding from June through September. Rainfall of up to eight inches in northwest Russell County on June 17th flooded some roads and streets in the area, and localized heavy rainfall in the Homewood area of Jefferson County also produced street flooding.
In July, over four inches of rain during the evening hours of the 6th produced street flooding in Tuscaloosa, with numerous roads flooded and many vehicles stalled. On the 17th, over three inches of rain in a couple of hours made many roads in the Jasper area impassable, with some businesses flooded. And during the evening of the 31st, two to four inches of rain in Gadsden during a couple of hours flooded streets and stalled vehicles, with water entering at least one home.
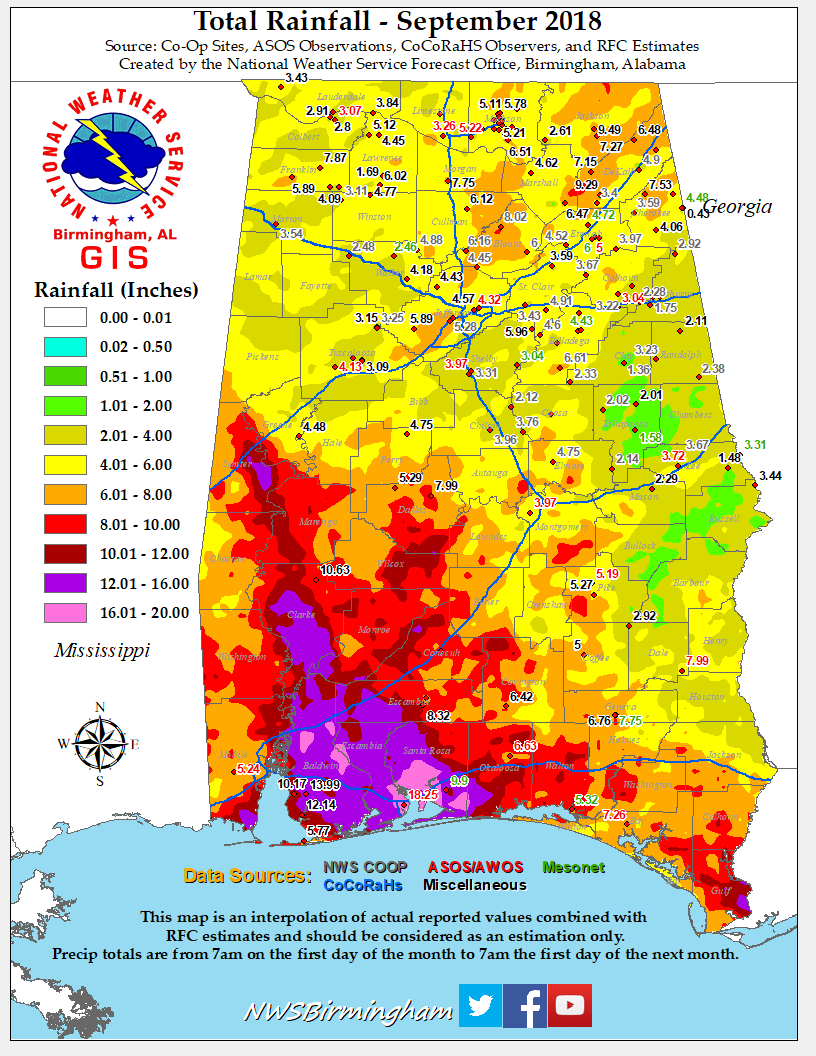
In September, three to six inches of rain on the 26th produced flash flooding in the western sections of the Birmingham metropolitan area, including portions of downtown Birmingham, Bessemer, McCalla, Brighton and Hueytown. Significant flash flooding occurred along and near Valley Creek, especially in the Hueytown area. Portions of the Bessemer Superhighway became impassable due to the heavy rainfall.
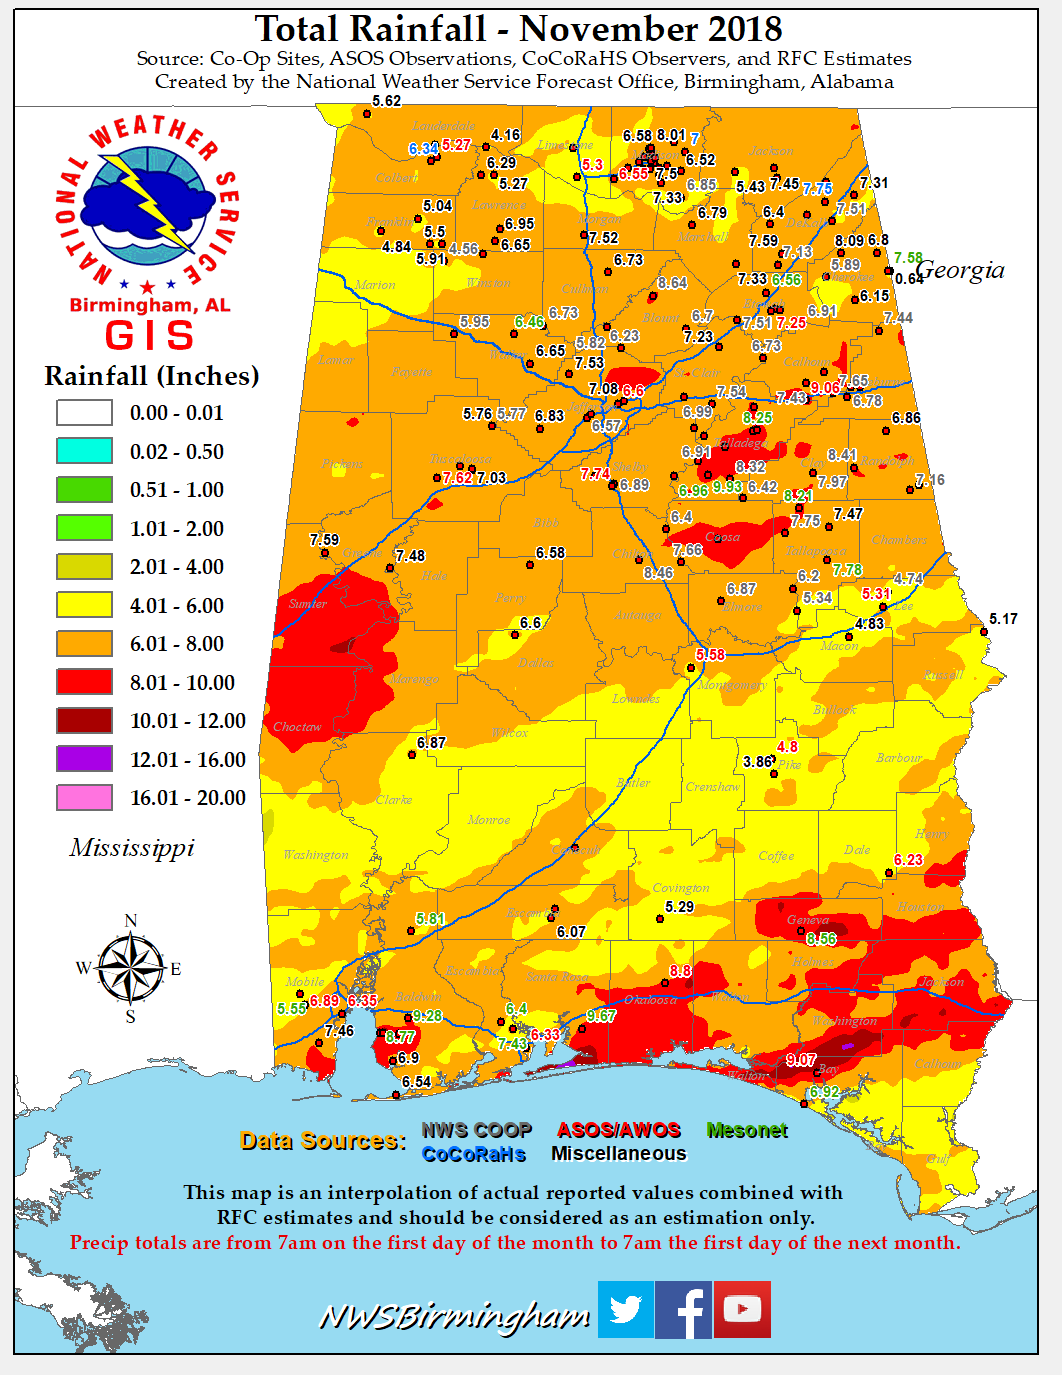
A brief respite occurred in October with below normal rainfall returning. However, this was short-lived as above normal rainfall reappeared in November, with monthly totals averaging from five to nine inches. However, most rivers and streams remained within their banks, with only some localized rises to Caution Stage observed at a few river forecast points.
The above normal pattern of rainfall continued in December with most areas reporting much above normal rainfall as the month was winding down. Monthly totals generally averaged from eight to twelve inches, with localized higher amounts. The most significant flooding event of the month occurred following heavy rainfall of up to six inches or more that occurred from the 27th to the 28th. This rainfall, in addition to rainfall during the next few days, sent numerous rivers into flood across Central Alabama. Minor flooding occurred along the Tombigbee, Black Warrior, Sucarnoochee, Alabama, lower Tallapoosa and lower Coosa River, as well as on Catoma Creek near Montgomery and on Village Creek in the Birmingham area. Moderate flood stages were reached at Demopolis on the lower Tombigbee River and on Catoma Creek at the U.S. Highway 331 Bridge near Montgomery.
Below are the Drought Conditions each month in 2018
|


