Overview of Tropical Storm Fred
All images on this page may be expanded with a single click and can be returned to original size with a second click.
Tropical Storm Fred, at its strongest, was a tropical storm containing sustained winds up to 65mph and a central pressure of 994mb. The main impacts to our region revolved around heavy rainfall, strong wind gusts along our coastal communities, and storm surge ranging from 1 to 4 feet along the coast of the FL Panhandle and Big Bend (highest across the Big Bend at Indian Pass and locations eastward).
 |
||
| Infrared satellite animation of Tropical Storm Fred as it made landfall on Monday afternoon in Cape San Blas on August 16, 2021. Imagery from NOAA GOES-16 Satellite and compiled by Scott Bachmeier at CIMSS (Cooperative Institute for Meteorological Science Studies). | ||
 |
 |
|
| Estimated Rainfall amounts across the local area from Tropical Storm Fred. Highest rainfall amounts occurred along and just west of the center with high amounts also extending east of the center into the Apalachicola River Basin. | NWS radar imagery of Tropical Storm Fred as it moved towards the FL Panhandle. Orange boxes are marine warnings (only issued outside areas of tropical storm warnings, or where waterspouts are possible), red boxes are tornado warnings, and green are flash flood warnings. Yellow boxes are severe thunderstorm warnings (typically only issued outside area of tropical storm warnings). Imagery compiled by Brian McNoldy. | |
Photos & Video & Tweets
| Storm Surge - Franklin/Gulf County | |||||
 |
 |
 |
 |
||
| Elevated Surf at St. George Island. Image: Franklin County Sheriff Office. |
Surge at the St. George Island Bridge. Image: Franklin County Sheriff Office |
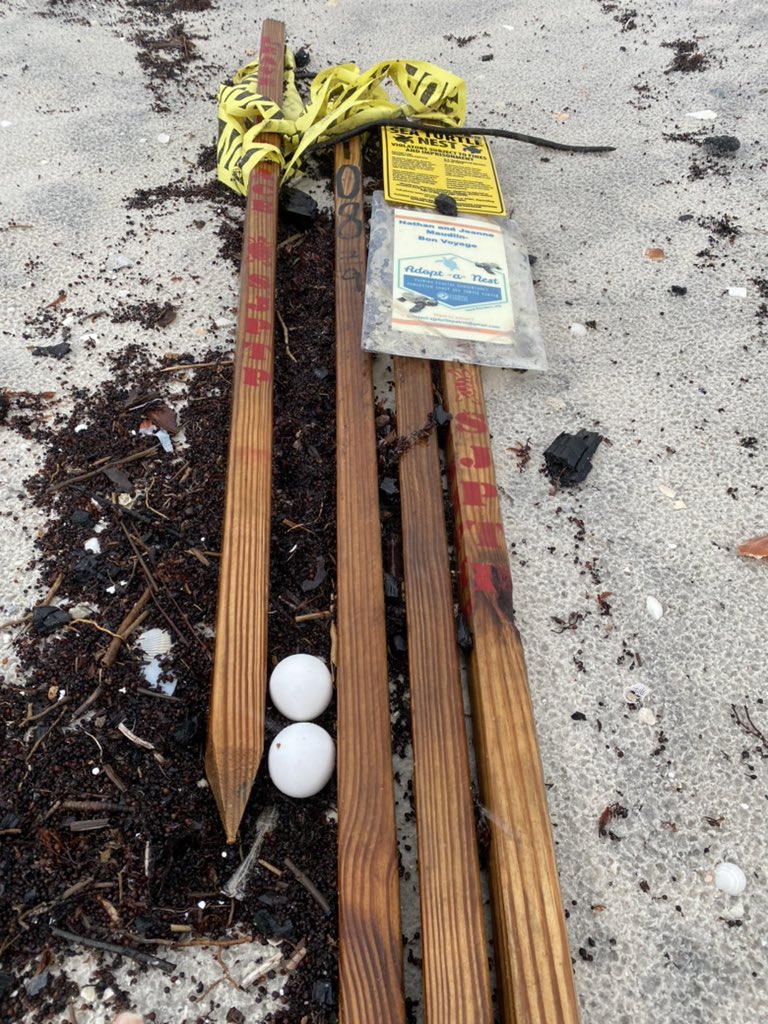
Sea Turtle nests were destroyed by the storm surge. Photo: ConeHeads8020 Twitter. |
Surge flooding at Indian Pass. Including a car that drove around barricades and became stuck. | ||
| Storm Surge - Gulf County | |||||
|
|
||||
Storm History
Information is preliminary and could change with the release of the National Hurricane Center's final report of Tropical Storm Fred (found here when available).
The National Hurricane Center began tracking a disturbance east of the Virgin Islands and designated the system as a Potential Tropical Cyclone 6 on August 9th. The initial forecast called for a west-northwest track across the Caribbean Islands under the influence of a subtropical ridge to the north. The system was upgraded to Tropical Storm Fred on the 10th and attention to Fred across our forecast area increased as the potential for impacts grew. The combination of land interaction with the rugged/mountainous terrain of Hispaniola and wind shear from an upper low over FL resulted in Fred weakening to a tropical depression the following day. Further interaction with the Greater Antilles caused Fred to open into a wave (a system with no closed circulation) as it emerged into the extreme southeast Gulf on the 14th. This change prompted NHC to designate the system as “Remnants of Fred”, leading to a discontinuation of active warnings in the Keys at the time.
By the early morning hours of the 15th, a Tropical Storm Watch was issued for the FL Panhandle and coastal Franklin County, as the forecast called for a north-northwest motion around the western periphery of the aforementioned ridge. Fred was also forecast to become a tropical storm once again prior to landfall. The Remnants of Fred then regained tropical storm status later that morning on the 15th and watches along the northern Gulf coast were upgraded to a Tropical Storm Warning. Fred steadily strengthened over the warm Gulf waters until landfall near Cape San Blas, with max sustained winds of 65 mph on the 16th. Rapid weakening ensued as Fred moved inland and became post-tropical on the 17th near central AL/GA.
One of the defining traits of Fred was its disorganized nature through much of it's life up until landfall on Monday afternoon August 16th. The models struggled greatly with this disorganized nature of Fred, as they normally do with disorganized systems. That is one reason track forecasts shifted steadily back east the 24 hours prior to landfall. This trend, is not unusual for disorganized storms, but it is another reminder that folks need to always be ready for the uncertainty in tracks. It's also important to remember that impacts occur outside the forecast cone.
 |
 |
| The cumulative storm history from Fred. | Satellite imagery from Fred's beginning stages, this was just before it was named a tropical depression. |
Useful Links
Local Post Tropical Cyclone Report.
National Hurricane Center's Tropical Cyclone Report (When Available).
Storm Surge
Even a tropical storm can produce life-threatening storm surge in Apalachee Bay, and that was the case with Fred. As Fred gained strength and focused on the Eastern Florida Panhandle, this set the stage for a long period of onshore flow into Apalachee Bay ahead of the storm that would maximize around the time of landfall. Forecasts for 3-5 feet of storm surge were realized on Monday afternoon as Fred neared Cape San Blas. The tide gauge in Apalachicola recorded around 3.4 feet of storm surge. The surge impacts from Cape San Blas to St Marks were fairly typical for this amount of surge with some areas along the coast inundated. However, the flooding could have been worse had Fred made landfall just a few hours later, near the time of high tide across Apalachee Bay. As Fred moved inland Monday evening, winds over Apalachee Bay diminished and water levels decreased before the high tide Monday night.
 |
 |
 |
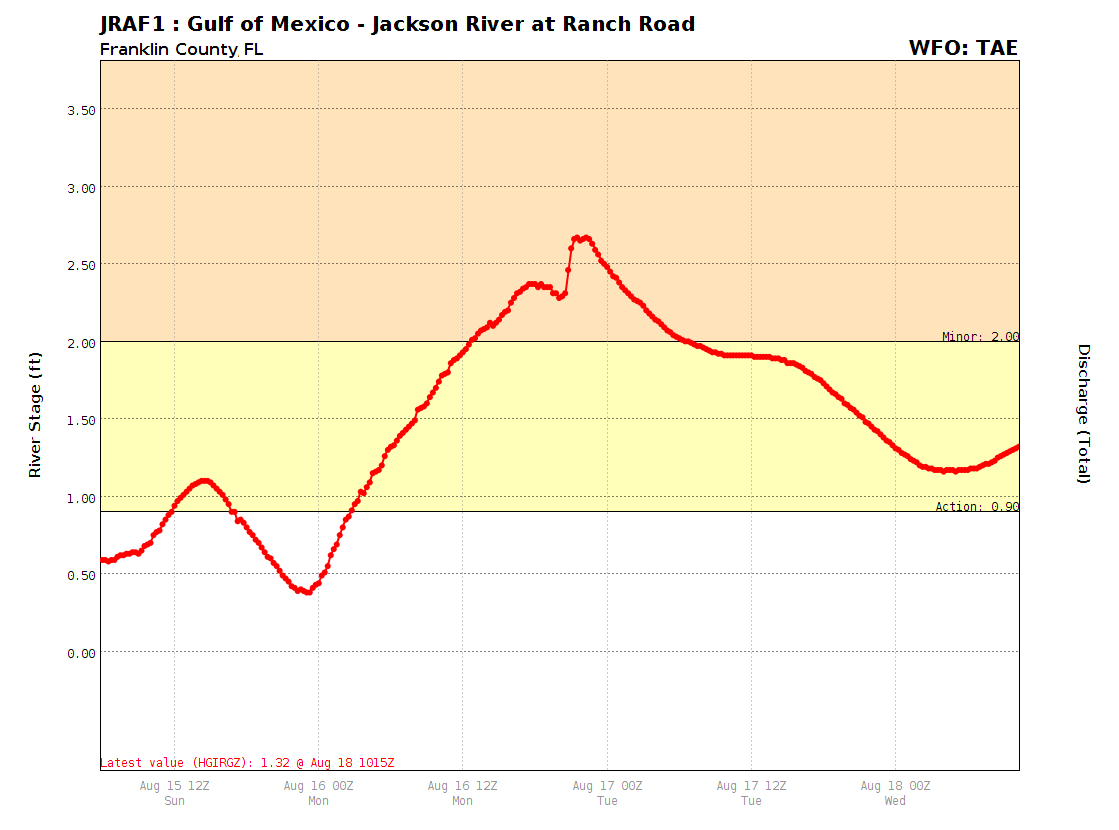 |
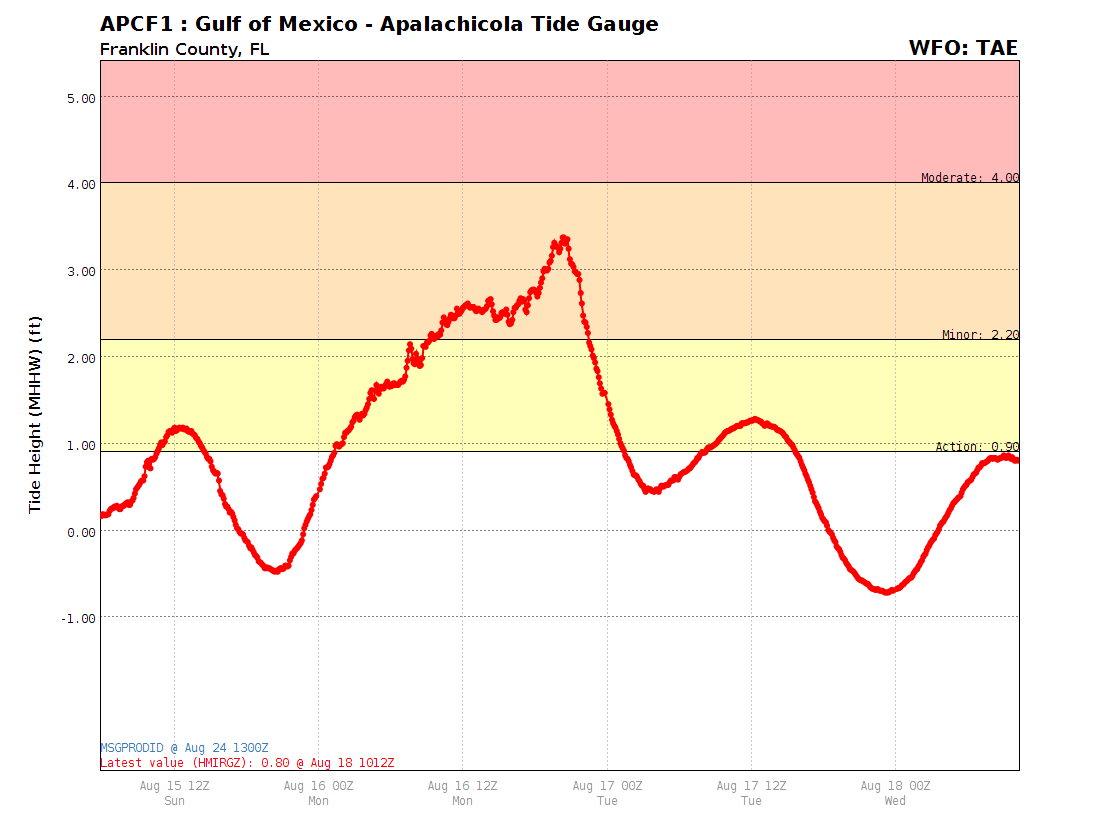
| Hydrograph at the Gulf of America Tide Gauge at Apalachicola during Fred. This shows the peak inundation (approximately 3.37 ft MHHW). | Hydrograph at Searcy Creek at White City during Fred. This shows the peak inundation (approximately 2.40 ft MHHW). | Hydrograph at Shell Point during Fred. This shows the peak inundation (approximately 2.41 ft MHHW). | Hydrograph at Jackson River during Fred. This shows the peak inundation (approximately 2.67 ft MHHW). |
SURGE REPORTS
MAXIMUM OBSERVED WATER LEVEL (WL)...
---------------------------------------------------------------------
ID     CITY/TOWN       COUNTY     STATE  WL  DATUM  DATE/   SOURCE
       OR LOCATION                      (FT)        TIME
---------------------------------------------------------------------
APCF1  APALACHICOLA    FRANKLIN     FL  3.37 MHHW   16/2018 NOS
29.7267  -84.9817

JRAF1  JACKSON RIVER A FRANKLIN     FL  2.67 MHHW   16/2130 USGS
29.7694  -85.0842

SHPF1  SHELL POINT     WAKULLA      FL  2.41 MHHW   16/1218 OTHER
30.0600  -84.2906

SEWF1  WHITE CITY      GULF         FL  2.40 MHHW   16/2345 OTHER
29.8849  -85.2197

SBIF1  SPRING CREEK    WAKULLA      FL  2.31 MHHW   16/1245 USGS
30.0800  -84.3298

PCBF1  PANAMA CITY BEA BAY          FL  1.84 MHHW   16/0812 NOS
30.2133  -85.8783

PACF1  PANAMA CITY MAR BAY          FL  1.82 MHHW   16/1112 NOS
30.1523  -85.6669

SUWF1  SUWANNEE        DIXIE        FL  1.70 MHHW   16/1315 USGS
29.3281  -83.1440

STIF1  STEINHATCHEE    TAYLOR       FL  1.49 MHHW   16/1100 OTHER
29.6761  -83.3962

NUTF1  NUTALL RISE     TAYLOR       FL  1.35 MHHW   16/1215 USGS
30.1497  -83.9642

EFSF1  ECONFINA RIVER  TAYLOR       FL  1.33 MHHW   16/1230 USGS
30.0681  -83.8987

FRHF1  FENHOLLOWAY RIV TAYLOR       FL  1.16 MHHW   16/1215 USGS
30.0113  -83.7776
 |
Media use of NWS Web News Stories is encouraged! Please acknowledge the NWS as the source of any news information accessed from this site. |
|

