Tallahassee, FL
Weather Forecast Office
|
 |
|
 |
|
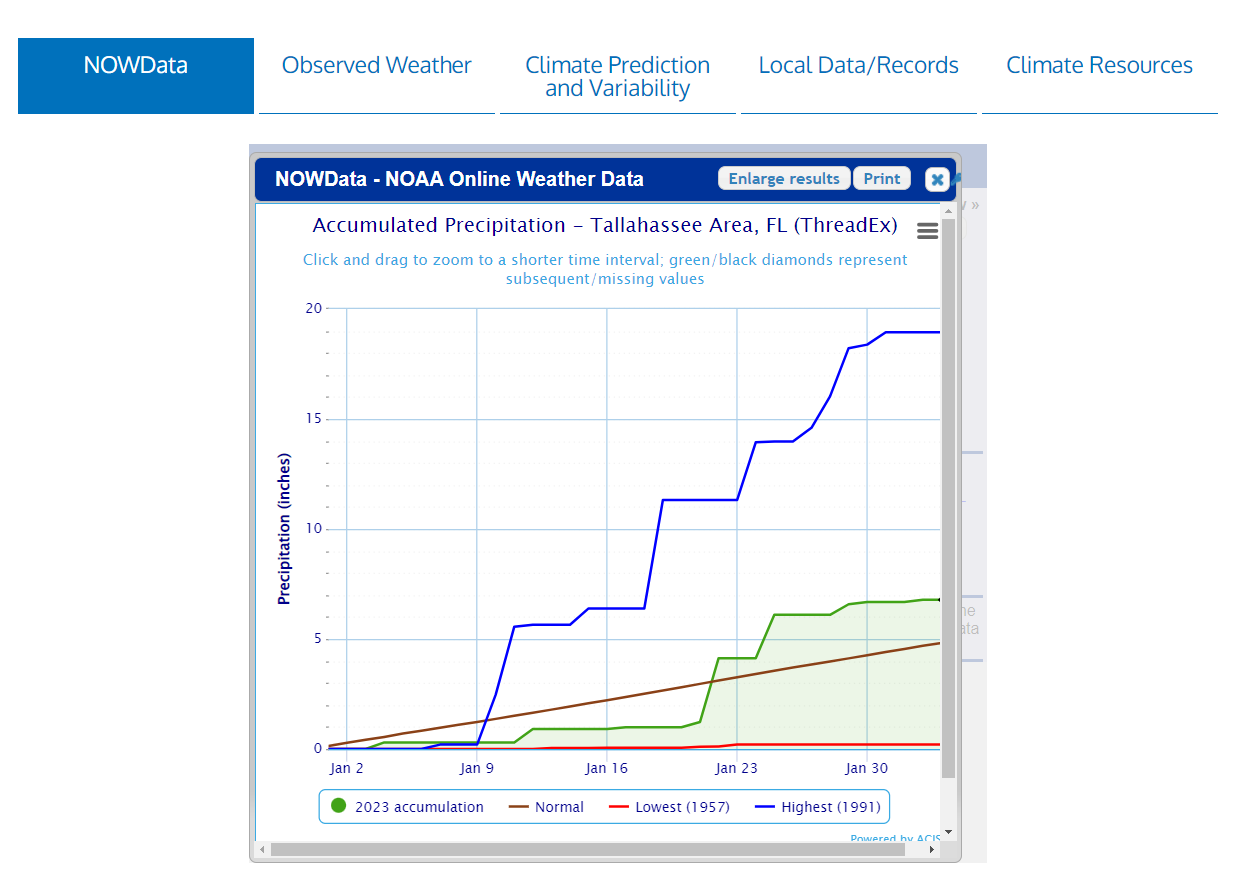 |
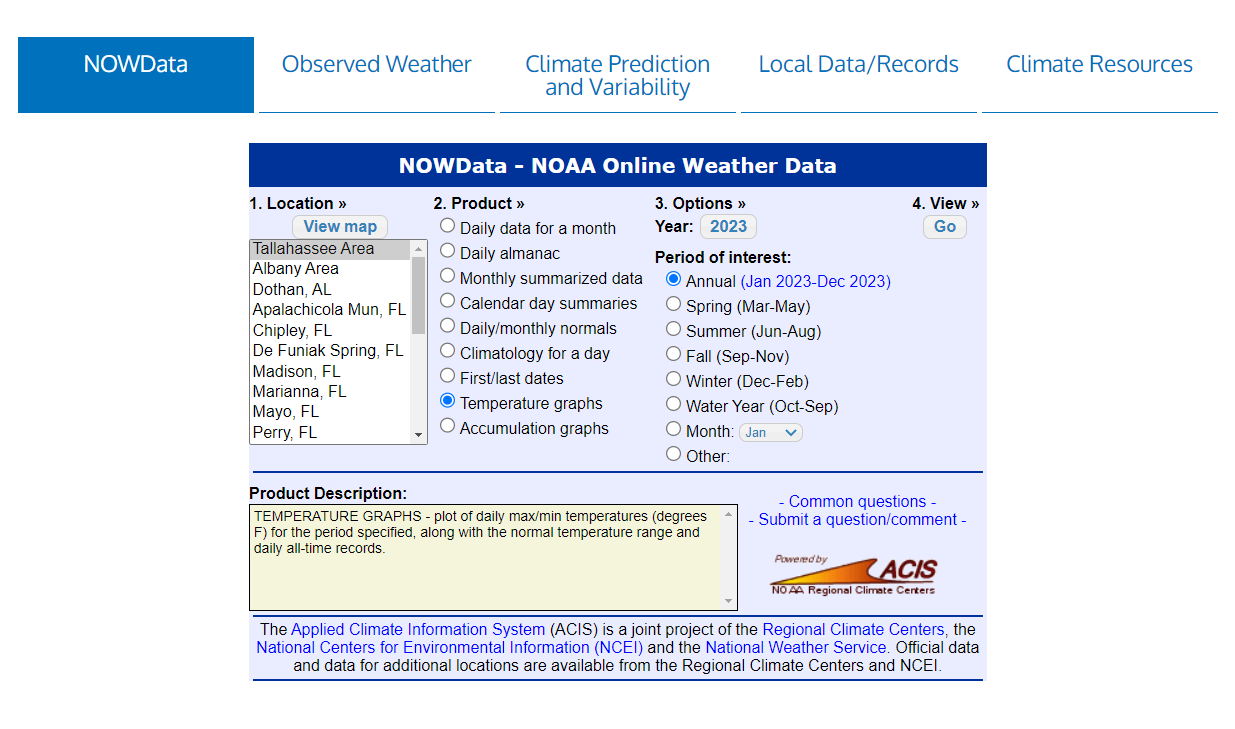
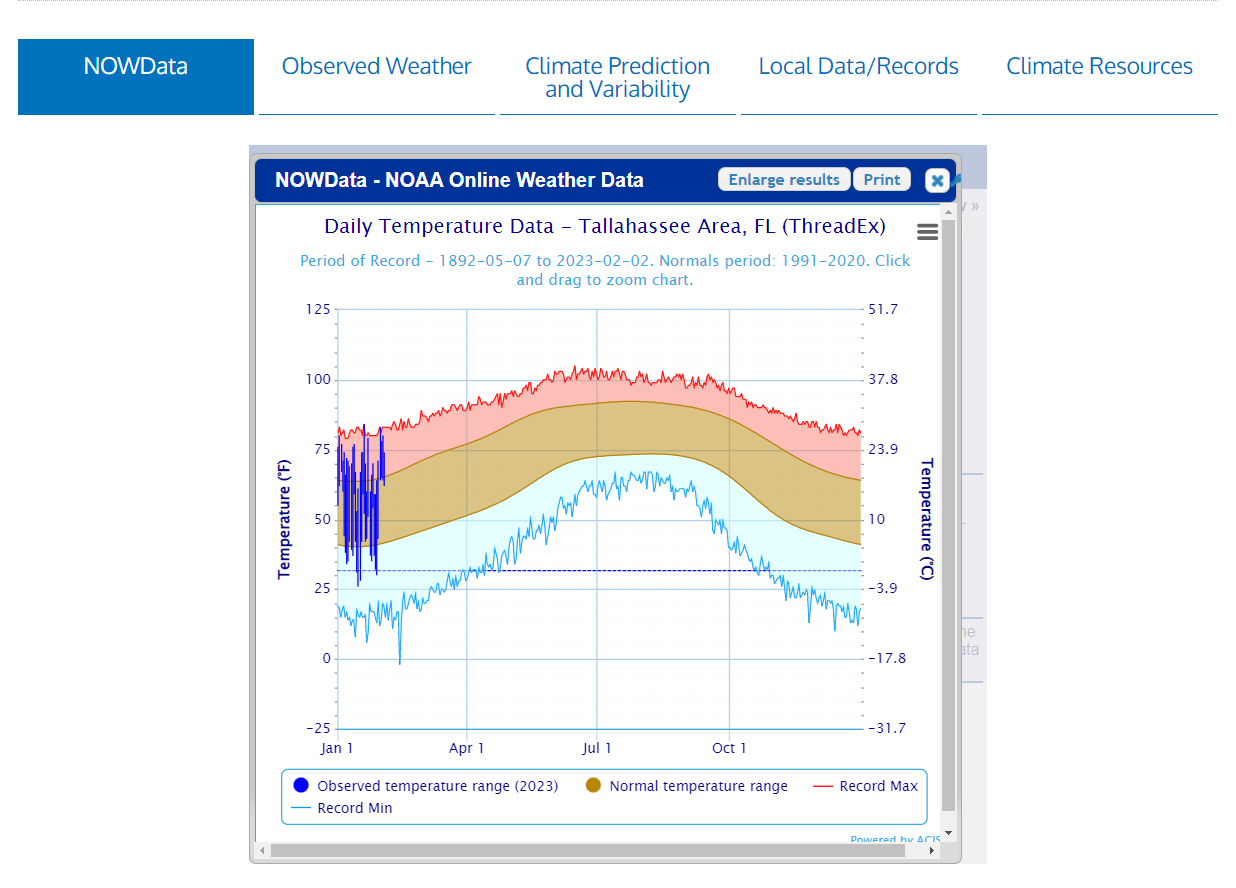
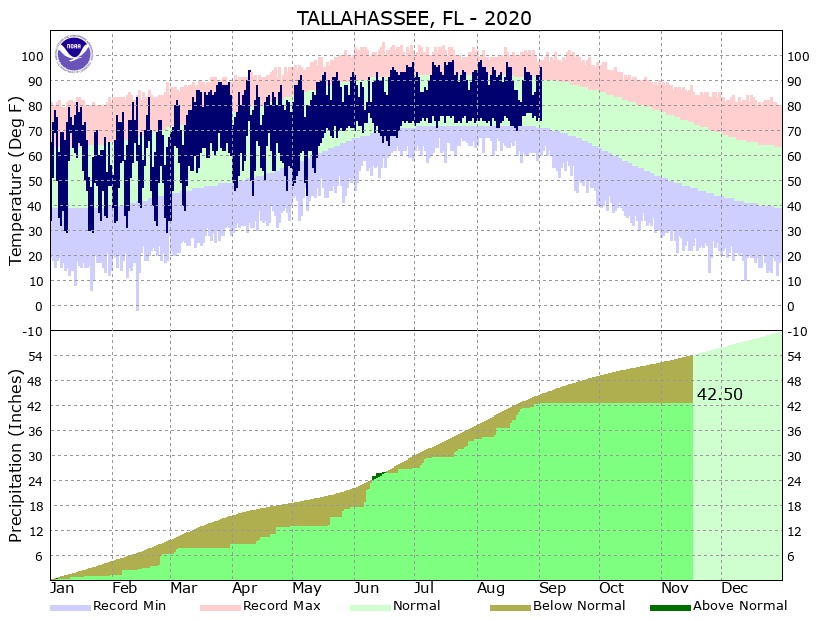
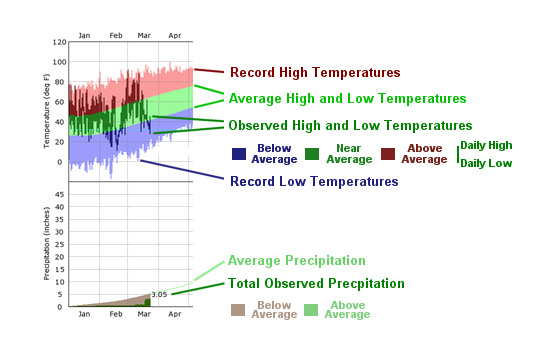
Choose Location and Year at the right to view the selected climate graph:
RECORDS ARE NOT AVAILABLE FOR SOME LOCATIONS
Current Hazards
Hazardous Weather Outlook
National Outlook
Rip Current Risk
Local Storm Reports (Text)
Local Storm Reports (Map)
Submit a Storm Report
Radar Imagery
National
Florida Panhandle (EVX)
Southwest Alabama (EOX)
Tallahassee (TLH)
Valdosta (VAX)
Current Weather
Observations (Map)
Observations (Text)
Observed Precipitation
Rivers and Lakes
Satellite Images
Upper Air Sounding
Forecasts
Aviation Weather
Fire Weather
Forecast Discussion
Forecast Text Products
Hydrology
Local Model Data
Marine Weather
Tropical Weather
Climate
Climate Text Products
Climate Graphs
CoCoRAHS
Drought
Local Data and Records
ENSO
Tropical Cyclone Reports
US Dept of Commerce
National Oceanic and Atmospheric Administration
National Weather Service
Tallahassee, FL
1017 Academic Way
FSU, Love Bldg, 4th Floor
Tallahassee, FL 32306-4509
850-942-8833 (person) or 850-942-8851 (recording)
Comments? Questions? Please Contact Us.

