|
A Review of Local Weather in 2012 |
Overview
While 2012 did not see the temperature extremes that were observed over the past two years, it did finish tied as the 2nd warmest year on record thanks in large part to a very warm spring and mild winter. We also had a busy severe weather season with 627 instances of severe weather or flash flooding occurring across the county warning area during the year. The region was impacted directly or indirectly by three tropical cyclones during what was yet another very active hurricane season across the Atlantic Basin. Rainfall averaged near normal this year at Tallahassee, but that is a misleading statistic. The summer months were the 10th wettest on record, but they were followed by an exceptionally dry fall. Albany, GA received only 30.46" for the year which was a foot and a half below normal. There was only one instance of the mercury reaching 100 degrees at TLH and that occurred in late May. This compares to 14 such occurrences in 2011. There were only 15 days during the calendar year that recorded freezing temperatures at the airport, which is less than half of normal. Additional details follow.
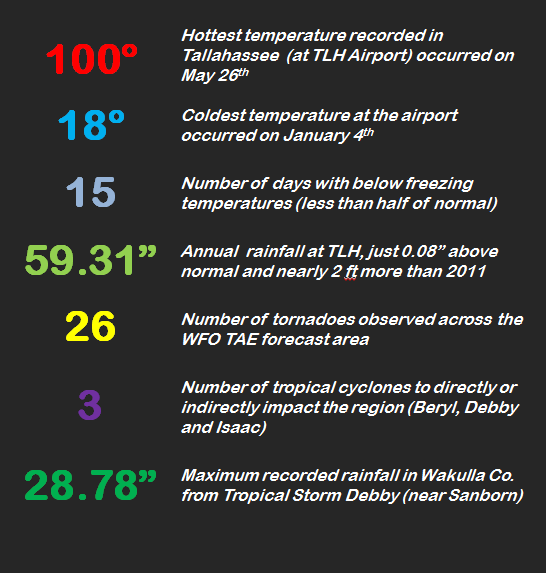
Figure 1. 2012 Weather-by-the-Numbers, highlighting a few weather statistics for the NWS Tallahassee forecast area.
Severe Weather
Since winter temperatures were relatively mild, cool sea surface temperatures over the Gulf were not a limiting factor in severe weather development as they had been over the prior two years. The office verified the following number of severe weather reports this year, which are also plotted graphically in Figure 3.
| Tornado | 26 |
| Funnel Clouds | 12 |
| Waterspouts | 16 |
| Wind Damage | 465 |
| Hail (3/4" or larger) | 97 |
| Flash Floods | 23 |
| Lightning damage | 18 |
The strongest tornado to impact the forecast area occurred on March 3rd in Lanier County, GA. This EF-3 tornado is depicted in the left panel below. Embedded within the reflectivity image, which depicts a classic debris ball signature, is a cell phone photo of the tornado. This event was the most significant that occurred during a 3-day stretch of severe weather from March 1st-3rd. Additional details on this event can be found on the event web page.

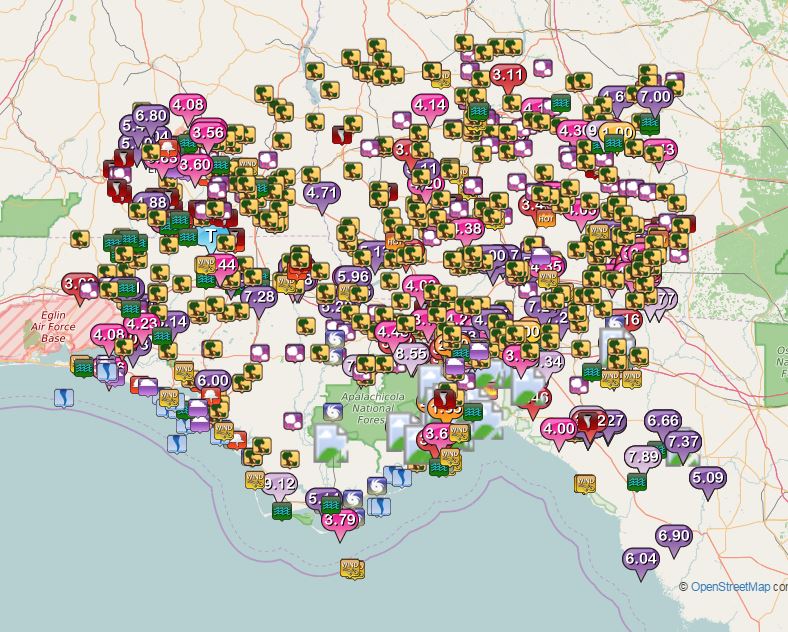
Figure 2. (Left) Radar reflectivity image showing the debris ball associated with an EF-3 tornado as it crossed into Lanier County on March 3rd.
Figure 3. (Right) A map of all the severe weather reports received across our area in 2012. Click on the images for a larger view.
Another notable severe weather event that occurred during the year was the May 22nd hailstorm event. A reflectivity image from the event is depicted in Figure 4 (below left). Twenty one reports of severe hail were received across Southwest GA and Northwest FL including many of golf-ball size or larger. There were also several reports of hail-related crop damage, including from Omega GA (pictured below right in Figure 5).
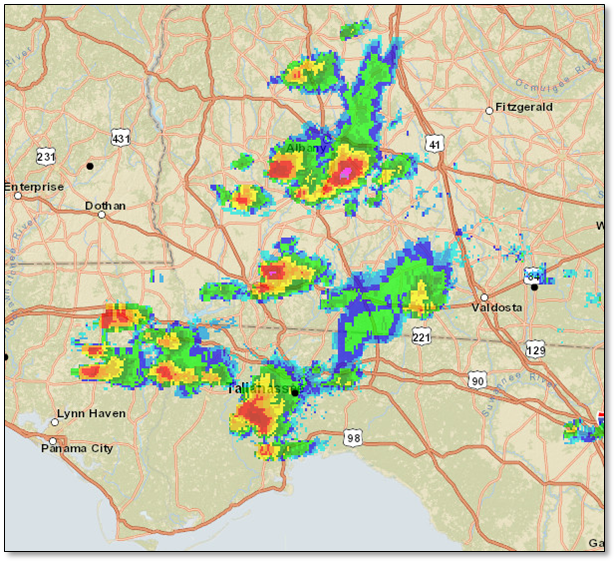
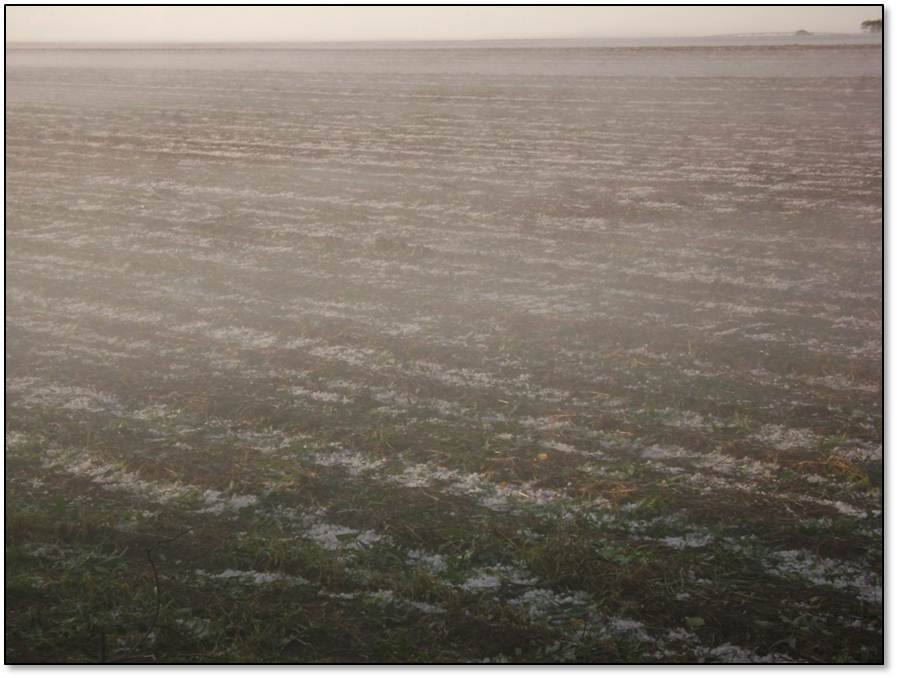
Figure 4. (Left) Radar reflectivity image showing several storms that produced large hail on May 22nd.
Figure 5. (Right) A photo of crops damaged by hail in Omega, GA. Click on the images for a larger view.
There were two significant flash flood events in 2012 not associated with tropical systems. On June 6th, heavy rainfall produced flash flooding around Thomasville with radar estimates of up to 4 inches of rain in one hour just northwest of town. Cars were submerged in some areas. Figure 6 (below left) shows flood waters inundating a hotel near Thomasville. On the morning of August 8th, significant flash flooding occurred around Tifton when an estimated 11 inches of rain fell overnight. Figure 7 (below left) shows the radar estimated rainfall during the event.
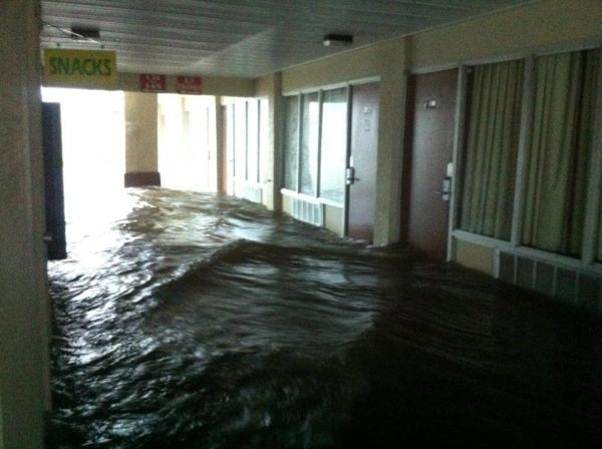
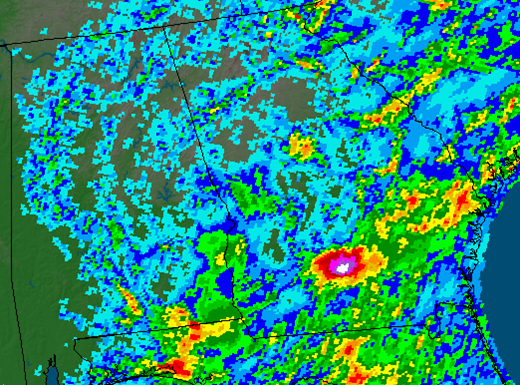
Figure 6. (Left) A photo of flash flood waters inundating a hotel near Thomasville, GA on June 6th.
Figure 7. (Right) Storm-total radar rainfall estimate for August 8th showing in excess of 10" near Tifton County, GA. Click on the images for a larger view.
Hurricane Season
The 2012 Hurricane Season continued the trend of active Atlantic Basin seasons that began in 1995. Nineteen named storms developed across the basin once again this season – tied with 1887, 1995, 2010 and 2011 for third highest number on record. Preliminary tracks for all 19 storms can be found in Figure 8 below. See NOAA's article summarizing the season as a whole.
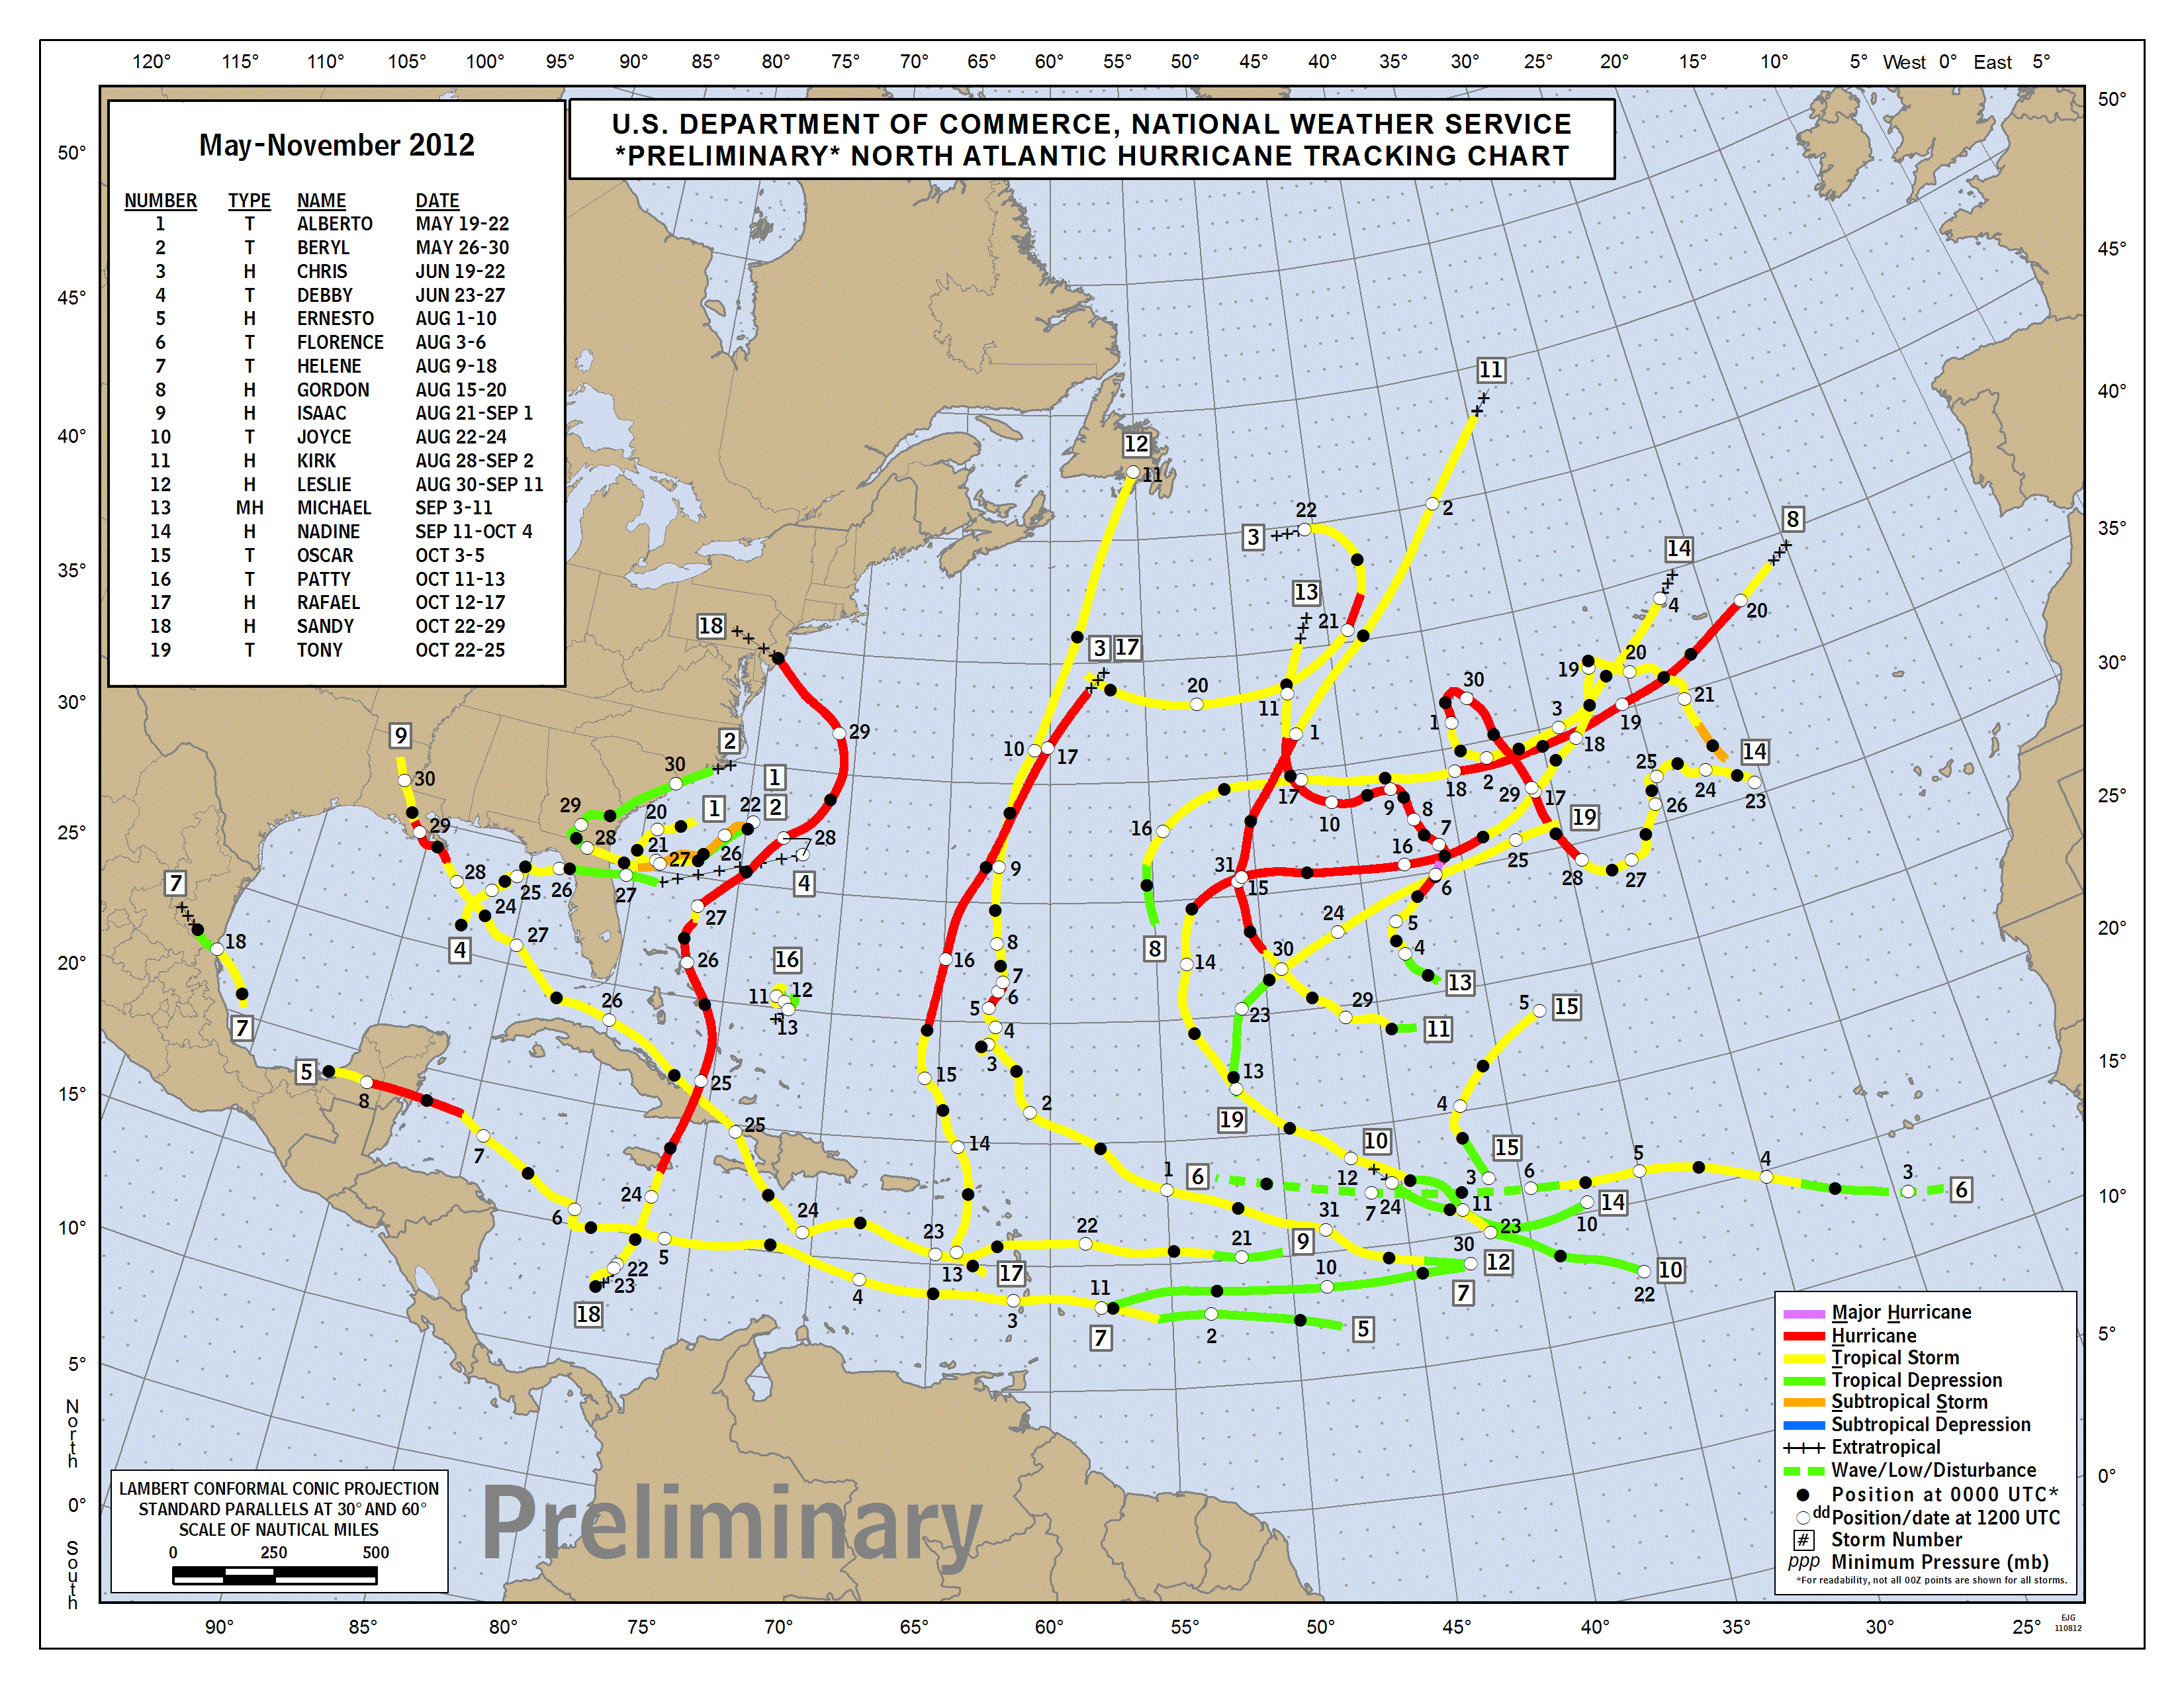
Figure 8. Preliminary storm tracks for the 2012 Atlantic Hurricane Season.
TS Beryl
Three storms either directly or indirectly impacted the local forecast area. The season was notable for its early start, with two named systems developing in May, even before the official start of the season. Tropical Storm Alberto developed on May 19th with TS Beryl forming on the 26th. Beryl took a very unusual track approaching the Northeast FL coast from the northeast (see Figure 9 below left). Figure 10 (below right) shows a visible satellite image of Beryl at its closest approach to the forecast area over Memorial Day weekend before it looped back to the northeast. Beryl's local impacts were mainly in the form of torrential rains across the Suwannee Valley, also depicted in Figure 9. The highest rainfall total in the local forecast area was 12.65 inches in Lafayette County at Midway, FL.
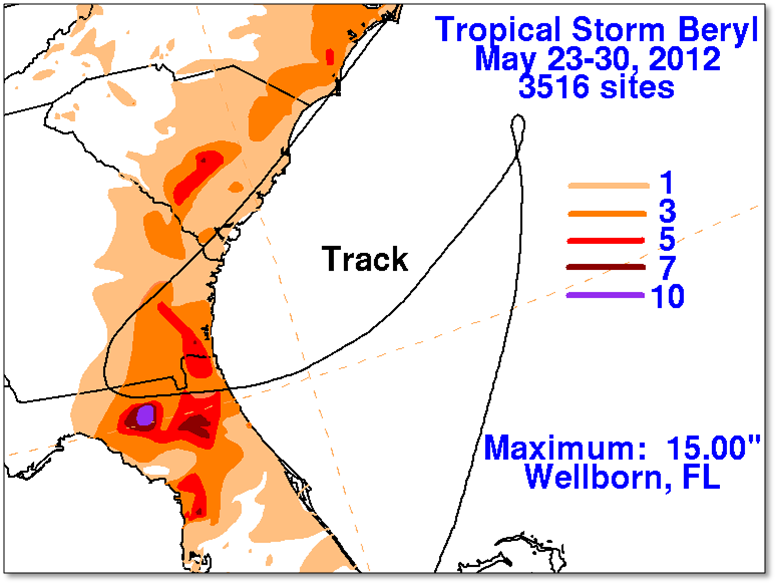
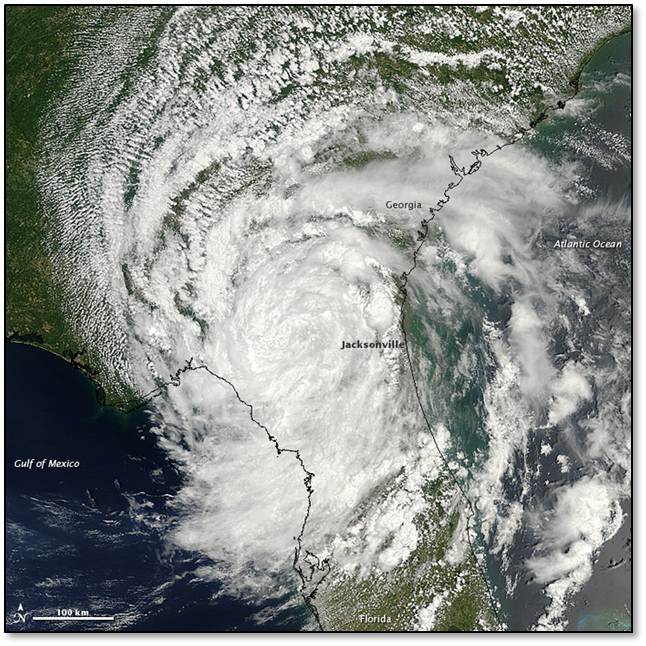
Figure 9. (Left) Track of Tropical Storm Beryl from May 23rd-30th. Storm-total rainfall is also depicted.
Figure 10. (Right) Visible satellite image of Beryl as it made its closest approach to the forecast area.
TS Debby
Of the three storms, Tropical Storm Debby in June had the greatest impact on the local forecast area. Debby was the first tropical cyclone to bring tropical storm conditions to the NWS Tallahassee County Warning area since Ida in November 2009. Debby was also the earliest 4th Atlantic Basin storm of the season to develop since records began in the middle of the 19th century. Debby tracked slowly across the Northeast Gulf of America, passing south of the Florida Big Bend on June 25th and 26th (Figure 11 below). Debby was a very difficult storm to forecast, but ultimately brought torrential rainfall to the Florida Big Bend (also depicted in Figure 11). This resulted in record rainfall in Wakulla County, record flooding on the Sopchoppy River, and a record discharge from Wakulla Springs. Figure 12 shows a visible satellite image of Debby. Additional information on this storm can be found on our event web page.
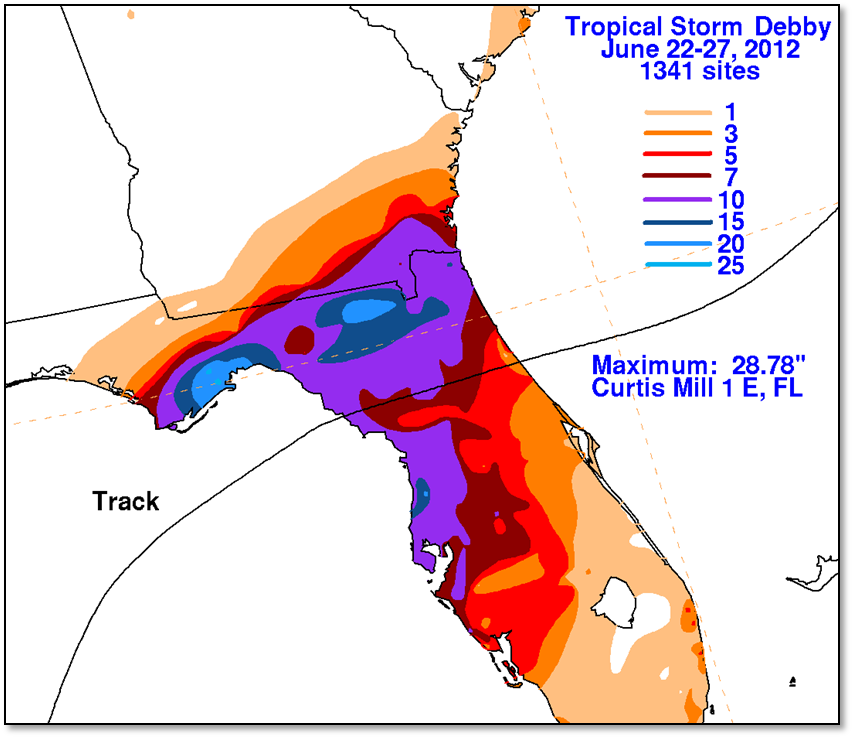
Figure 11. (Left) Track of Tropical Storm Debby from roughly June 23rd-27th. Storm-total rainfall is also depicted.
Figure 12. (Right) Visible satellite image of Debby.
Hurricane Isaac
Hurricane Isaac passed mainly south and west of our area, but some tropical storm force wind gusts were recorded near Panama City, and there was storm surge of 2 to 4 feet from Destin to Apalachee Bay, which produced minor coastal flooding. High surf was also reported along the coast and there were four weak tornadoes in our area. Figure 13 shows some of the coastal flooding in Panama City, FL. Figure 14 is a visible satellite image of Isaac as it approached Southern Louisiana. Additional details on Isaac's local impacts can be found in this Post Tropical Cyclone Report.
Figure 13. (Left) Storm surge flooding in Panama City, FL from Hurricane Isaac on August 28th.
Figure 14. (Right) Visible satellite image of Isaac as it approaches Southern Louisiana.
Temperature & Precipitation Trends
The year 2012 had an average temperature of 69.9 degrees, which was 2.1 degrees above normal. This ties with 1998 for the 2nd warmest year on record in Tallahassee, behind only 1949 which had an average temperature of 70.1 degrees. The coldest temperature of the year was 18 degrees on the morning of January 4th. This tied the record low for the date. No other daily record low temperatures were recorded for the remainder of the calendar year. Freezing temperatures were observed on only 15 days this year. The last freeze of the 2011-2012 season occurred on Valentine's Day. This is about a month earlier than usual. A record high temperature was establish on the February 24th when the mercury soared to 83 degrees. March 2012 was exceptionally warm across most of eastern North America. In Tallahassee, it was the 2nd hottest March on record with temperatures averaging 8.7 degrees warmer than normal. Each of the final 18 days of the month saw temperatures reach at least 80 degrees. Daily record high temperatures of 87 degrees were tied on the 14th and 17th. The highest temperature of the month was 88 degrees, reached on the 15th, 24th and 27th. April and May also came in much warmer than normal. Record highs were set on the first two and last two days of April. The 95-degree reading on the 30th tied for the all-time highest April temperature recorded at TLH. In May, the temperature soared to 100 degrees on the 26th. This also set a new daily record and was ultimately the hottest temperature of the year. The meteorological Spring of 2012 (March-May) was the warmest on record in Tallahassee. This year's spring average temperature was 72.3 degrees, a full degree above the previous record established in 1948. Fortunately, these temperature anomalies did not persist through summer, which saw near normal temperatures. In fact, the 100-degree reading of May 26th was not reached during the summer months, although we got close when we tied the daily record for July 25th of 99 degrees. The only other temperature record established for the remainder of the year occurred on November 3rd when the 86-degree reading tied the daily record. Overall, temperatures during autumn were near normal with September and October slightly warmer than normal and November cooler than normal. The first freeze of the season occurred on November 25th, nine days past the average date. December was nearly four degrees warmer than normal with five days reaching 80 degrees and the coldest temperature a modest 26 degrees.
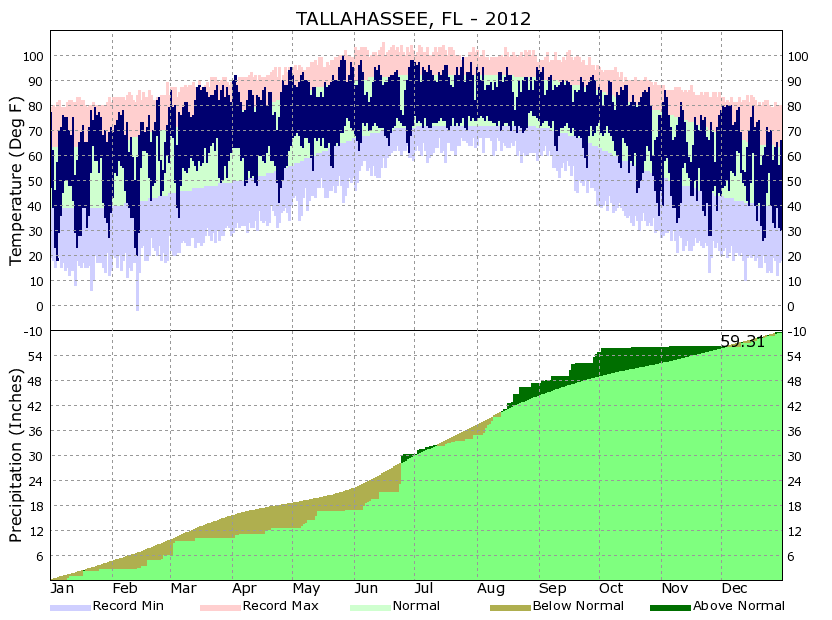
Figure 15. Temperatures and precipitation in Tallahassee during the year 2012.
Rainfall for the year came in very close to normal at 59.31 inches. This is just 0.08 inches above normal and two feet more than we received in 2011. The winter and spring months were drier than normal and we were running a deficit of around 6 inches by May 1st. Things began to turn around in May and the summer months of June and August were much wetter than normal. June rains totaled 13.10 inches and were augmented by the 8.74 inches received from Tropical Storm Debby. The wettest calendar day of the year was June 25th when 6.88 inches fell. Despite July falling a couple of inches shy of normal rainfall, the Summer of 2012 came in as the 10th wettest on record with 30.25 inches measured from June 1st through August 31st. September was also wetter than normal, but the spigot shut off abruptly after October 3rd. Only 0.09 inches fell for the remainder of that month. In fact, only 0.43 inches of rain fell from October 4th through December 10th. November measured only 0.34 inches which tied for 4th driest on record and the driest November since the "Dust Bowl" years of the 1930s. The dry autumn erased all of the surplus gained over the summer months and the year as a result came in close to normal.
Drought Conditions Persist
Parts of Southwest GA and Southeast AL were considerably drier than our FL zones as they picked up less rainfall from the tropical systems. For example, Albany GA received just over half the rain that fell in Tallahassee. Most of the forecast area was experiencing extreme to exceptional drought conditions as of May 1st (Figure 16, below left). Considerable improvement occurred after that. However, as can be see in the image to the right, extreme drought persisted across portions of Southwest GA through the end of the year.
Figure 16. U.S. Drought Monitor from May 1st (left) and December 25th (right) of this year. Severe, extreme, and exceptional drought conditions are depicted as medium orange, red, and brown respectively.
Previous Years
Similar year-in-review web pages for previous years are available via the pull-down menu below.
The author of this page, Mark Wool, would like to acknowledge contributions from Alex Lamers (imagery), Donald Van Dyke (warning statistics), and Tim Barry (compiling climate statistics through the year).

