Hurricane Debby Strikes the Florida Big Bend
August 5, 2024
Overview
Hurricane Debby originated as a tropical wave at the end of July 2024 in the Central Atlantic Ocean. This tropical wave moved west-northwest through the end of July and into the early part of August. Development of this wave occurred very slowly through the next week as it moved through the Lesser and Greater Antilles in the Caribbean. The National Hurricane Center initiated advisories on Potential Tropical Cyclone Four on August 2nd at 11am as the system continued to organize and observational and model trends increased confidence that a tropical storm would develop. Debby would become a tropical depression that evening, and then a tropical storm on Saturday afternoon on August 3rd as it exited the northwest coast of Cuba. Debby would remain a tropical storm for most of its life as it lifted north into the eastern Gulf of Mexico and moved towards the Apalachee Bay. Debby strengthened into a category 1 hurricane less than 12 hours before landfall with the 11 pm ET August 4th advisory. After Debby made landfall Monday morning near Steinhatchee, Florida around 7am ET on August 5, its forward motion would slow and it was during this period that most of the significant impacts from storm surge and flooding rains were felt. Debby would continue to move northeast across the eastern Florida Big Bend and into southeast Georgia into Tuesday taking most of the impacts away from the forecast area. While the winds and rain had moved on by Tuesday, a new impact was developing as the heavy rains across the southeast Big Bend, north Florida, and southern Georgia began to work their way through the river/aquifer system.
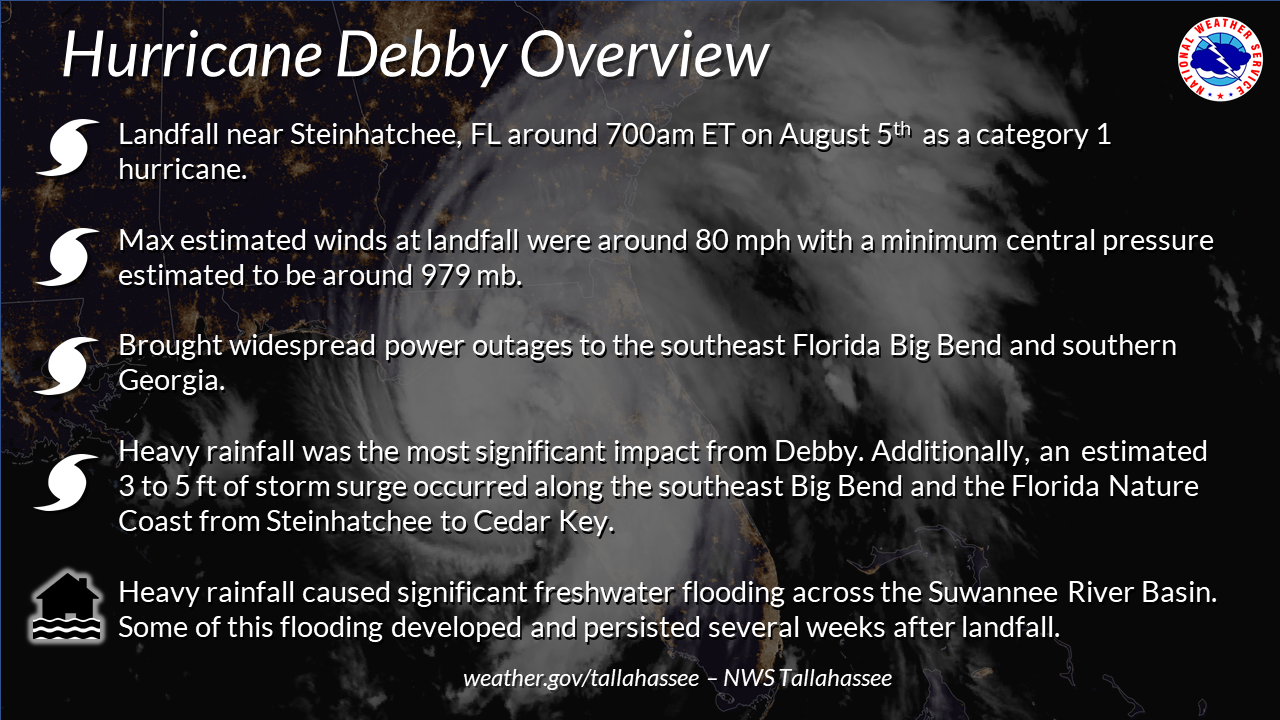
Hurricane Debby's primary impact across the forecast area was flooding due to heavy rainfall, but notable storm surge of 3 to 5 feet above normally dry ground across portions of the Nature Coast and the southeast Big Bend still brought damage to the immediate coastline where many are still recovering from Hurricane Idalia which came ashore less than one year prior. Rainfall amounts of 8 to 12 inches across the heaviest hit regions caused widespread flooding in southeast Madison and eastern Lafayette counties with even more significant flooding just east of our forecast area in NWS Jacksonville's forecast area across Suwannee and Gilchrist counties. In these areas, rainfall amounts approaching 15" were observed. Areal flooding continued for at least 2 weeks post landfall across southeast Madison county as high ground water levels and the heavy rainfall totals put pressure on the groundwater system. It was here in southeast Madison county that the pressure on the groundwater system caused new flooding to develop and persist for several weeks as water was coming up from the ground. Riverine flooding along the Suwannee River continued up to 3 weeks after landfall.
 |
| Figure 2. Satellite Loop of Hurricane Debby from NOAA/CIRA on August 5th |
Rainfall Amounts
Debby brought widespread rainfall amounts of 2 to 7 inches across portions of the Florida Big Bend and southern Georgia with even higher amounts of 7 to 12 inches observed across the southeast Big Bend and the Suwannee River Basin. The rainfall gradient for Debby was much sharper than most typical tropical systems. The primary reason the gradient was so sharp across the forecast area was due to the sheared nature of the system. Westerly shear around 10 to 15 knots, and much drier air on the western periphery of Debby caused much of the rainfall and impacts wind wise to be on the eastern side of the circulation as seen in the animation just after landfall (Fig 2 above).
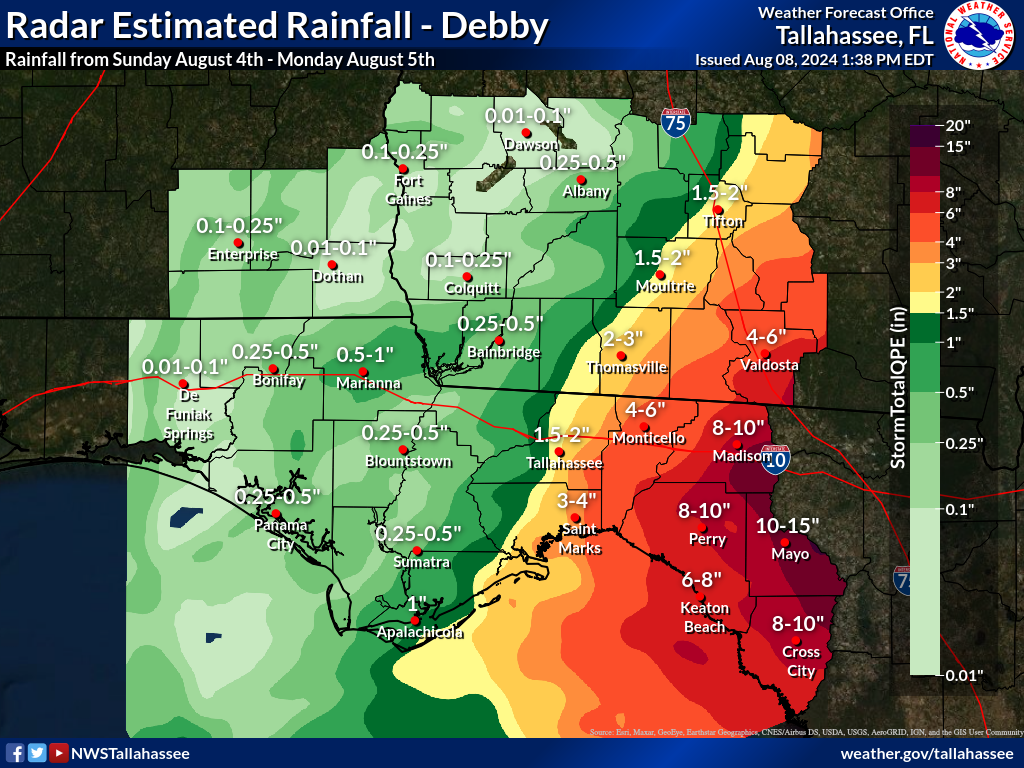 |
| Figure 3: Radar estimated rainfall amounts during Hurricane Debby |
Wind Gusts
Wind gusts were not nearly as strong as what many folks in this area observed one year prior during Hurricane Idalia. Regardless, widespread wind gusts nearing 70 mph were observed/estimated to have occurred across much of Dixie and Lafayette counties in the southeast Florida Big Bend. Elsewhere across the forecast area, widespread 30 to 50 mph wind gusts were observed. Much of these strong wind gusts occurred early Monday morning and into the early afternoon. These gusts were strong enough to cause widespread power outages across the southeast Big Bend
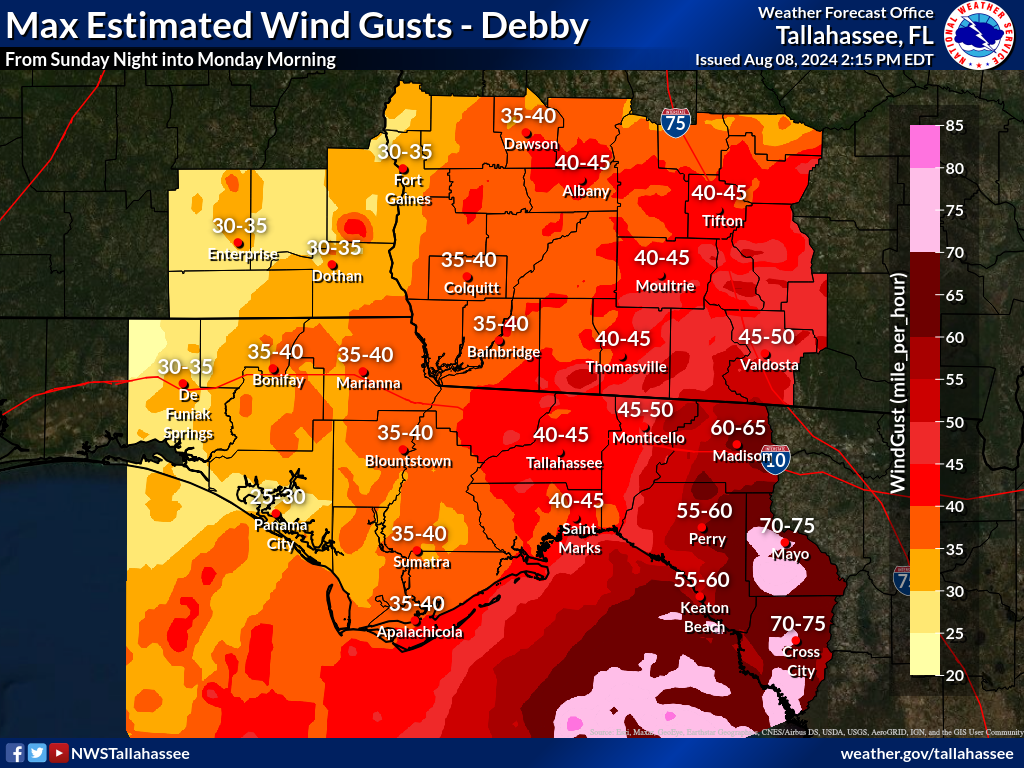 |
| Figure 4: Hurricane Debby max estimated wind gusts |
| Site Name | City | State | Land or Marine | Observing Network | Max Gust (knots) | Direction of Max Gust (deg) | Max Gust Time (UTC) | Max Gust - Day |
|---|---|---|---|---|---|---|---|---|
| "Shell Point, FL" | Crawfordville | FL | M | USF COMPS | 43 | 20 | 800 | 8/5/2024 |
| West Tampa Bouy 42036 | FL | M | NDBC | 53 | 40 | 150 | 8/5/2024 | |
| Tallahassee International Airport | Tallahassee | FL | L | ASOS | 42 | 340 | 1522 | 8/5/2024 |
| Apalachicola Regional Airport | Apalachicola | FL | L | ASOS | 37 | 340 | 1743 | 8/5/2024 |
| Southwest Georgia Regional Airport | Albany | GA | L | ASOS | 37 | 40 | 1759 | 8/5/2024 |
| Perry-Foley Airport | Perry | FL | L | AWOS | 54 | 30 | 1035 | 8/5/2024 |
| Valdosta Regional Airport | Valdosta | GA | L | ASOS | 50 | 70 | 1339 | 8/5/2024 |
| Moody Air Force Base | Valdosta | GA | L | ASOS | 43 | 30 | 2059 | 8/5/2024 |
| Tifton Henry Tift Myers Airport | Tifton | GA | L | AWOS | 34 | 360 | 1921 | 8/5/2024 |
| Fitzgerald Municipal Airport | Fitzgerald | GA | L | AWOS | 31 | 20 | 2315 | 8/5/2024 |
| St. George Island WeatherFlow | Eastpoint | FL | L | WeatherFlow | 37 | 2034 | 8/4/2024 | |
| Lafayette High School | Mayo | FL | L | WeatherSTEM | 61 | 100 | 1351 | 8/5/2024 |
| Madison County High School | Madison | FL | L | WeatherSTEM | 56 | 20 | 1247 | 8/5/2024 |
| Lowndes County Utilities Grassy Pond | Lake Park | GA | L | WeatherSTEM | 52 | 10 | 1400 | 8/5/2024 |
| Madison Creative Ars Academy | Madison | FL | L | WeatherSTEM | 47 | 30 | 1244 | 8/5/2024 |
| FSWN Wakulla St. Mark's Lighthouse | St. Mark's | FL | L | WeatherSTEM | 43 | 18 | 1012 | 8/5/2024 |
| Historic Downtown Monticello | Monticello | FL | L | WeatherSTEM | 43 | 336 | 1307 | 8/5/2024 |
| FSWN Old Town Elementary School | Old Town | FL | L | WeatherSTEM | 43 | 128 | 1200 | 8/5/2024 |
| Florida A&M University | Tallahassee | FL | L | WeatherSTEM | 41 | 285 | 1346 | 8/5/2024 |
| Northeast Tallahassee | Tallahassee | FL | L | WeatherSTEM | 42 | 338 | 1200 | 8/5/2024 |
| Lowndes County Utilities Kinderlou | Kinderlou | GA | L | WeatherSTEM | 40 | 44 | 1323 | 8/5/2024 |
| FSWN Dixie County Manager's Office | Cross City | FL | L | WeatherSTEM | 41 | 203 | 1140 | 8/5/2024 |
| Dixie County High School | Cross City | FL | L | WeatherSTEM | 49 | 160 | 1005 | 8/5/2024 |
| Montford Middle | Tallahassee | FL | L | WeatherSTEM | 34 | 26 | 1354 | 8/5/2024 |
| Ballard Partners | Tallahassee | FL | L | WeatherSTEM | 36 | 321 | 930 | 8/5/2024 |
| FSU WeatherSTEM | Tallahassee | FL | L | WeatherSTEM | 40 | 343 | 1336 | 8/5/2024 |
| FSWN Ochlockonee Boat Ramp | Bald Point | FL | L | WeatherSTEM | 38 | 291 | 1200 | 8/5/2024 |
| Moultrie | Moultrie | GA | L | UGA Mesonet | 38 | 8/5/2024 | ||
| Ben Hill County Emergency Management | Fitzgerald | GA | L | WeatherSTEM | 34 | 23 | 47 | 8/6/2024 |
| St. George Island Bridge | Eastpoint | FL | L | WeatherSTEM | 37 | 360 | 1756 | 8/5/2024 |
| Wakulla High School | Crawfordville | FL | L | WeatherSTEM | 33 | 98 | 1132 | 8/5/2024 |
| FSWN Lake Jackson | Tallahassee | FL | L | WeatherSTEM | 36 | 344 | 1450 | 8/5/2024 |
| FSWN Franklin County EOC | Apalachicola | FL | L | WeatherSTEM | 40 | 309 | 1509 | 8/5/2024 |
| FSWN Dixie County EOC | Cross City | FL | L | WeatherSTEM | 47 | 153 | 1126 | 8/5/2024 |
| FSWN Franklin Alligator Point | Alligator Point | FL | L | WeatherSTEM | 43 | 334 | 2051 | 8/5/2024 |
| FSWN Madison County EOC | Madison | FL | L | WeatherSTEM | 42 | 360 | 1038 | 8/5/2024 |
| FSU Rec SportsPlex | Tallahassee | FL | L | WeatherSTEM | 35 | 97 | 1417 | 8/5/2024 |
| Chiles High School | Tallahassee | FL | L | WeatherSTEM | 34 | 40 | 1329 | 8/5/2024 |
| Jefferson County Middle/High School | Monticello | FL | L | WeatherSTEM | 34 | 109 | 1448 | 8/5/2024 |
| Table 1. Hurricane Debby max estimated wind gusts. Note: These come from a variety of sensors, a majority not operated/maintained by NWS. Averaging periods and the siting of stations can vary. Please view the Debby Tropical PSH for more information. |
Storm Surge
Debby brought storm surge inundation of approximately 3 to 5 feet above normally dry ground to portions of the southeast Florida Big Bend. These values brought widespread flooding to the immediate coastal strip and unfortunately flooded some homes/businesses that were affected by Idalia less than one year earlier. While these amounts did not cause damage as widespread/severe as Idalia, this storm served as another reminder that the Apalachee Bay and Nature Coast of Florida is one of the most surge prone areas of the country.
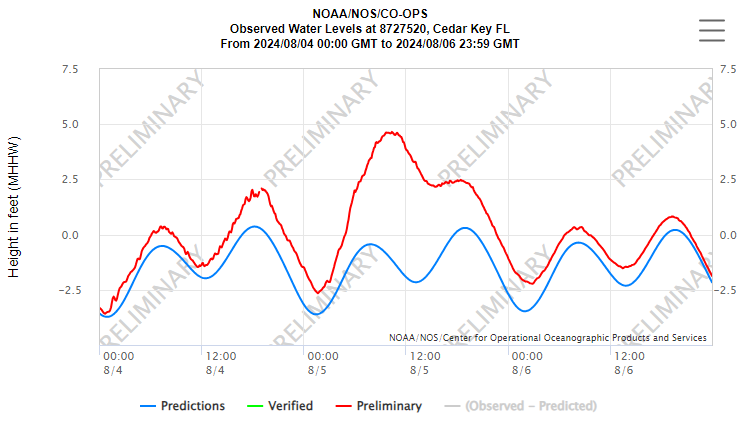 |
| Figure 5. Graphic showing the peak surge of Debby at Cedar Key (just south of our forecast area in NWS Tampa's Area of Responsibility. Graphic used to show the large tidal variations across this part of the Gulf and the timing of Debby's surge. |
| Site Name | Latitude | Longitude | City | State | Max Water Level (ft) | Datum | Time (UTC) | Day Watermark Observed (* = Date Retrieved) | Source | Comment (I = incomplete data; E = estimated) |
|---|---|---|---|---|---|---|---|---|---|---|
| Steinhatchee River at Steinhatchee | 29.6681 | -83.3775 | Steinhatchee | FL | 3.7 | MHHW | 1615 | 8/5/2024 | USGS | |
| Suwannee River above Gopher River Confluence | 29.3392 | -83.0867 | Suwannee | FL | 3.5 | MHHW | 1200 | 8/5/2024 | USGS | "I, data stopped before peak" |
| 571 SE 205 St | 29.3228 | -83.1459 | Suwannee | FL | 2.5 | AGL | 1736 | 8/6/2024* | FDEM | |
| 37 SE 217th St | 29.3278 | -83.1463 | Suwannee | FL | 1.7 | AGL | 1751 | 8/6/2024* | FDEM | |
| 16 SE 252nd St | 29.3368 | -83.1359 | Suwannee | FL | 2.5 | AGL | 1540 | 8/6/2024* | FDEM | |
| 222 SE 240th St | 29.3392 | -83.1366 | Suwannee | FL | 2.8 | AGL | 1835 | 8/6/2024* | FDEM | |
| 283 SE 240th St | 29.3401 | -83.1364 | Suwannee | FL | 1.7 | AGL | 1831 | 8/6/2024* | FDEM | |
| 189 SE 867th Ave | 29.3401 | -83.1384 | Suwannee | FL | 2 | AGL | 1631 | 8/6/2024* | FDEM | |
| 30 SE 234th St | 29.3408 | -83.1382 | Suwannee | FL | 2.5 | AGL | 1627 | 8/6/2024* | FDEM | |
| 11072 SE 357 Hwy | 29.3939 | -83.2022 | Shired Island | FL | 2.2 | AGL | 11 | 8/7/2024* | FDEM | |
| 133 10th Ave W | 29.4383 | -83.2924 | Horseshoe Beach | FL | 1.8 | AGL | 2323 | 8/6/2024* | FDEM | |
| 199 7th Ave W | 29.4401 | -83.291 | Horseshoe Beach | FL | 2.4 | AGL | 2340 | 8/6/2024* | FDEM | |
| 88 8th Ave E | 29.4396 | -83.2864 | Horseshoe Beach | FL | 2.8 | AGL | 2347 | 8/6/2024* | FDEM | |
| 48 6th Ave E | 29.4407 | -83.2867 | Horseshoe Beach | FL | 3 | AGL | 2356 | 8/6/2024* | FDEM | |
| 111 2nd Ave W | 29.4435 | -83.2885 | Horseshoe Beach | FL | 3.1 | AGL | 2343 | 8/6/2024* | FDEM | |
| SW 351 Hwy | 29.4442 | -83.2869 | Horseshoe Beach | FL | 1.2 | AGL | 9 | 8/7/2024* | FDEM | |
| 88 1st St | 29.4427 | -83.2856 | Horseshoe Beach | FL | 1.6 | AGL | 3 | 8/7/2024* | FDEM | |
| 182 5th Ave E | 29.4413 | -83.2844 | Horseshoe Beach | FL | 2.8 | AGL | 0 | 8/7/2024* | FDEM | |
| 139 SW 464th Ave | 29.5953 | -83.3796 | Rocky Creek | FL | 1.3 | AGL | 1919 | 8/7/2024* | FDEM | |
| 79 SW 464th Ave | 29.5942 | -83.3794 | Rocky Creek | FL | 1.1 | AGL | 1943 | 8/7/2024* | FDEM | |
| 240 SW 470th Ave | 29.5937 | -83.3808 | Rocky Creek | FL | 1 | AGL | 1946 | 8/7/2024* | FDEM | |
| 112 SW 276th Ave | 29.6682 | -83.3901 | Jena | FL | 1.6 | AGL | 1949 | 8/7/2024* | FDEM | |
| 86 SW 911th St | 29.6676 | -83.3893 | Jena | FL | 2.7 | AGL | 1954 | 8/7/2024* | FDEM | |
| 315-399 Peninsula Rd SE | 29.6689 | -83.3655 | Steinhatchee | FL | 1.9 | AGL | 2009 | 8/7/2024* | FDEM | |
| 318 Granger Rd SE | 29.6684 | -83.3641 | Steinhatchee | FL | 1.1 | AGL | 2007 | 8/7/2024* | FDEM | |
| 19040 Goodtime Dr. | 29.8488 | -83.619 | Dekle Beach | FL | 1 | AGL | 1935 | 8/7/2024* | FDEM | |
| 19060 Goodtime Dr. | 29.8486 | -83.6188 | Dekle Beach | FL | 1.3 | AGL | 1947 | 8/7/2024* | FDEM |
| Table 2. Water levels across the Florida Big Bend during Debby for the NWS Tallahassee Forecast Area. Thank you to the Florida Department of Emergency Management (FDEM) for providing survey and high watermark data which is used to measure storm surge inundation. More information on water levels can be found in the Debby PSH. |
River Levels
Widespread heavy heavy rain across the Suwannee, Withlacoochee, Fenholloway, and Aucilla River Basins from Debby brought widespread river flooding to the forecast area. However, more significant flooding, on the riverine front, was likely avoided across our rivers due to the sheared nature of Debby and the antecedent dry conditions in place across the southeast Florida Big Bend before Debby arrived.
.jpeg) |
.jpeg) |
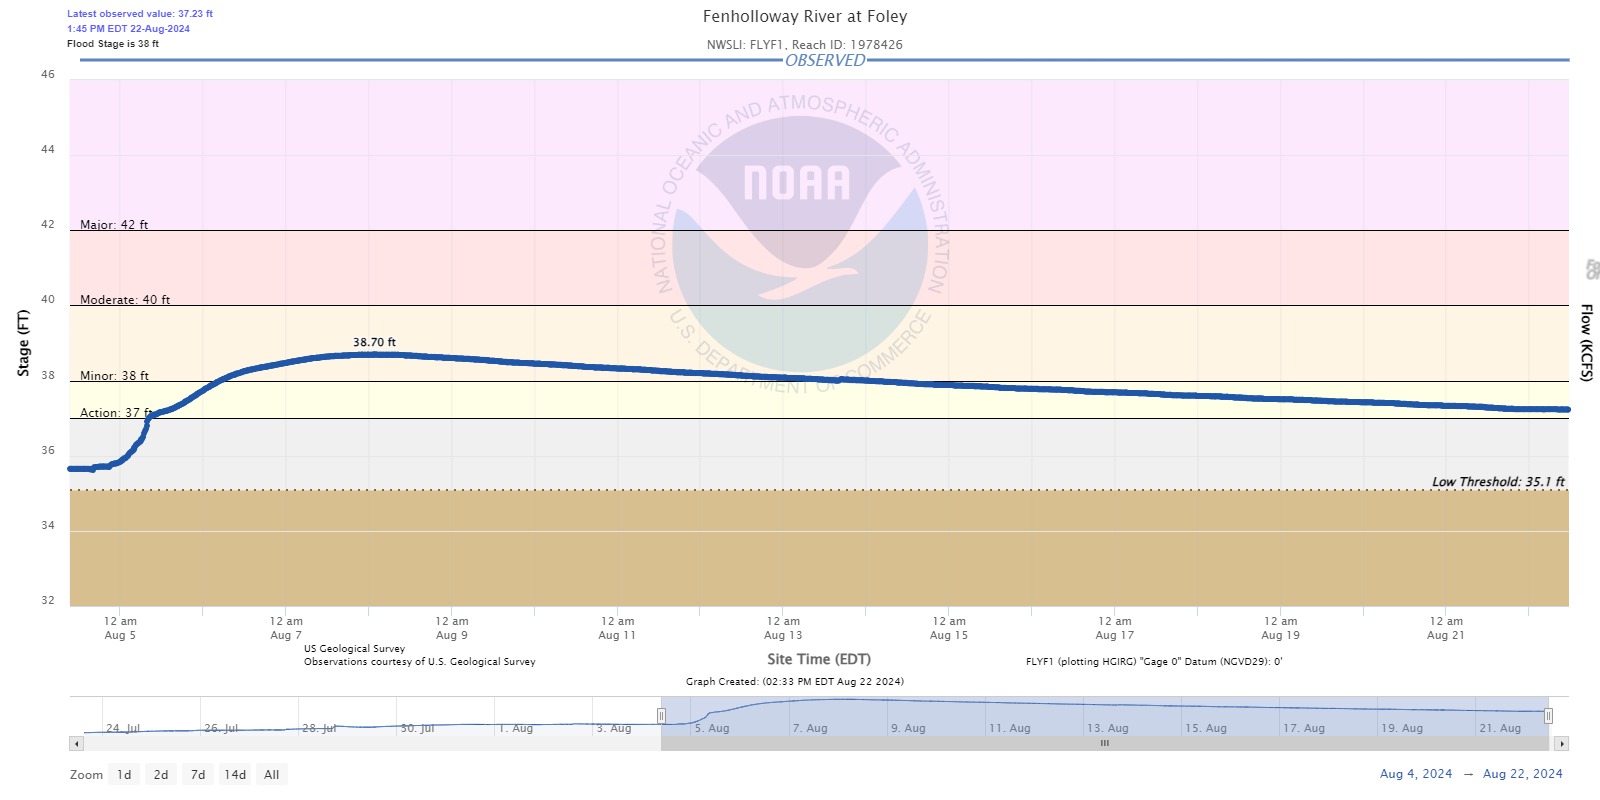 |
| Figure 6. Suwannee River above Gopher River Confluence (in MHHW) | Figure 7. Steinhatchee River at Steinhatchee (in MHHW) | Figure 8. Fenholloway River at Foley |
.jpeg) |
.jpeg) |
.jpeg) |
| Figure 9. Suwannee River at Rock Bluff near Bell - CR 340 (in NAVD88) | Figure 10. Suwannee River at Branford - US 27 (in NAVD88) | Figure 11. Suwannee River near Wilcox - US 19 (in NAVD88) |
.jpeg) |
.jpeg) |
|
| Figure 12. Aucilla River at Lamont (US 27) | Figure 13. Suwannee River at Luraville - SR 51 (in NAVD88) |
Impacts Summary
The impacts summary from our local counties is available by clicking here. The link provides summarized impacts from local county emergency management and other local officials. It is not a full summary of impacts and it is possible some realized impacts from Debby are not listed here or are missing. A quick summary of these impacts revealed widespread to numerous power outages across the southeast Florida Big Bend and into south-central Georgia. Many downed trees were reported across the southeast Florida Big Bend and into south-central Georgia. Unfortunately there were at least 2 direct fatalities from Debby (in our forecast area) due to trees falling on structures and 2 indirect fatalities due to traffic accidents. In addition to the power outages, widespread flooding occurred across the southeast portions of the forecast area in Madison, Lafayette, and Dixie counties. One of the more damaging aspects of Debby was long term flooding that developed across southeast Madison county. In these areas, high ground water levels combined with the slow movement of water towards southeast parts of the county caused new areas of flooding as the water was moving into areas that already had been affected by extremely heavy rains. Additionally, higher water levels caused water to come up from scattered sinkholes in portions of the county inducing new flooded areas. Riverine flooding, though within the minor flood category on portions of the Middle and Lower Suwannee River, persisted for up to 3 weeks, inundating or isolating residential areas immediately adjacent to the river from near Branford, FL southward to Manatee Springs, FL.
 |
| Figure 11. Debby about one to two hours after landfall as flooding rains overspread the region |
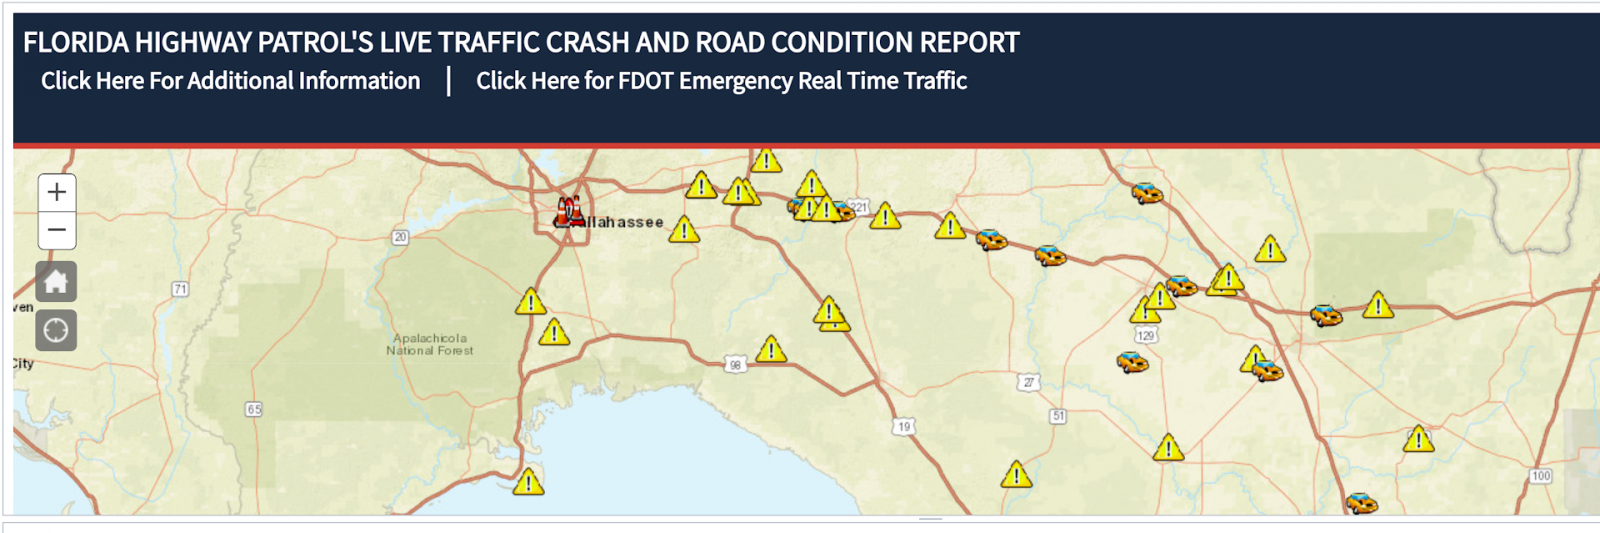 |
| Figure 12. Widespread down trees caused several road closes and incidents during landfall. Many segments of I-10 between Tallahassee and Lake City were closed due to fallen trees blocking interstate traffic. |
Storm Photos
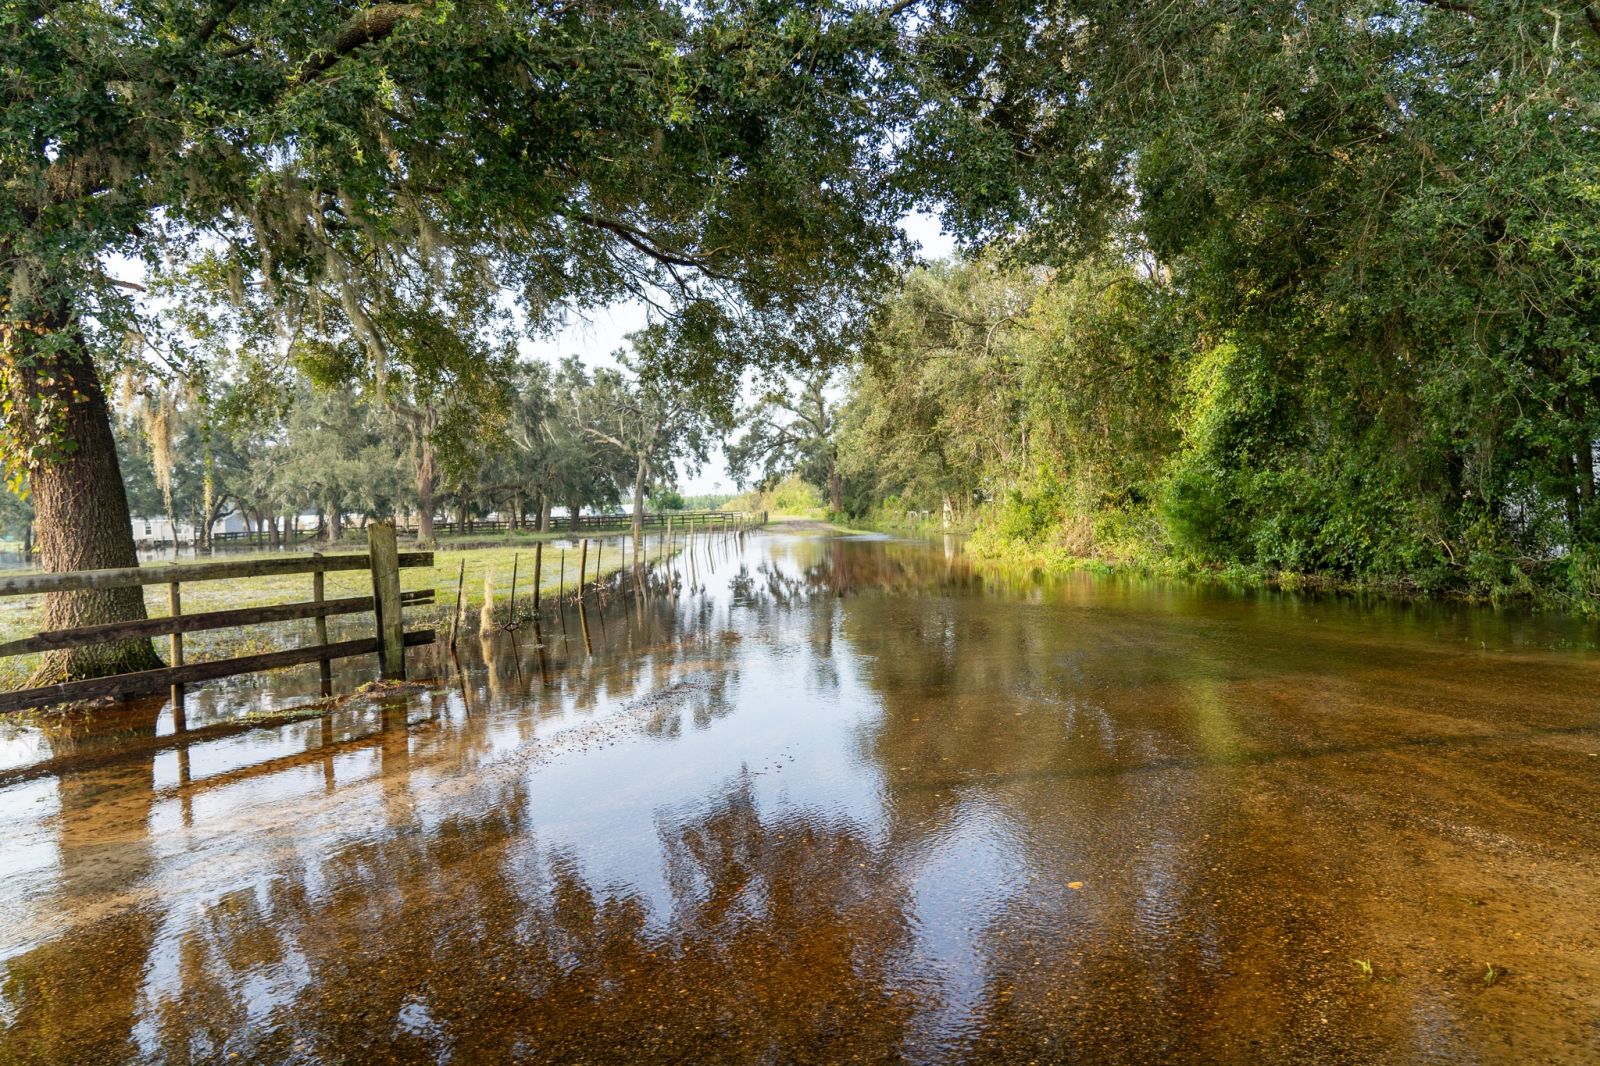
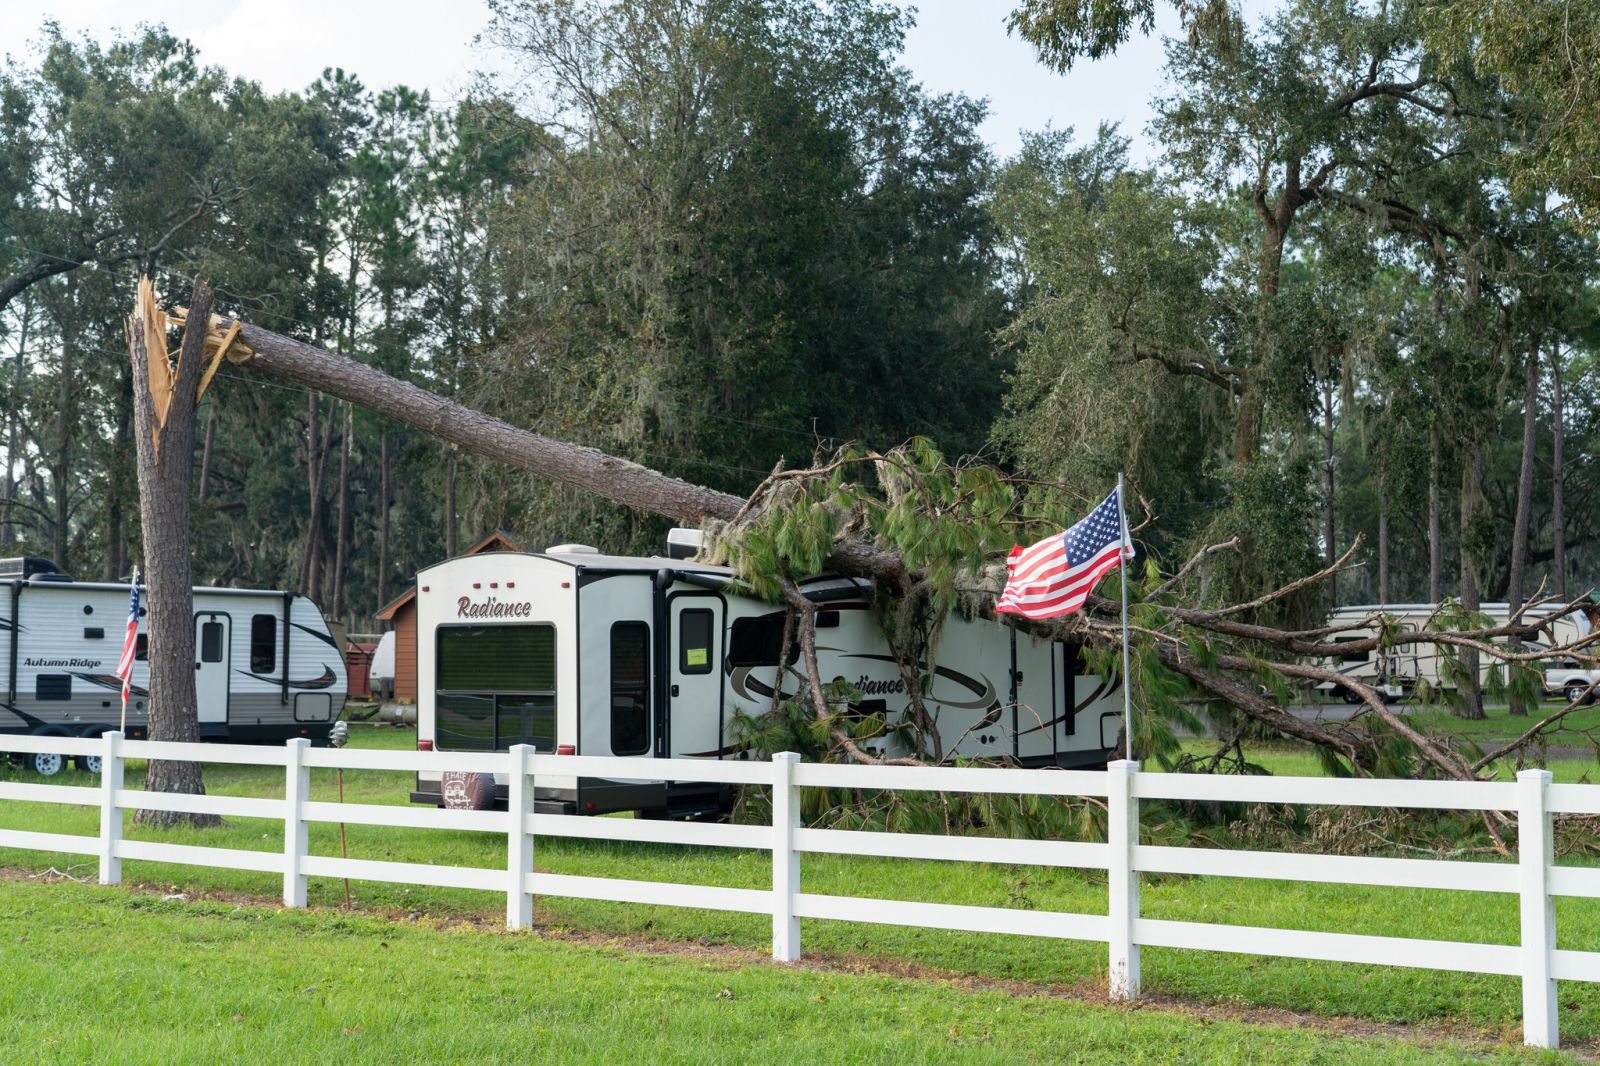
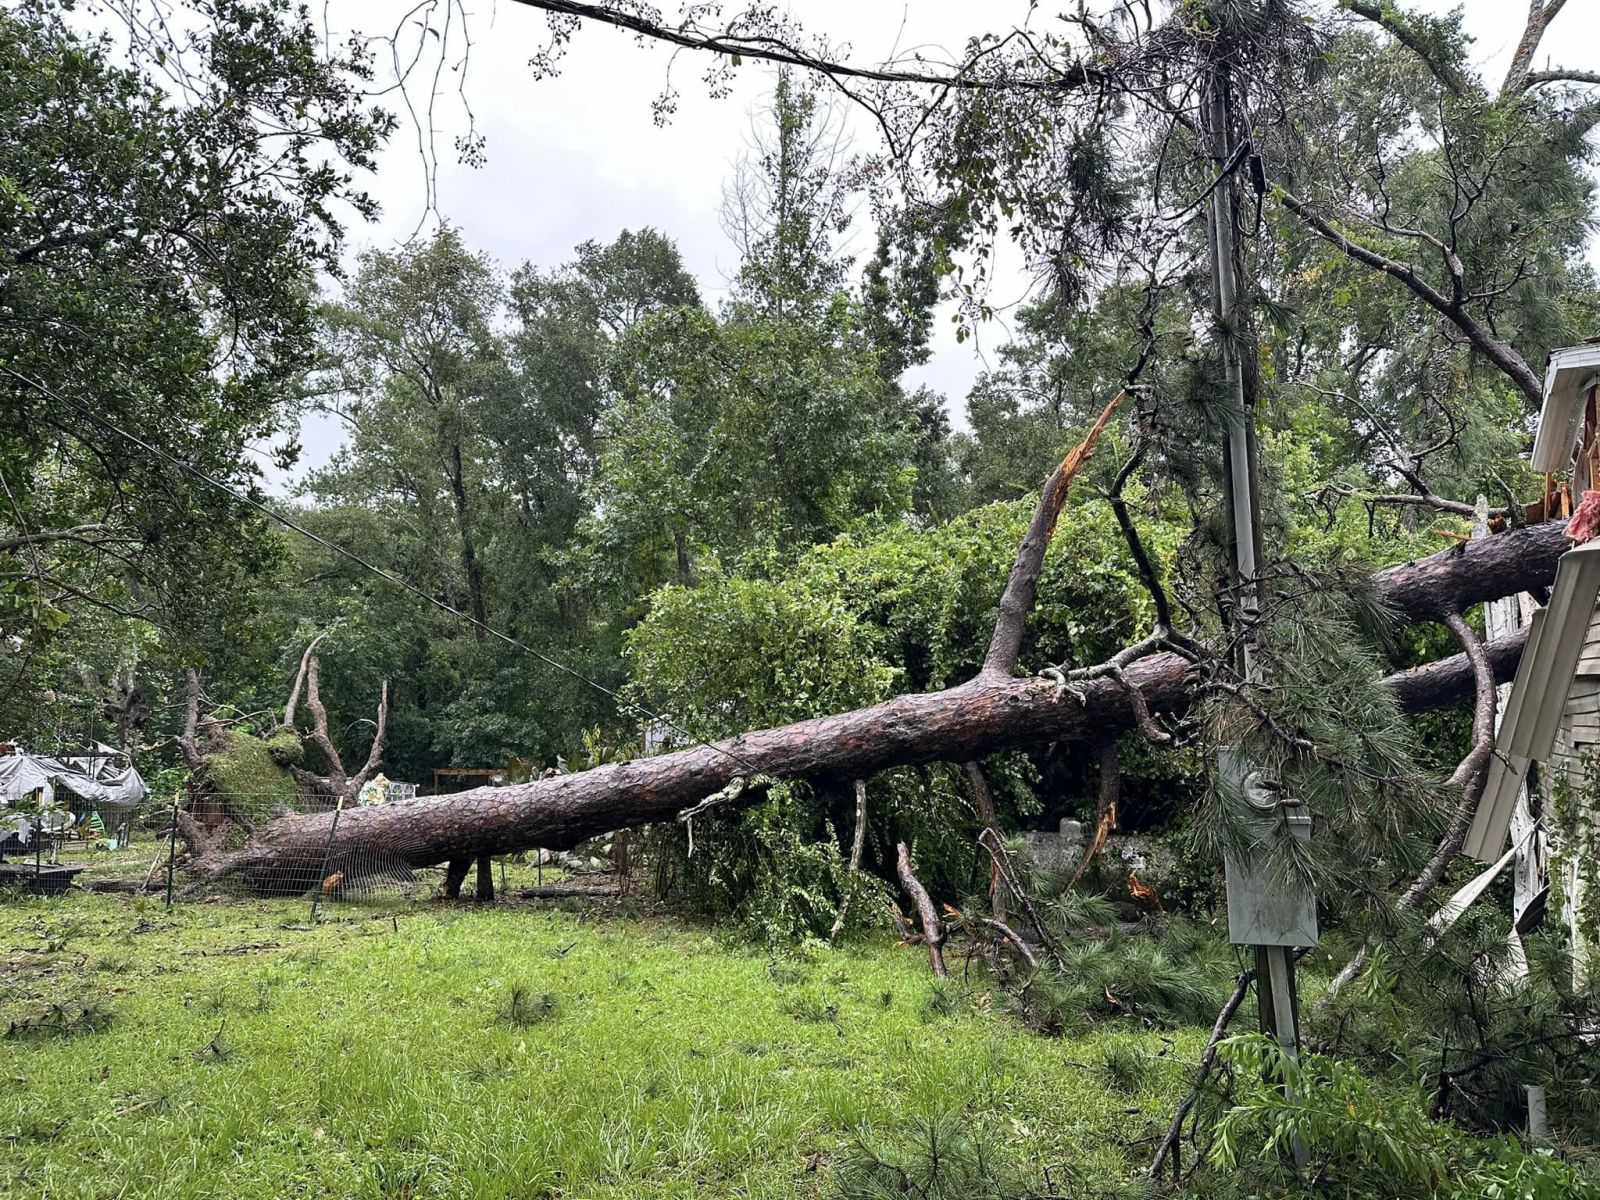
Various photos from around the forecast area due to Debby. These photos do not encompass all of the impacts and damages from Debby.
 |
 |
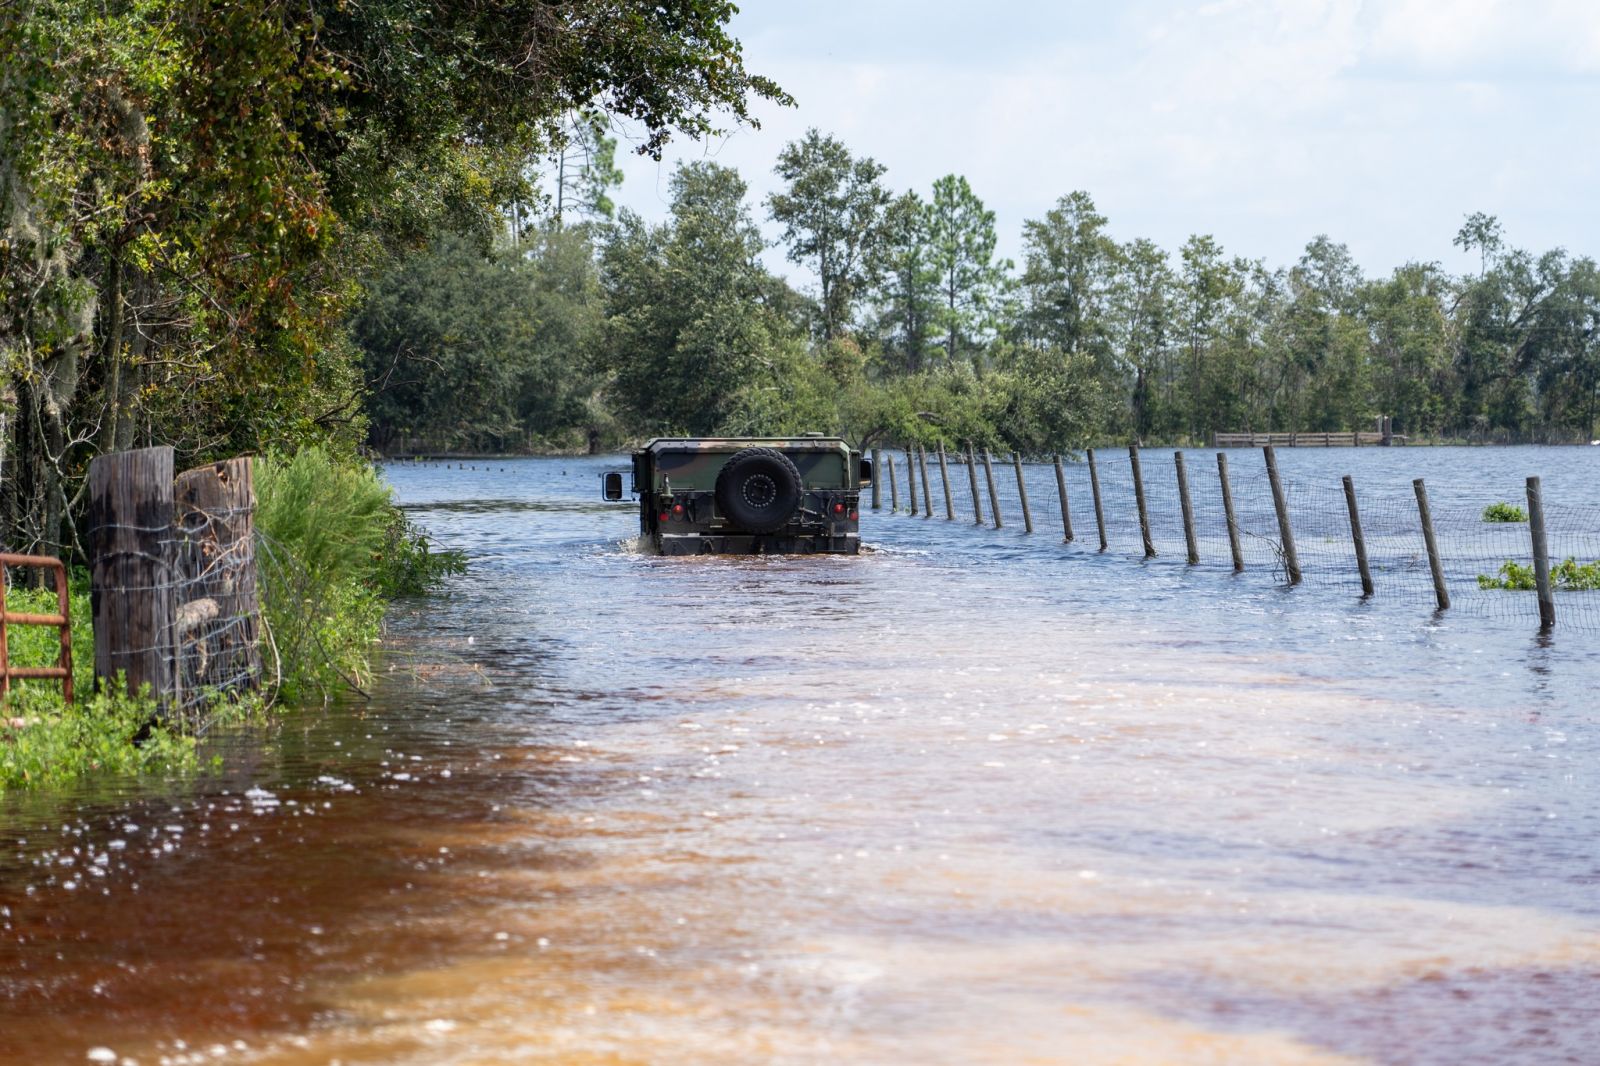 |
| Figure 13. Extensive flooding in Madison County well after landfall | Figure 14. Extensive flooding in Madison County well after landfall) | Figure 15. Extensive flooding in Madison County well after landfall |
 |
 |
|
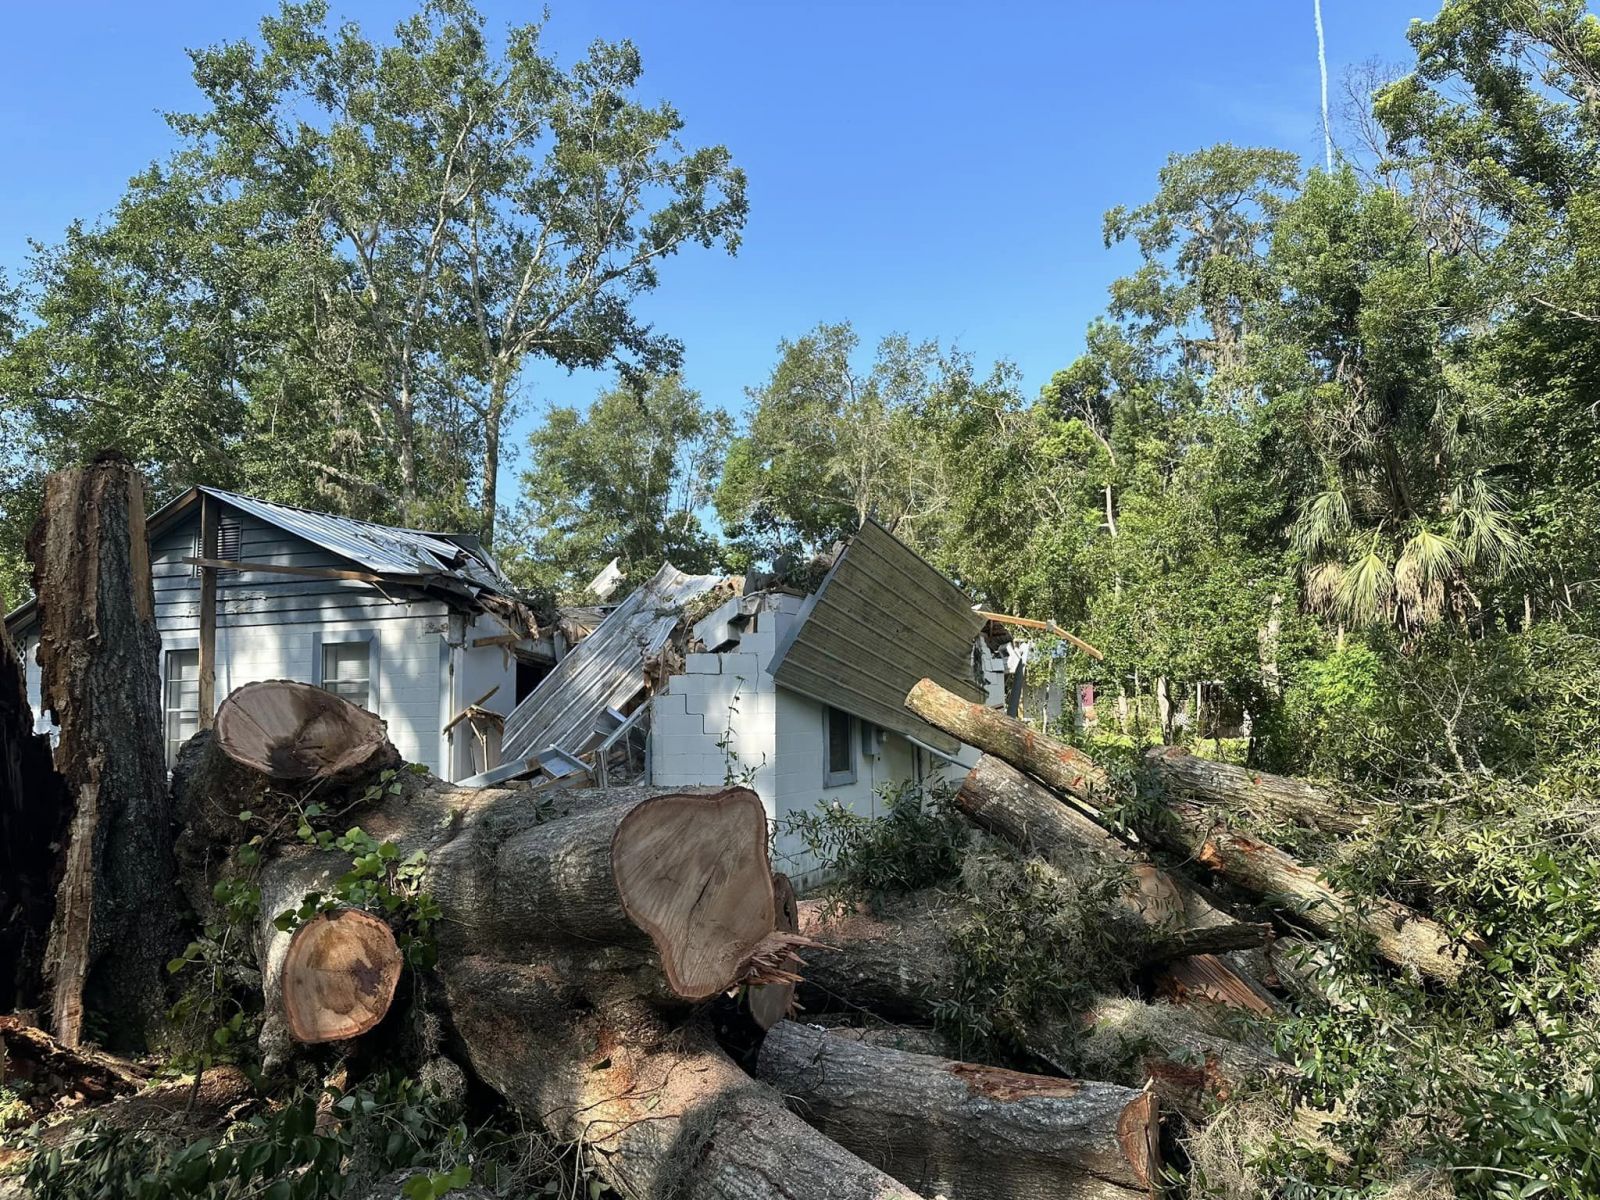
| Figure 16. Tree Damage in Jefferson County | Figure 17. Tree Damage in Jefferson County | |
|
Photo Credits: Madison County Emergency Management and Jefferson County Sheriff's Office |
||
A more thorough survey of Debby's forecast history and impacts across a broader region will be available by viewing the National Hurricane Center's Tropical Cyclone Report. These are typically completed several months after a storm has made landfall. It will be available at this link when it's completed.

