| Rain Amount Potential
Experimental - Leave feedback
|
|
Expected Liquid Precip - Official NWS Forecast
 |
High End Amount 1 in 10 Chance (10%) of More Rain  What's this? |
| Low End Amount 9 in 10 Chance (90%) of More Rain  What's this? |
|
Low End Amount - 9 in 10 Chance (90%) of More RainThis graphic depicts a reasonable lower-end liquid amount for the time period shown on the graphic, based on many computer model simulations of possible liquid totals. This lower amount is an unlikely scenario with a 9 in 10, or 90% chance that more liquid will fall, and only a 1 in 10, or 10% chance that less liquid will fall. This number can help serve as a lower-end scenario for planning purposes. Expected Rain - Official NWS ForecastThis graphic is the official NWS liquid precipitation forecast in inches during the time period shown on the graphic. This liquid precipitation amount is determined by NWS forecasters to be the most likely outcome based on evaluation of data from computer models, satellite, radar, and other observations. High End Amount - Only a 1 in 10 Chance (10%) of More RainThis graphic depicts a reasonable upper-end liquid amount for the time period shown on the graphic, based on many computer model simulations of possible liquid totals. This higher amount is an unlikely scenario, with only a 1 in 10, or 10% chance that more liquid will fall, and a 9 in 10, or 90% chance that less liquid will fall. This number can help serve as an upper-end scenario for planning purposes. |
|
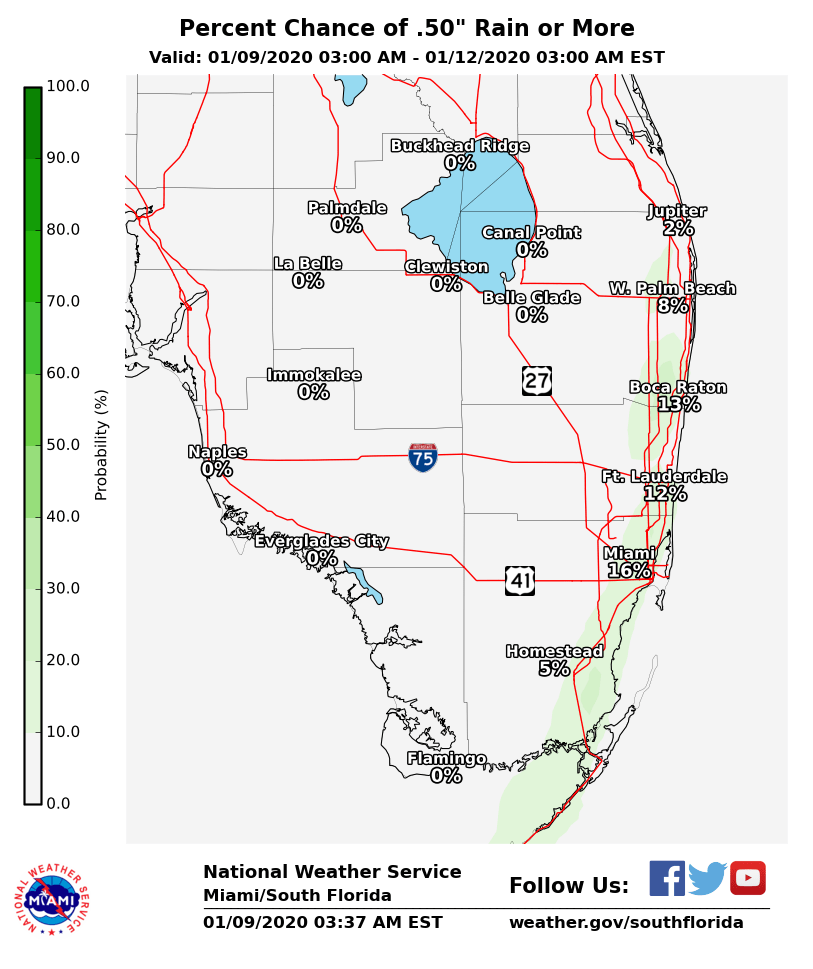
| Percent Chance That Rain Amounts Will Be Greater Than...
Experimental - Leave feedback
This series of graphics shows the probability (that is, the likelihood) that liquid precipitation will equal or exceed specific amounts during the time period shown on the graphic. These forecasts are based on many computer model simulations of possible liquid precipitation totals. Percent Chance That Rain Amounts Will Be Greater ThanThis series of graphics shows the probability (that is, the likelihood) that liquid precipitation will equal or exceed specific amounts during the time period shown on the graphic. These forecasts are based on many computer model simulations of possible liquid precipitation totals. |
|||||||||||||||||
|
Hover over thumbnails below to view larger image.
|
|||||||||||||||||
| MFL Rain Totals by Location
Experimental - Leave feedback
Rain Totals by LocationThese tables show the liquid precipitation forecast for individual locations. The tables provide the same information as the maps on this web page, just shown in a different way. The "Exceedance" option shows the chance that liquid will exceed a certain threshold. The "Range" option shows the likelihood of liquid precipitation being within a certain range. All of these values are valid for the same time period as depicted on the graphics. |
|
|
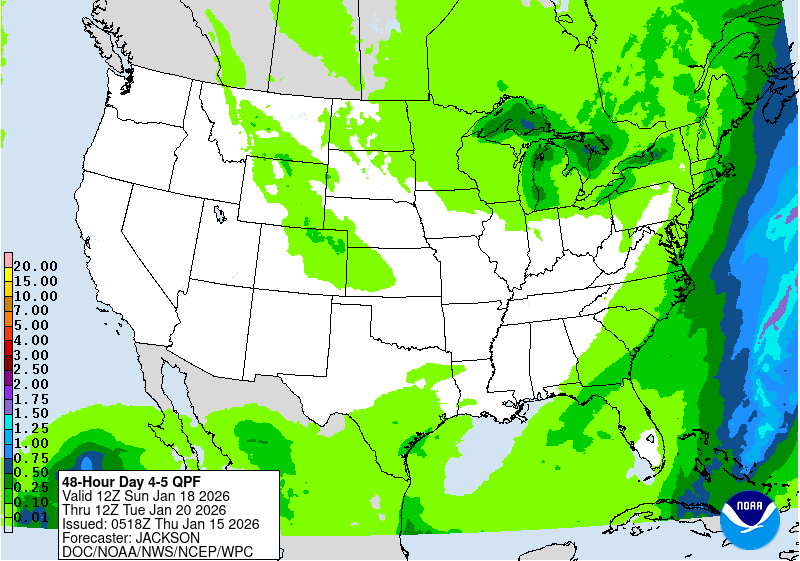
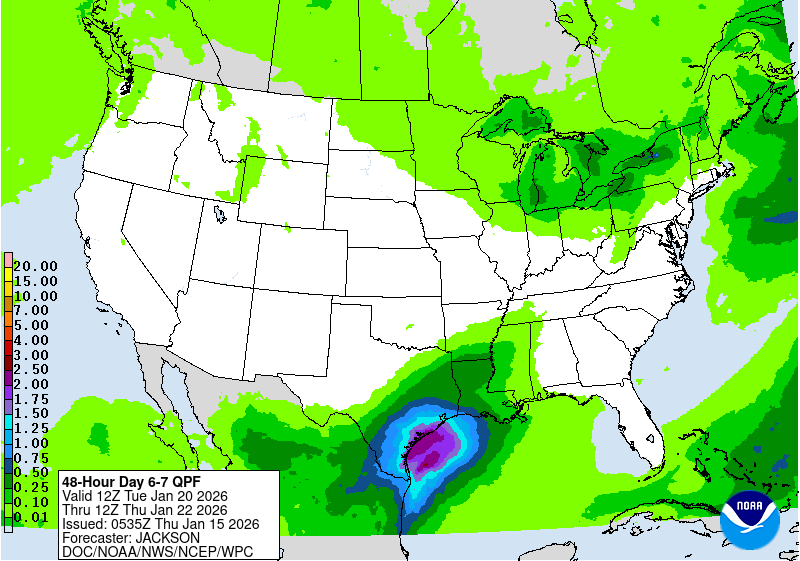
| Long-Range Forecast | |
| Days 4-5 Forecast Precipitation | Days 6-7 Forecast Precipitation |
 |
 |
|
Days 6-10 |
|
| Temperature | Precipitation |
 |
 |
|
Days 8-14 |
|
| TEMPERATURE | PRECIPITATION |
 |
 |
|
Week 3-4 |
|
|
TEMPERATURE |
PRECIPITATION |
 |
 |