Miami - South Florida
Weather Forecast Office
 |
| These graphics are updated once per day, shortly after 4 AM and 4 PM Eastern Time. They can be magnified (enlarged) by left clicking on them, and resized back to original size with a second click. |
South Florida's Expected Wind Chills Tonight
|
Please see county-specific tabs above for additional graphics.
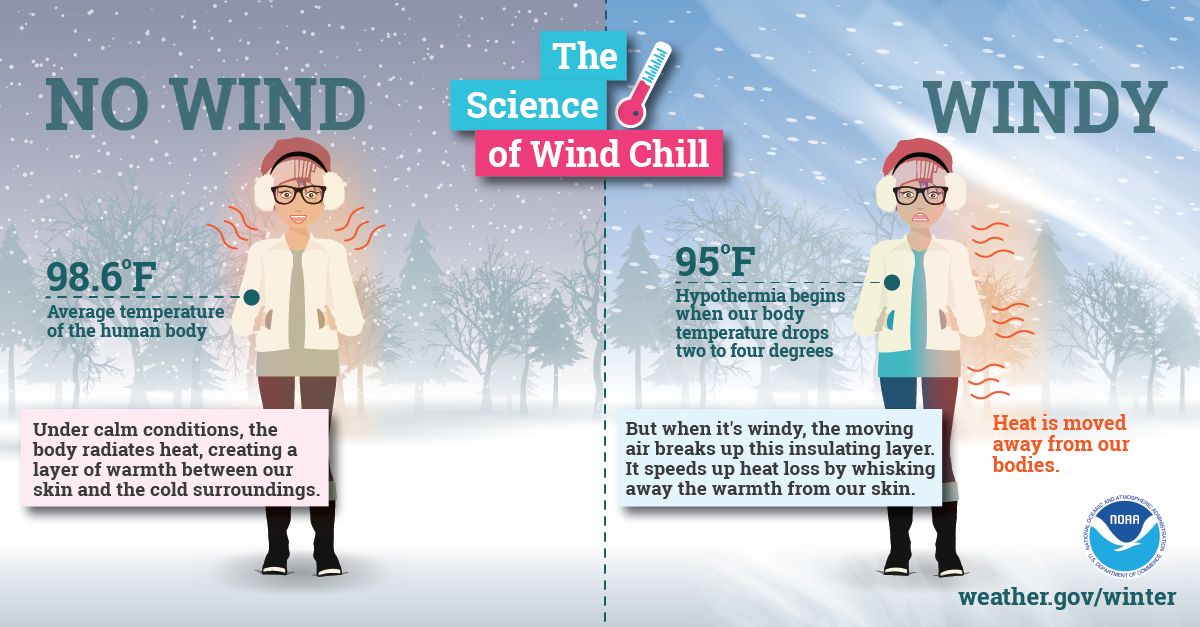
What is 'Wind Chill' or 'Apparent Temperature'? Wind Chill is a term used to describe what the air temperature feels like to the human skin due to the combination of cold temperatures and winds blowing on exposed skin. In simple terms, the colder the air temperature and the higher the wind speeds the colder it will feel on your skin if you're outside. So even if it remains the same temperature, but the wind speed increases it will actually feel colder to your skin. So why does it feel colder if the wind speed increases but the temperature remains the same? The reason is because as wind blows across our bodies it takes the heat we naturally emit and blows it away from our bodies. The faster the wind speed the faster our body heat is taken away and the colder it feels. It is a similar process for when you blow on a hot bowl of soup to cool it down. The temperature that it feels like outside due to the air temperature and wind speed is called the "Wind Chill."
|
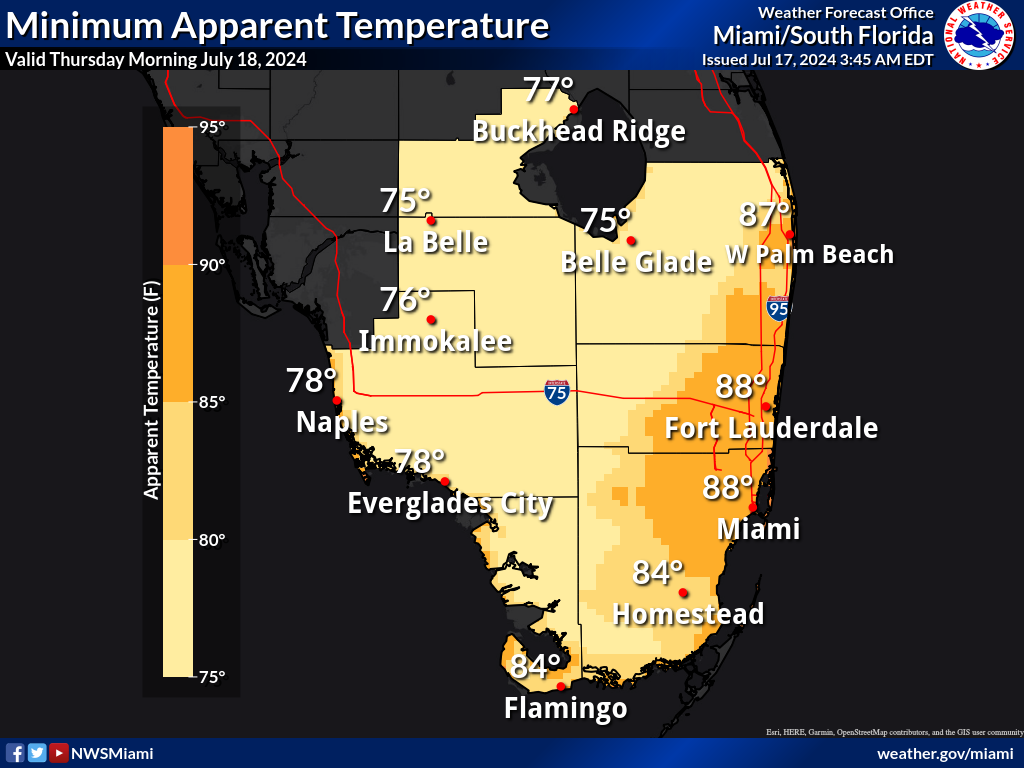
Expected Minimum Apparent Temperature (°F) for Miami-Dade County
These maps are the official NWS minimum apparent temperature forecast in degrees Fahrenheit during the time period shown on the graphic. These minimum apparent temperatures are determined by NWS forecasters to be the most likely outcome based on evaluation of data from computer models, satellite, radar, and other observations.
Night 1  |
Night 2  |
Night 3  |
Night 4  |
Night 5  |
Expected Minimum Apparent Temperature (°F) for Broward County
These maps are the official NWS minimum apparent temperature forecast in degrees Fahrenheit during the time period shown on the graphic. These minimum apparent temperatures are determined by NWS forecasters to be the most likely outcome based on evaluation of data from computer models, satellite, radar, and other observations.
Night 1  |
Night 2  |
Night 3  |
Night 4  |
Night 5  |
Expected Minimum Apparent Temperature (°F) for Palm Beach County
These maps are the official NWS minimum apparent temperature forecast in degrees Fahrenheit during the time period shown on the graphic. These minimum apparent temperatures are determined by NWS forecasters to be the most likely outcome based on evaluation of data from computer models, satellite, radar, and other observations.
Night 1  |
Night 2  |
Night 3  |
Night 4  |
Night 5  |
Expected Minimum Apparent Temperature (°F) for Collier County
These maps are the official NWS minimum apparent temperature forecast in degrees Fahrenheit during the time period shown on the graphic. These minimum apparent temperatures are determined by NWS forecasters to be the most likely outcome based on evaluation of data from computer models, satellite, radar, and other observations.
Night 1  |
Night 2  |
Night 3  |
Night 4  |
Night 5  |
Expected Minimum Apparent Temperature (°F) for Hendry County
These maps are the official NWS minimum apparent temperature forecast in degrees Fahrenheit during the time period shown on the graphic. These minimum apparent temperatures are determined by NWS forecasters to be the most likely outcome based on evaluation of data from computer models, satellite, radar, and other observations.
Night 1  |
Night 2  |
Night 3  |
Night 4  |
Night 5  |
Expected Minimum Apparent Temperature (°F) for Glades County
These maps are the official NWS minimum apparent temperature forecast in degrees Fahrenheit during the time period shown on the graphic. These minimum apparent temperatures are determined by NWS forecasters to be the most likely outcome based on evaluation of data from computer models, satellite, radar, and other observations.
Night 1 |
Night 2 |
Night 3 |
Night 4 |
Night 5 |
Expected 12 Hour Rainfall (in.)
These maps are the official NWS rainfall forecast in inches during the time period shown on the graphic. These rainfall amounts are determined by NWS forecasters to be the most likely outcome based on evaluation of data from computer models, satellite, radar, and other observations.
Day 1  |
Night 1  |
Day 2  |
Night 2  |
Day 3  |
Night 3  |
Day 4  |
Night 4  |
Day 5  |
Night 5  |
Day 6  |
Night 6  |
Day 7  |
Night 7  |
Greatest 12 Hour Possible Rainfall (in.)
These maps depict a reasonable upper-end rainfall amount for the time period shown on the graphic, based on many computer model simulations of possible rainfall totals. These higher amounts are an unlikely scenario, with only a 1 in 10, or 10% chance that more rain will fall, and a 9 in 10, or 90% chance that less rain will fall. These amounts can help serve as an upper-end scenario for planning purposes.
Day 1  |
Night 1  |
Day 2  |
Night 2  |
Day 3  |
Night 3  |
Day 4  |
Night 4  |
Day 5  |
Night 5  |
Day 6  |
Night 6  |
Day 7  |
Night 7  |
Least Possible 12 Hour Rainfall (in.)
These maps depict a reasonable lower-end rainfall amount for the time period shown on the graphic, based on many computer model simulations of possible rainfall totals. These lower amounts are an unlikely scenario, with a 9 in 10, or 90% chance that more rain will fall, and only a 1 in 10, or 10% chance that less rain will fall. These amounts can help serve as a lower-end scenario for planning purposes. On many occasions these graphics will be blank, which depicts that the low end is for no measurable rainfall.
Day 1  |
Night 1  |
Day 2  |
Night 2  |
Day 3  |
Night 3  |
Day 4  |
Night 4  |
Day 5  |
Night 5  |
Day 6  |
Night 6  |
Day 7  |
Night 7  |
Expected 24 Hour Rainfall (in.)
These maps are the official NWS rainfall forecast in inches during the time period shown on the graphic. These rainfall amounts are determined by NWS forecasters to be the most likely outcome based on evaluation of data from computer models, satellite, radar, and other observations.
Day 1  |
Day 2  |
Day 3  |
Day 4  |
Day 5  |
Day 6  |
Day 7  |
Greatest 24 Hour Possible Rainfall (in.)
These maps depict a reasonable upper-end rainfall amount for the time period shown on the graphic, based on many computer model simulations of possible rainfall totals. These higher amounts are an unlikely scenario, with only a 1 in 10, or 10% chance that more rain will fall, and a 9 in 10, or 90% chance that less rain will fall. These amounts can help serve as an upper-end scenario for planning purposes.
Day 1  |
Day 2  |
Day 3  |
Day 4  |
Day 5  |
Day 6  |
Day 7  |
Least Possible 24 Hour Rainfall (in.)
These maps depict a reasonable lower-end rainfall amount for the time period shown on the graphic, based on many computer model simulations of possible rainfall totals. These lower amounts are an unlikely scenario, with a 9 in 10, or 90% chance that more rain will fall, and only a 1 in 10, or 10% chance that less rain will fall. These amounts can help serve as a lower-end scenario for planning purposes. On many occasions these graphics will be blank, which depicts that the low end is for no measurable rainfall.
Day 1  |
Day 2  |
Day 3  |
Day 4  |
Day 5  |
Day 6  |
Day 7  |
Expected Rainfall (in.)
These maps are the official NWS rainfall forecast in inches during the time period shown on the graphic. These rainfall amounts are determined by NWS forecasters to be the most likely outcome based on evaluation of data from computer models, satellite, radar, and other observations.
Day 1-2  |
Day 1-3  |
Day 1-5  |
Day 1-7  |
Day 2-3  |
Day 3-4  |
Day 4-5  |
Day 6-7  |
Greatest Possible Rainfall (in.)
These maps depict a reasonable upper-end rainfall amount for the time period shown on the graphic, based on many computer model simulations of possible rainfall totals. These higher amounts are an unlikely scenario, with only a 1 in 10, or 10% chance that more rain will fall, and a 9 in 10, or 90% chance that less rain will fall. These amounts can help serve as an upper-end scenario for planning purposes.
Day 1-2  |
Day 1-3  |
Day 1-5  |
Day 1-7  |
Day 2-3  |
Day 3-4  |
Day 4-5  |
Day 6-7  |
Least Possible Rainfall (in.)
These maps depict a reasonable lower-end rainfall amount for the time period shown on the graphic, based on many computer model simulations of possible rainfall totals. These lower amounts are an unlikely scenario, with a 9 in 10, or 90% chance that more rain will fall, and only a 1 in 10, or 10% chance that less rain will fall. These amounts can help serve as a lower-end scenario for planning purposes. On many occasions these graphics will be blank, which depicts that the low end is for no measurable rainfall.
Day 1-2  |
Day 1-3  |
Day 1-5  |
Day 1-7  |
Day 2-3  |
Day 3-4  |
Day 4-5  |
Day 6-7  |
CURRENT HAZARDS
Submit a Storm Report
Outlooks
Graphical Hazardous Weather Outlook
Self Briefing Page
National Hazards
Tropics / Hurricanes
Local Storm Reports
CURRENT WEATHER
Surface Observations
Satellite
Observed Precipitation
MesoAnalysis
Rivers / Lakes
Latest Sounding
Lake Okeechobee
PAST WEATHER
Recent Rainfall
Tropical Cyclone Reports
Past Events
FORECASTS
Forecast Discussion
Tropical Weather
Probabilistic Page
Heat Page
Cold Weather Page
Marine Weather
Fire Weather
Beach Forecast
Aviation Weather
Probabilistic QPF
Hourly Forecasts
Activity Planner
Graphical Forecast
International Weather
RADAR IMAGERY
National
Miami Radar
Key West Radar
Across Florida
CLIMATE
Local Climate Info
More Local Climate Info
Climate Graphs
US Dept of Commerce
National Oceanic and Atmospheric Administration
National Weather Service
Miami - South Florida
11691 SW 17th Street
Miami, FL 33165
305-229-4522
Comments? Questions? Please Contact Us.