
For Moderate/High/Extreme hazard risk, more detailed information will be provided via emailed briefings to core partners.
 |
2.5 Day QPF ForecastMap displays 2.5 Day forecasted precipitation amounts. Map is updated every time the forecaster issues a new forecast. |
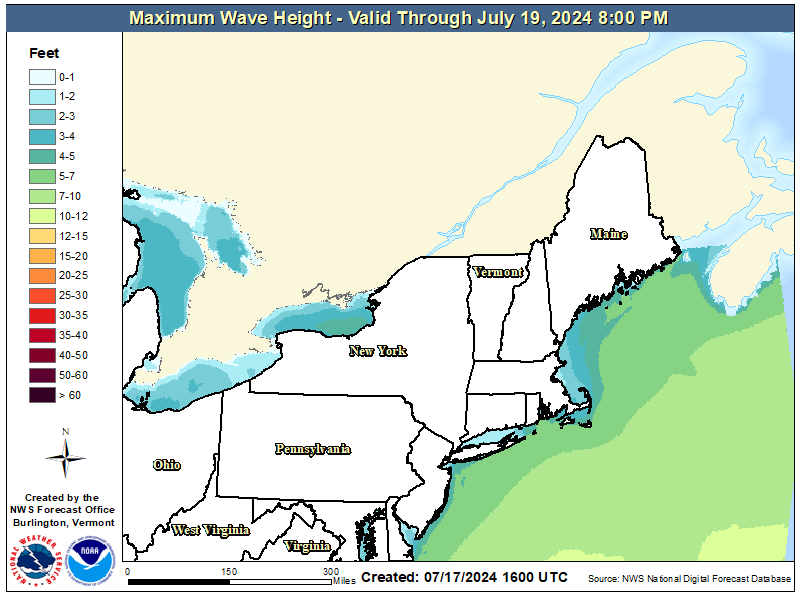 |
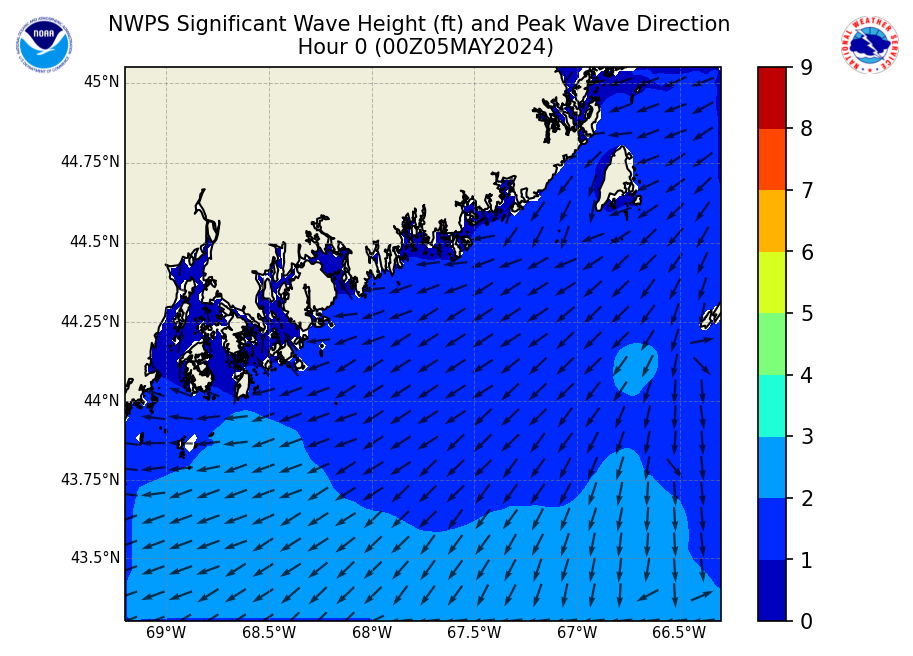
Maximum Wave HeightMap displays 3-Day Maximum Wave Height. Map is updated every time the forecaster issues a new forecast. |
||
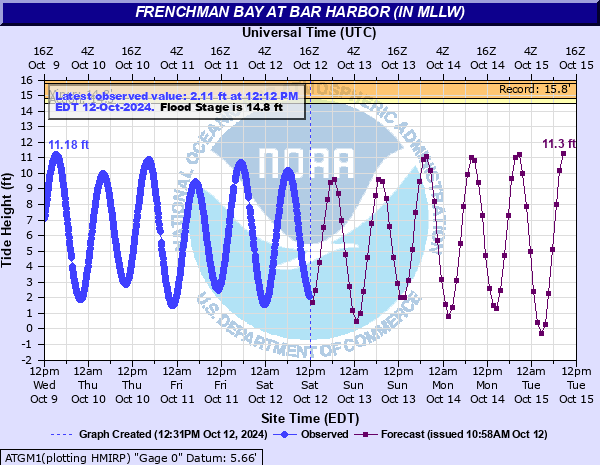 |
Bar Harbor Tide GageImage displays observed and predicted tide levels for the Bar Harbor Tide gage. |
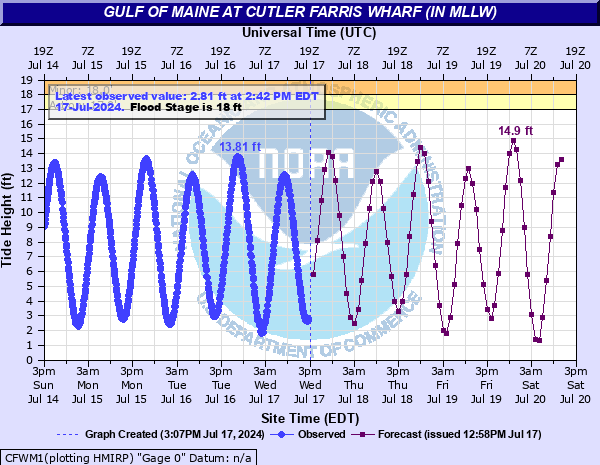 |
Cutler Farris Wharf Tide GageImage displays observed and predicted tide levels for the Cutler Farris Wharf Tide gage. |
||
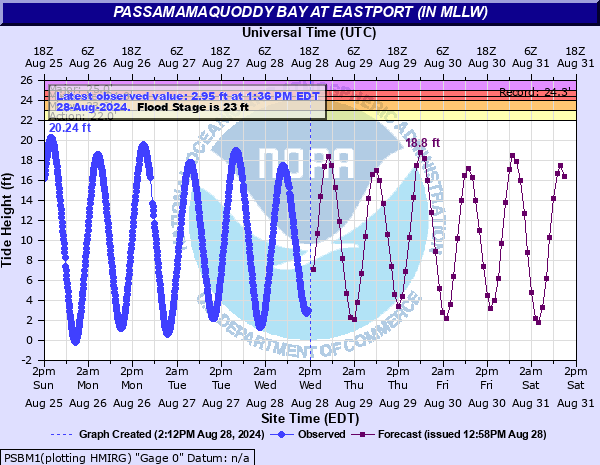 |
Eastport Tide GageImage displays observed and predicted tide levels for the Eastport gage. |
 |
24Hr QPF ForecastMap displays 24hr forecasted precipitation amounts. Map is updated every time the forecaster issues a new forecast. |
||
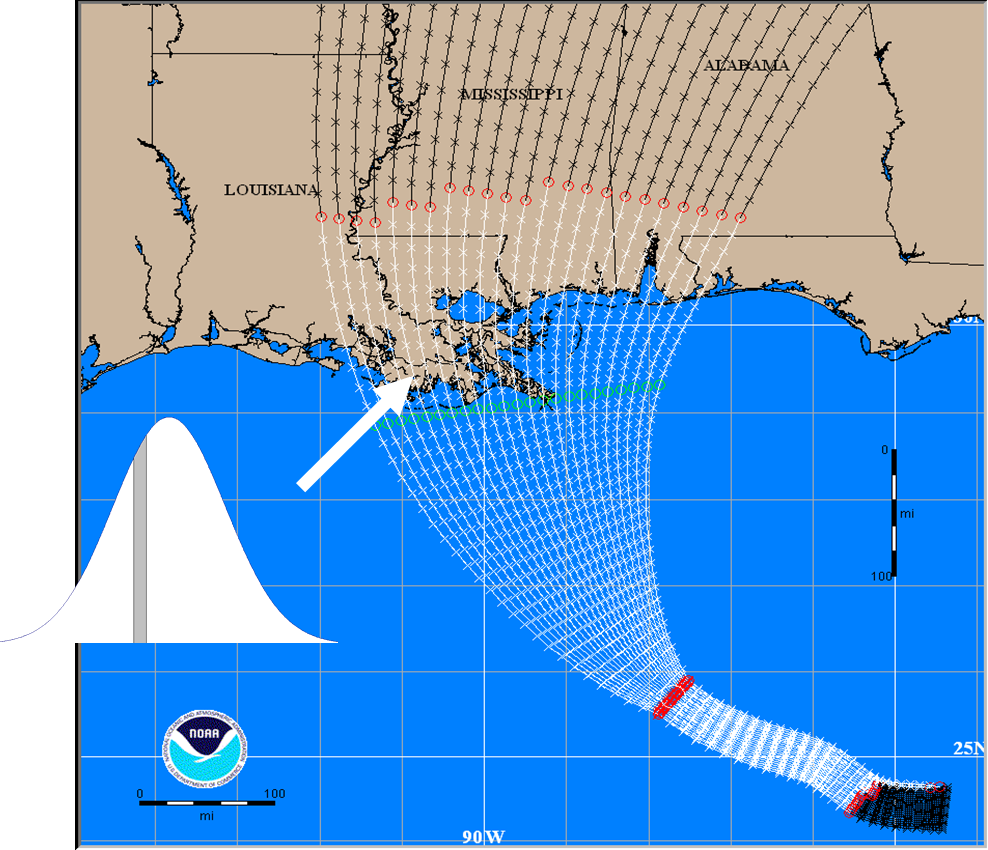 |
Probabilistic Hurricane Storm Surge (with tide)Map displays experimental storm surge (with tide) heights in feet above ground level with a 1 in 10 chance of being exceeded. |
 |
|


 Coastal Flood