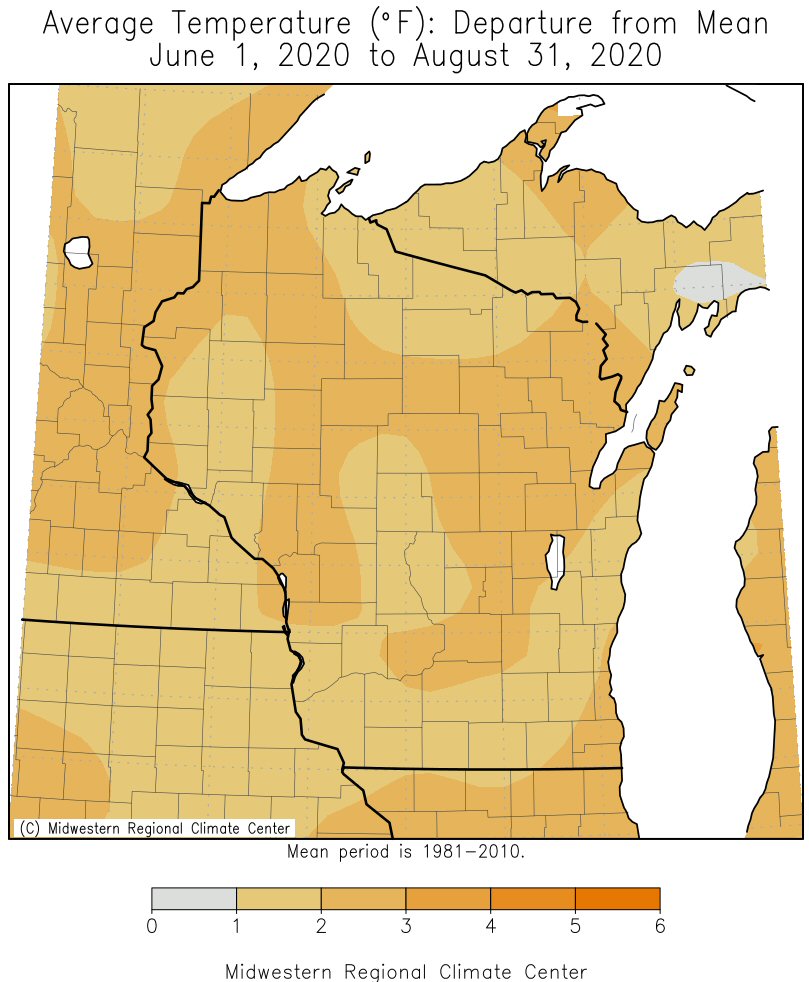
Meteorological summer (June 1 through August 31) 2020 was warmer-than-normal across the region. Temperatures averaged 1 to 3F warmer than the 1981-2010 normals. La Crosse WI ended up with their 3rd warmest summer and Rochester MN tied 2006 for their 12th warmest summer.
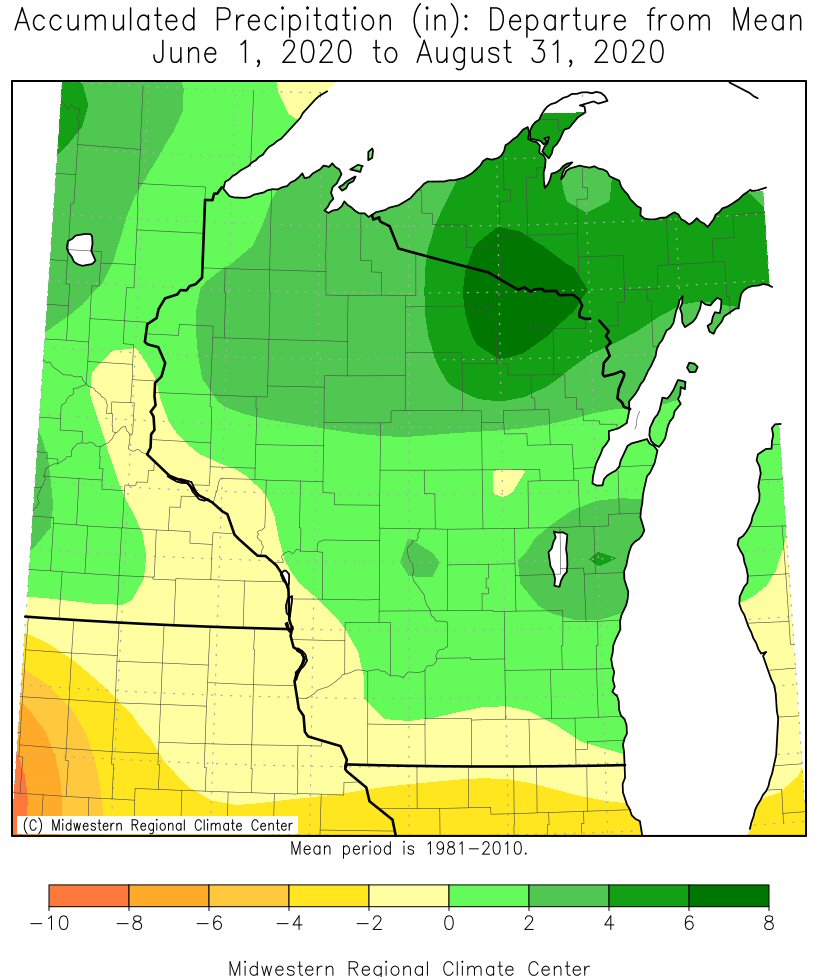
Heavy rain during the final days of August not only ended the moderate (D1) drought along and north of Interstate 90, but it also brought the seasonal rainfall in these area back to near-normal. La Crosse WI was slightly wetter-than-normal (+0.04"). Rochester MN ended the summer just an inch below-normal. While northeast Iowa was up to 2 inches drier-than-normal for the season, they are anywhere from 4 to 7 inches drier-than-normal since July 1. This has resulted in the development of a moderate (D1) drought there.
Below are the summer temperature and precipitation anomalies.
 |
 |
| Summer Temperature Anomalies |
Summer Rainfall Anomalies |
La Crosse, WI
2020 Meteorological Summer was Unusually Hot with Near-Normal Rainfall
During the meteorological summer (June 1st through August 31st) of 2020, both the temperatures were well-above normal (3rd hottest) and precipitation was slightly
wetter-than-normal at La Crosse Regional Airport.
More details are listed below...
Temperatures...
During meteorological summer, La Crosse Regional Airport had an average temperature of 74.7 degrees. This was 3.2 degrees warmer than the 1981-2010 normal of 71.5 degrees. This made it the 3rd warmest summer. Only 1995 (75.7 degrees) and 1988 (75.3 degrees) were hotter. The last time that we have been this hot in a summer was in 2018 when the average temperature was 74.5 degrees (4th hottest). Five out of the 16 hottest summers have occurred since 2010. They were 2010 (16th hottest), 2012 (5th hottest), 2016 (15th hottest), 2018 (5th hottest), and 2020 (3rd hottest). The table below lists the ten hottest summers for the La Crosse Area.
Ten Hottest Summers
in La Crosse WI
1873-2020
Average
Rank Temperature Year
---- ----------- ----
1 75.7F 1995
2 75.3F 1988
3 74.7F 2020
4 74.5F 2018
5 74.4F 2012
6 74.2F 1980
7 74.0F 1955
74.0F 1949
74.0F 1901
10 73.9F 1936
The table below provides a breakdown of the temperature departures from normal for La Crosse WI this summer...
Summer 2020 Temperatures
in La Crosse WI
Departure from
Normal
--------------
June Avg Temp 72.8F +3.6F - Tied for 12th Warmest
Avg Max Temp 83.8F +3.8F - Tied for 14th Warmest
Avg Min Temp 61.8F +3.3F - 18th Warmest
July Avg Temp 77.1F +3.4F - Tied for 12th Warmest
Avg Max Temp 88.0F +3.9F - 13th Warmest
Avg Min Temp 66.3F +3.1F - Tied for 18th Warmest
August Avg Temp 74.2F +2.8F - Tied for 12th Warmest
Avg Max Temp 85.9F +4.4F - 11th Warmest
Avg Min Temp 62.5F +1.2F
Summer Avg Temp 74.7F +3.2F - 3rd Warmest
Avg Max Temp 85.9F +4.0F - 4th Warmest
Avg Min Temp 63.5F +2.5F - Tied for 11th Warmest
Other temperature tidbits this summer...
- The hottest temperature was 97 degrees on August 26.
- The coldest high temperature was 69 degrees on June 22.
- The coldest temperature was 50 degrees on June 14 and August 4. There have only been 12 summers in which the temperature never fell below 50F. They were 1881, 1883, 1884, 1905, 1949, 1973, 1991, 2007, 2010, 2014, 2018, and 2020.
- The warmest low temperature was 76 degrees on July 26.
- The temperature climbed to or exceeded 90 degrees on 28 days. Normally, there are 17 days per summer.
- Temperatures averaged above normal on 64 days...below normal on 20 days...and normal on 8 days.
Rainfall...
During the meteorological summer, La Crosse Regional Airport received 12.93 inches of rain. This was 0.04 inches wetter than the 1981-2010 normal of 12.89 inches. This made it the 5th consecutive summer with above-normal rainfall. Over half (56.5 percent) of the rain this summer fell in June. During the remainder of the summer, the combination of the dryness and warmer-than-normal temperatures resulted in moderate (D1) drought developing in mid-August. This was the first time that there has been a moderate drought since August 2018. However, it did not last long as beneficial rains fell late in August.
The table below contains the monthly rainfall totals and their departures from normal for this summer.
Summer 2020 Rainfall
in La Crosse WI
Departure
Month Rain Total from Normal
----- ---------- -----------
June 7.31 inches +2.97 inches - 17th Wettest
July 1.72 inches -2.54 inches - 18th Driest
August 3.90 inches -0.39 inches
Summer 12.93 inches +0.04 inches
Other rainfall tidbits this summer...
- The wettest day occurred on August 31 when 1.98 inches of rain fell. The second wettest day was June 9 when the remnants of Tropical Storm Cristobal produced 1.91 inches of rain. This is the only tropical storm remnants ever to move through the La Crosse Hydrologic Service Area. The third wettest day was June 2 with 1.41 inches. These 3 days amounted to 41.1 percent of rainfall this summer.
Measurable rain fell on 30 days and trace amounts fell on another 10 days.
- 0.01 inches or more - 30 days
- 0.10 inches or more - 16 days
- 0.50 inches or more - 10 days
- 1.00 inches or more - 3 days
Sky...
- It was clear on 62 days.
- It was partly cloudy on 28 days.
- It was cloudy on 2 days.
Sea Level Pressure...
- Highest was 30.35 inches on June 13.
- Lowest was 29.24 inches on June 9. This was associated with the remnants of Tropical Storm Cristobal.
Winds...
- Highest sustained wind was 41 mph from the southeast on July 18.
- Highest wind gust was 58 mph from the north on June 2, south on July 18, and west on August 14.
Rochester, MN...
2020 Meteorological Summer was Warmer- and Drier-than-Normal in Rochester MN
During the meteorological summer (June 1st through August 31st) of 2020, it was warmer- (tying 2006 for the 12th warmest summer) and drier-than-normal at Rochester International Airport.
More details are listed below...
Temperatures...
During meteorological summer, Rochester International Airport had an average temperature of 70.7 degrees. This was 1.3 degrees warmer than 1981-2010 normal of 69.4 degrees. This tied 2006 for the 12th warmest summer. 6 out of the 14 hottest summers have occurred since 2005. The table below lists the 20 warmest summers for the Rochester Area.
20 Hottest Summers
in Rochester MN
1886-2020
Average
Rank Temperature Year
---- ----------- ----
1 73.0F 1949
2 72.4F 2012
3 72.3F 1955
4 72.2F 1988
5 71.9F 1936
6 71.7F 1931
7 71.4F 1943
8 71.2F 1983
9 71.1F 1995
10 70.9F 2010
11 70.8F 2011
12 70.7F 2020
70.7F 2006
14 70.6F 2005
70.6F 1976
70.6F 1959
70.6F 1932
70.6F 1913
19 70.5F 1975
70.5F 1933
The table below provides a breakdown of the temperature departures from normal for Rochester MN this summer...
Summer 2020 Temperatures
in Rochester MN
Departure from
Normal
--------------
June Avg Temp 69.9F +2.3F - Tied for 16th Warmest
Avg Max Temp 80.7F +2.7F - 17th Warmest
Avg Min Temp 59.1F +1.9F - Tied for 15th Warmest
July Avg Temp 72.4F +1.0F
Avg Max Temp 82.6F +1.2F
Avg Min Temp 62.2F +0.9F - Tied for 20th Warmest
August Avg Temp 69.7F +0.5F
Avg Max Temp 81.1F +2.2F
Avg Min Temp 58.2F -1.1F
Summer Avg Temp 70.7F +1.3F - Tied for 12th Warmest
Avg Max Temp 81.5F +2.0F
Avg Min Temp 59.8F +0.5F - 20th Warmest
Other temperature tidbits this summer...
- The hottest temperature was 93 degrees on June 2.
- The coldest high temperature was 68 degrees on June 10 and June 13.
- The coldest temperature was 46 degrees on August 4.
- The warmest low temperature was 73 degrees on July 25.
- The temperature reached 90 degrees on 6 days. Normally there are 10 days.
- Temperatures averaged above normal on 52 days, below normal on 37 days, and normal temperatures on 3 days.
Rainfall...
During the meteorological summer, Rochester International Airport received 12.75 inches of rain. This was 1 inch drier than the 1981-2010 normal of 13.75 inches.
The table below contains the monthly rainfall totals and their departures from normal for this summer.
Summer 2020 Rainfall
in Rochester MN
Precipitation Departure
Month Total from Normal
----- ------------ -----------
June 4.65 inches -0.03 inches
July 3.86 inches -0.69 inches
August 4.24 inches -0.28 inches
Summer 12.75 inches -1.00 inches
Other rainfall tidbits this summer...
- The wettest day occurred on August 31 when 2.01 inches of rain fell. The second wettest day was June 9 when 1.83 inches of rain fell. This was associated with the remnants of Tropical Storm Cristobal. These 2 days amounted to 30 percent of the summer rainfall.
Measurable rain fell on 30 days and trace amounts fell on another 10 days.
- 0.01 inches or more - 31 days
- 0.10 inches or more - 18 days
- 0.50 inches or more - 9 days
- 1.00 inches or more - 4 days
Sky...
- It was clear on 59 days.
- It was partly cloudy on 32 days.
- It was cloudy on 1 days.
Sea Level Pressure...
- Highest was 30.34 inches on June 13.
- Lowest was 29.30 inches on June 9. This was associated with the remnants of Tropical Storm Cristobal.
Winds...
- Highest sustained wind was 39 mph from the northeast on June 2.
- Highest wind gust was 52 mph from the south on August 9.


 Weather Story
 Weather Map
 Local Radar