Upper Mississippi River Climate Summary for September 2024:
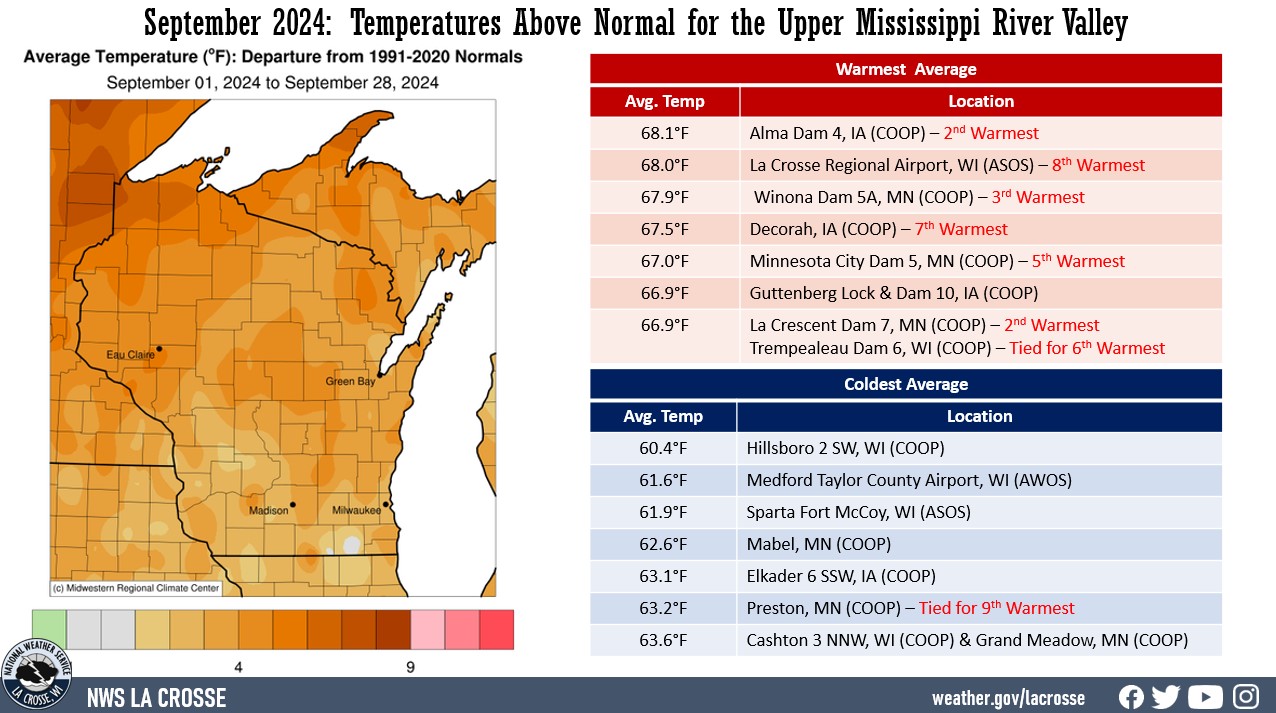
Temperatures - Above Normal
- During September 2024, average temperatures ranged from 60.4°F near Hillsboro, WI (COOP) to 68.1°F at Alma Dam, WI (COOP).
- Temperature anomalies ranged from 2 to 5°F warmer-than-normal.
- There was a 62°F difference between the warmest and coldest temperatures in the Upper Mississippi River Valley.
- The warmest temperature was 92°F at Boscobel Airport, WI on September 15 and Decorah, IA on September 21 . Meanwhile, the coldest temperature was 30°F at Sparta Fort McCoy, WI (ASOS) on September 7.
- Several locations had one of their 10 warmest Septembers: This includes: Alma Dam 4, WI & La Crescent Dam 7, MN (2nd warmest); Winona Dam 5A, MN (3rd warmest); Rochester, MN (4th warmest); Minnesota City Dam, MN (5th warmest); Trempealeau Dam, WI (tied for the 6th warmest); Deceorah, IA (7th warmest); La Crosse, WI (8th warmest);and Preston, MN (tied for the 9th warmest).
|
 |
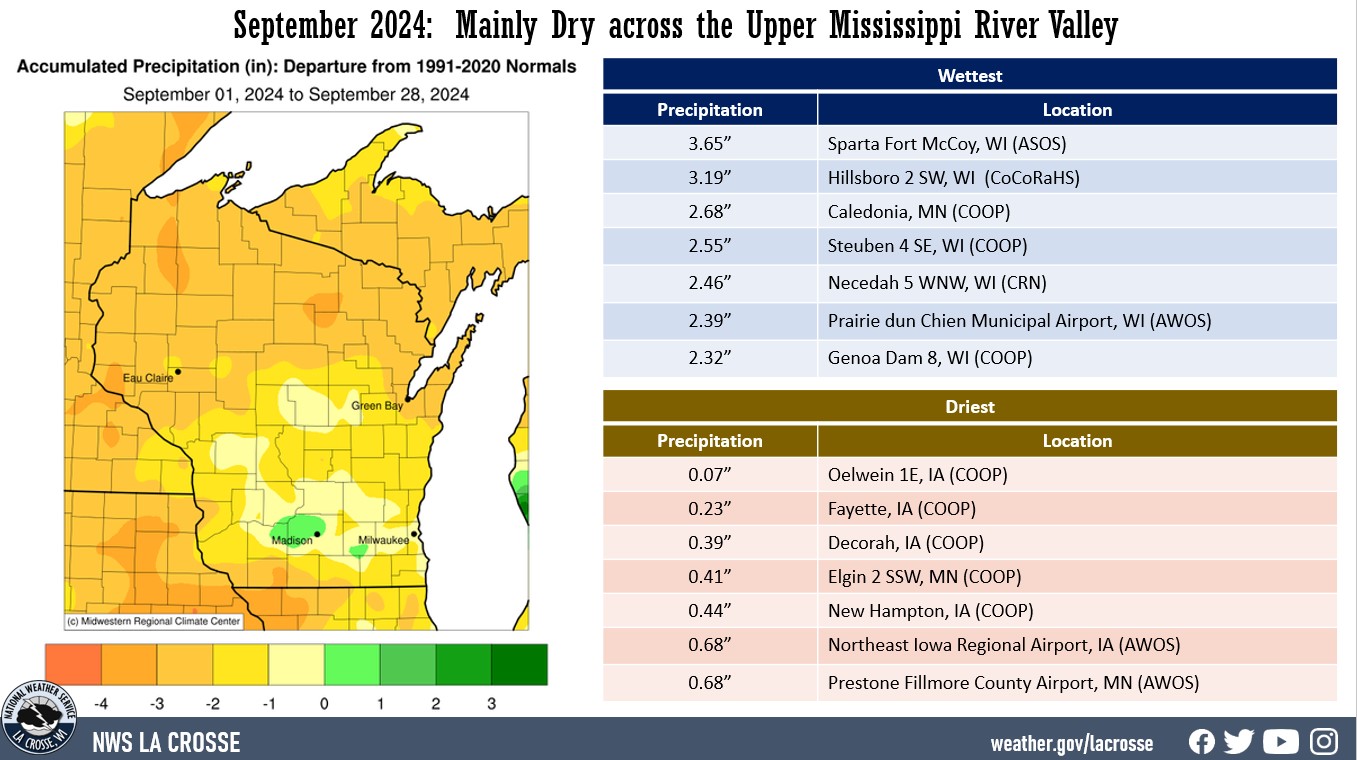
Rainfall - Mainly Dry
- Rainfall totals varied from 0.07" near Oelwein, IA (AWOS & COOP) to 3.65" near Sparta, WI (ASOS).
- Rainfall anomalies ranged from near normal to 4" drier than normal.
- The highest one-day precipitation was 2.61" near Wilton, WI (CoCoRaHS) from September 21 to September 22.
|
 |
Below are the September 2024 climate summaries for La Crosse, WI, and Rochester, MN.
La Crosse, WI
September 2024 was Much Warmer and Drier than Normal in La Crosse, WI
...September 2024 Highlights...
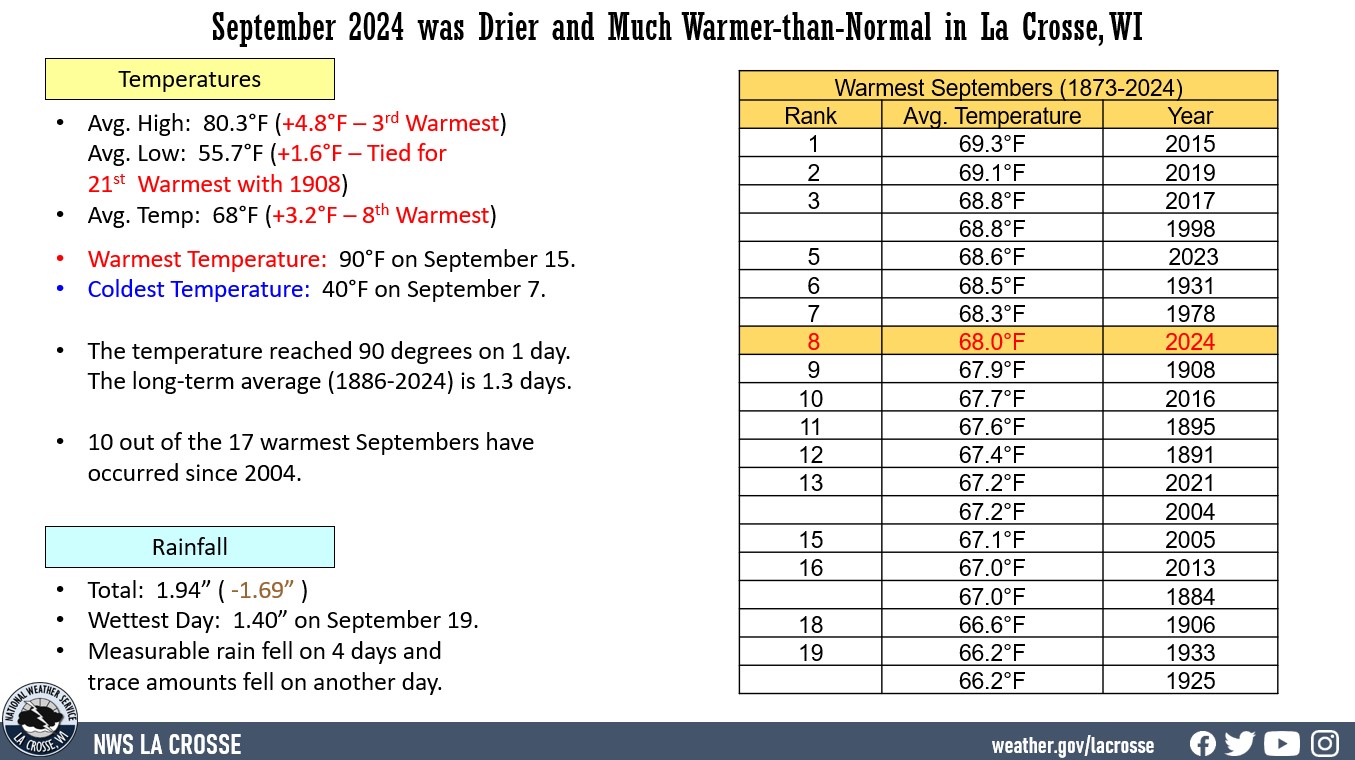
Temperatures - 8th Warmest
- During September 2024, the average temperature was 68°F at La Crosse Regional Airport.
- This was 3.2°F warmer than the 1981-2020 normal of 64.8°F.
- This was the 8th warmest September and the warmest since last September (68.6°F - 5th warmest).
- 10 out of the 17 warmest Septembers have occurred since 2004.
|
 |
- The table below contains the 20 warmest Septembers for La Crosse, WI.
20 Warmest Septembers
in La Crosse WI
1873-2024
Average
Rank Temperature Year
---- ----------- ----
1 69.3°F 2015
2 69.1°F 2019
3 68.8°F 2017
68.8°F 1998
5 68.6°F 2023
6 68.5°F 1931
7 68.3°F 1978
8 68.0°F 2024
9 67.9°F 1908
10 67.7°F 2016
11 67.6°F 1895
12 67.4°F 1891
13 67.2°F 2021
67.2°F 2004
15 67.1°F 2005
16 67.0°F 2013
67.0°F 1884
18 66.6°F 1906
19 66.2°F 1933
66.2°F 1925
- The average high temperature was 80.3°F. This was 4.8°F warmer than the 1981-2020 normal of 75.5°F. This was the 3rd warmest. Only 1998 (81.4°F) and 2017 (80.5°F) were warmer.
- The average low temperature was 55.7°F. This was 1.6°F warmer than the 1981-2020 normal of 54.1°F. This was tied with 1908 for the 21st warmest.
- The warmest temperature was 90°F on September 15 and the coldest temperatures was 40°F on September 7.
- There was 1 day with the temperature 90°F or warmer. The long-term average (1873-2024) is 1.3 days.
- The high temperature was 80°F or warmer on 20 days. This tied 1908 for the most.
Rainfall - Drier than Normal
- A total of 1.94" of rain fell. This was 1.69" drier than the 1991-2020 normal of 3.63".
- The wettest day was 1.40" on September 19.
- Rain fell on only 5 days. 4 days had measurable rain (13.3%) and another day had a trace (3.3%).
- The 4 days with measurable rain was tied with 1891, 1892, 1893, 1948, 1967, 2009, and 2021 for the 2nd least. Only 1979 had fewer (3 days).
...Daily Records...
- September 7 - Record Low Tied - 40°F - Tied 1956 and 1986
- This was the first time that either a daily cold high or record low has been set or tied in La Crosse since February 15, 2021. This 1,300-day stretch is the longest stretch of days between similar (daily cold-to-cold or warm-to-warm records) daily temperature records. The previous record was an 818-day stretch from July 7 through October 3, 1999. Like this latest stretch, it was also a stretch of days without a daily cold record.
- If look at the 10 longest of these stretches, 9 of the them were stretches of days between daily cold-to-cold records and just 1 of them was a stretch of days between daily warm-to-warm records (a 524-day stretch from May 1, 1992 to October 7, 1993).
...Looking Ahead to October...
- The normal high temperature in La Crosse starts off at 69°F on October 1st and falls to 54°F by the end of the month. The normal low temperature starts off at 47°F on the 1st and falls to 36°F by the end of the month. The warmest October temperature on record is 93°F on October 6, 1963, and the coldest is 6°F on October 25, 1887.
- The normal mean temperature for October is 51.7°F. La Crosse’s warmest October occurred in 1963 with an average temperature of 61.2°F, and their coldest October occurred in 1917 with an average temperature of 39.4°F.
- The normal October precipitation is 2.49". The wettest October occurred in 1881 with 12.09" of precipitation (second wettest month - only August 2007 was wetter with 13.75") and the driest October occurred in 1952 with only 0.02" of precipitation (third driest month - only November 1976 with a trace and December 1943 with 0.01 inches were drier). The wettest October day occurred on October 28, 1900, when 4.89" of rain fell (4th wettest calendar ay). Normally, there are 2 days with thunderstorms.
- The normal October snowfall is 0.3". The snowiest October occurred in 1917 with 7" of snow. The snowiest October day occurred on October 28, 1917, when 4.7" of snow fell.
Rochester, MN
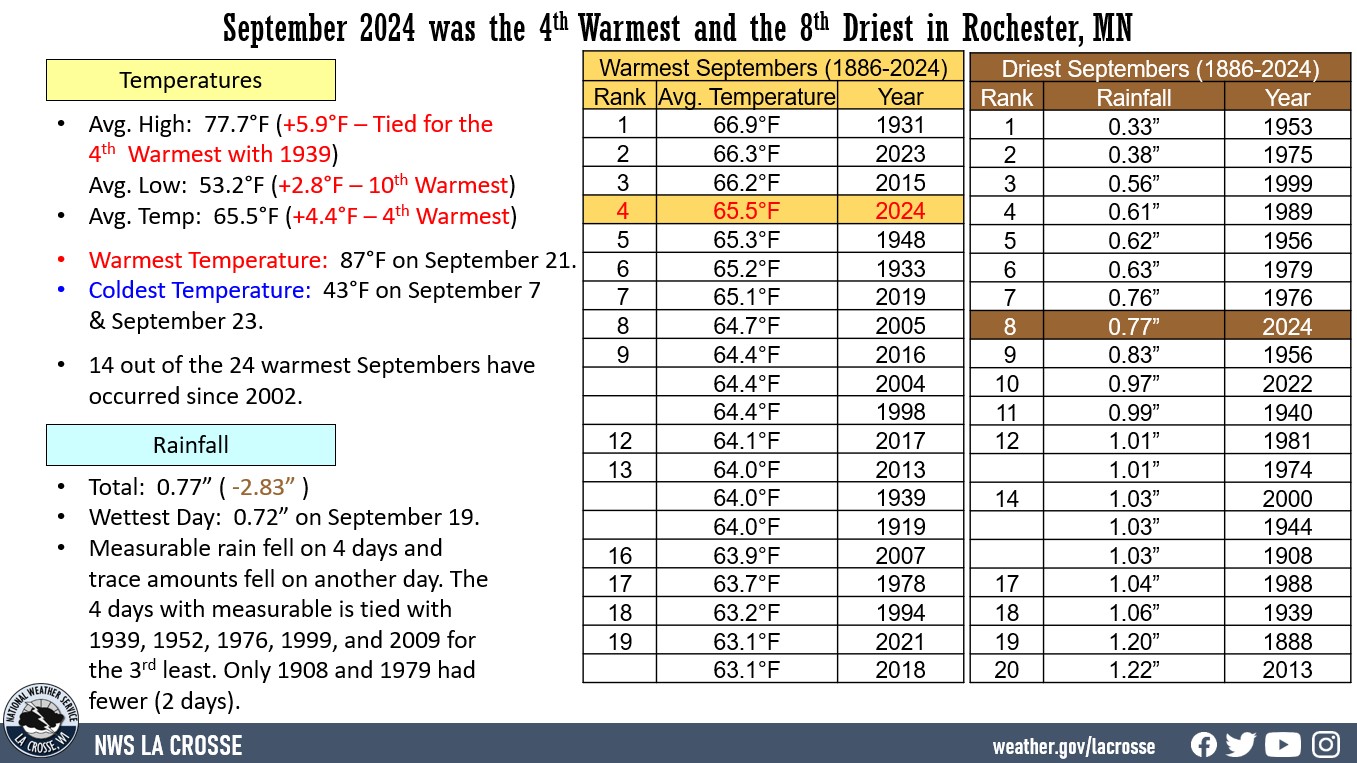
September 2024 was the 4th Warmest and 8th Driest in Rochester, MN
...September 2024 Highlights...
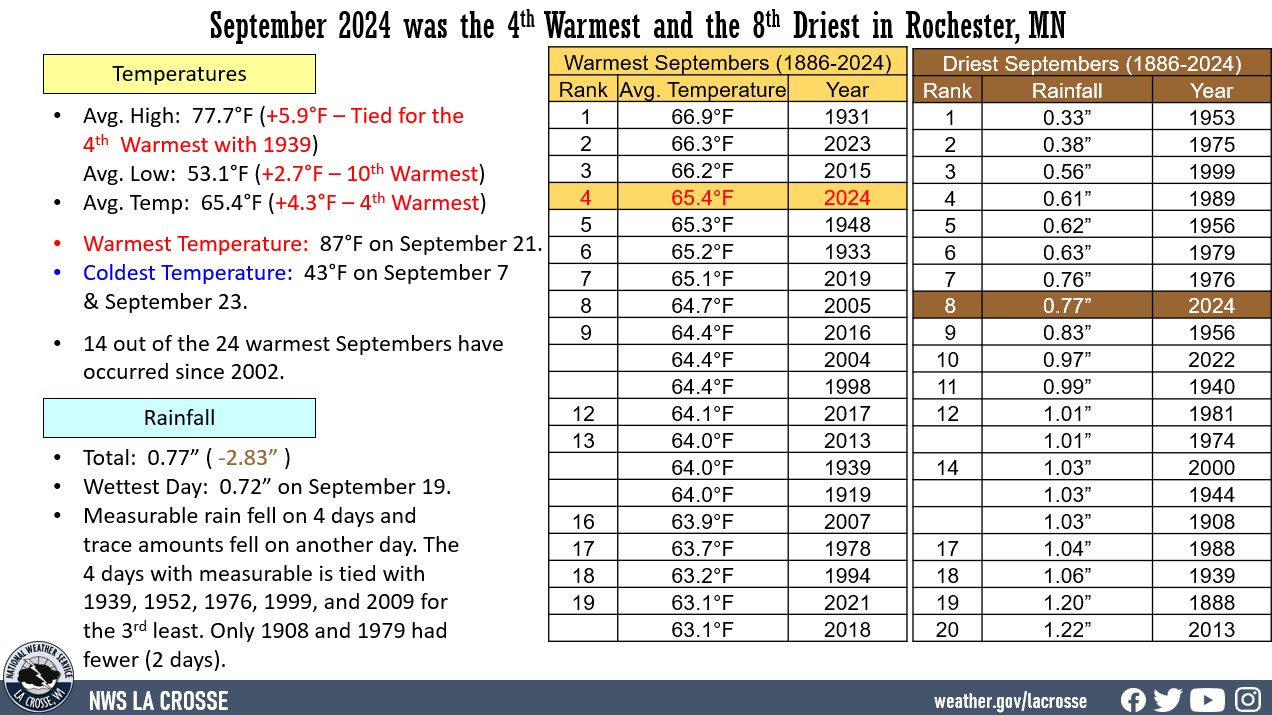
Temperatures - 4th Warmest
- During September 2024, the average temperature was 65.4°F at Rochester International Airport.
- This was 4.3°F warmer than the 1981-2020 normal of 61.1°F.
- This was the 4th warmest September and the warmest since last September (66.3°F - 2nd warmest).
- 14 out of the 24 warmest Septembers have occurred since 2002.
|
 |
- The table below contains the 20 warmest Septembers for Rochester, MN.
20 Warmest Septembers
in Rochester MN
1886-2024
Average
Rank Temperature Year
---- ----------- ----
1 66.9°F 1931
2 66.3°F 2023
3 66.2°F 2015
4 65.4°F 2024
5 65.3°F 1948
6 65.2°F 1933
7 65.1°F 2019
8 64.7°F 2005
9 64.4°F 2016
64.4°F 2004
64.4°F 1998
12 64.1°F 2017
13 64.0°F 2013
64.0°F 1939
64.0°F 1919
16 63.9°F 2007
17 63.7°F 1978
18 63.2°F 1994
19 63.1°F 2021
63.1°F 2018
- The average high temperature was 77.7°F. This was 5.9°F warmer than the 1981-2020 normal of 71.8°F. This was tied with 1939 for the 4th warmest. The warmest average was 81.9°F in 1908.
- The average low temperature was 53.1°F. This was 2.7°F warmer than the 1981-2020 normal of 50.4°F. This was the 10th warmest. The warmest average was 56.1°F in 2015.
- The warmest temperature was 87°F on September 21 and the coldest temperatures was 43°F on September 7 and September 23.
- The high temperature was 80°F or warmer on 14 days. This was the 5th most. The most is 22 days in 1908.
Rainfall - 8th Driest
A total of 0.77" of rain fell. This was 2.83" drier than the 1991-2020 normal of 3.60 inches. This was the 8th driest September. The table below contains the ten driest Septembers for Rochester, MN.
10 Driest Septembers
in Rochester MN
1886-2024
Rank Rainfall Year
---- -------- ----
1 0.33 inches 1953
2 0.38 inches 1975
3 0.56 inches 1999
4 0.61 inches 1989
5 0.62 inches 1956
6 0.63 inches 1979
7 0.76 inches 1976
8 0.77 inches 2024
9 0.83 inches 1956
10 0.97 inches 2022
- The wettest day was 0.72" on September 19.
- Rain fell on only 5 days. 4 days had measurable rain (13.3%) and another day had a trace (3.3%). The 4 days with measurable rain was tied with 1939, 1952, 1976, 1999, and 2009 for the 3rd least. Only 1908 and 1979 had fewer (2 days).
...Daily Records...
- September 28 - Record High Tied - 83°F - Tied 1952, 1956, and 1971
...Looking Ahead to October...
- The normal high temperature in Rochester starts off at 66°F on October 1st and falls to 50°F by the end of the month. The normal low temperature starts off at 44°F on the 1st and falls to 32°F by the end of the month. The warmest October temperature on record was 93°F on October 3, 1997, and the coldest was -6°F on October 25, 1887.
- The normal mean temperature for October is 47.9°F. Rochester’s warmest October occurred in 1963 with an average temperature of 58.1°F, and its coldest October occurred in 1917 with an average temperature of 37.6°F.
- The normal October precipitation is 2.43". The wettest October occurred in 1911 with 9.11" of precipitation and the driest October occurred in 1952 with only 0.01" of precipitation. The wettest October day occurred on October 6, 1911, when 2.85" of precipitation fell. Normally, there are 2 days with thunderstorms.
- The normal October snowfall is 0.9". The snowiest October occurred in 2009 with 7.9" of snow. The snowiest October day occurred on October 22, 1979, when 5" of snow fell.


 Weather Story
 Weather Map
 Local Radar