National Weather Service United States Department of Commerce

Upper Mississippi River Valley
 

September TemperaturesAbove-Normal

During September 2023, average temperatures ranged from 60.8°F at Medford Taylor County Airport, WI (AWOS) to 68.6°F at La Crosse Regional Airport (ASOS) in the Upper Mississippi River Valley. Temperature anomalies ranged from 2°F to 5°F warmer than normal. It was the 3rd warmest September in Minnesota City Dam 5, MN, and Rochester, MN. It was the 4th warmest September at Alma Dam 4, WI, and Charles City, IA. It was the 5th warmest September in La Crosse, WI. The hottest temperature was 100°F at Boscobel Airport, WI (COOP) on September 3. Meanwhile, the coldest temperature was 31°F at Hillsboro 2 SW, WI, and Sparta Fort McCoy, WI (ASOS) on September 14. A map of 2023 September temperature anomalies and 2 tables displaying the warmest and coldest locations. September 2023  was anomalously warm across the region.


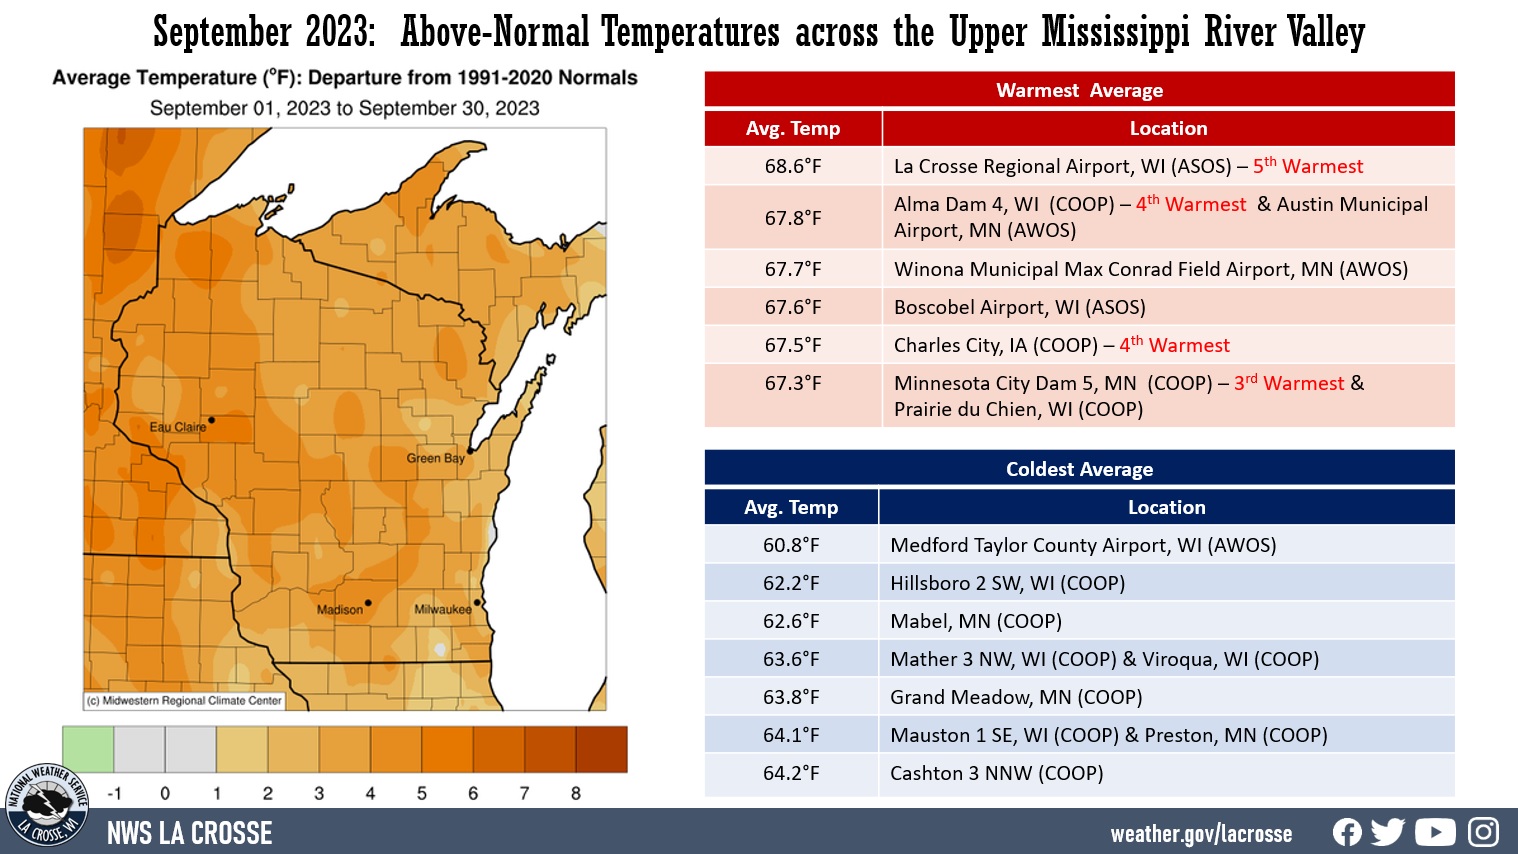
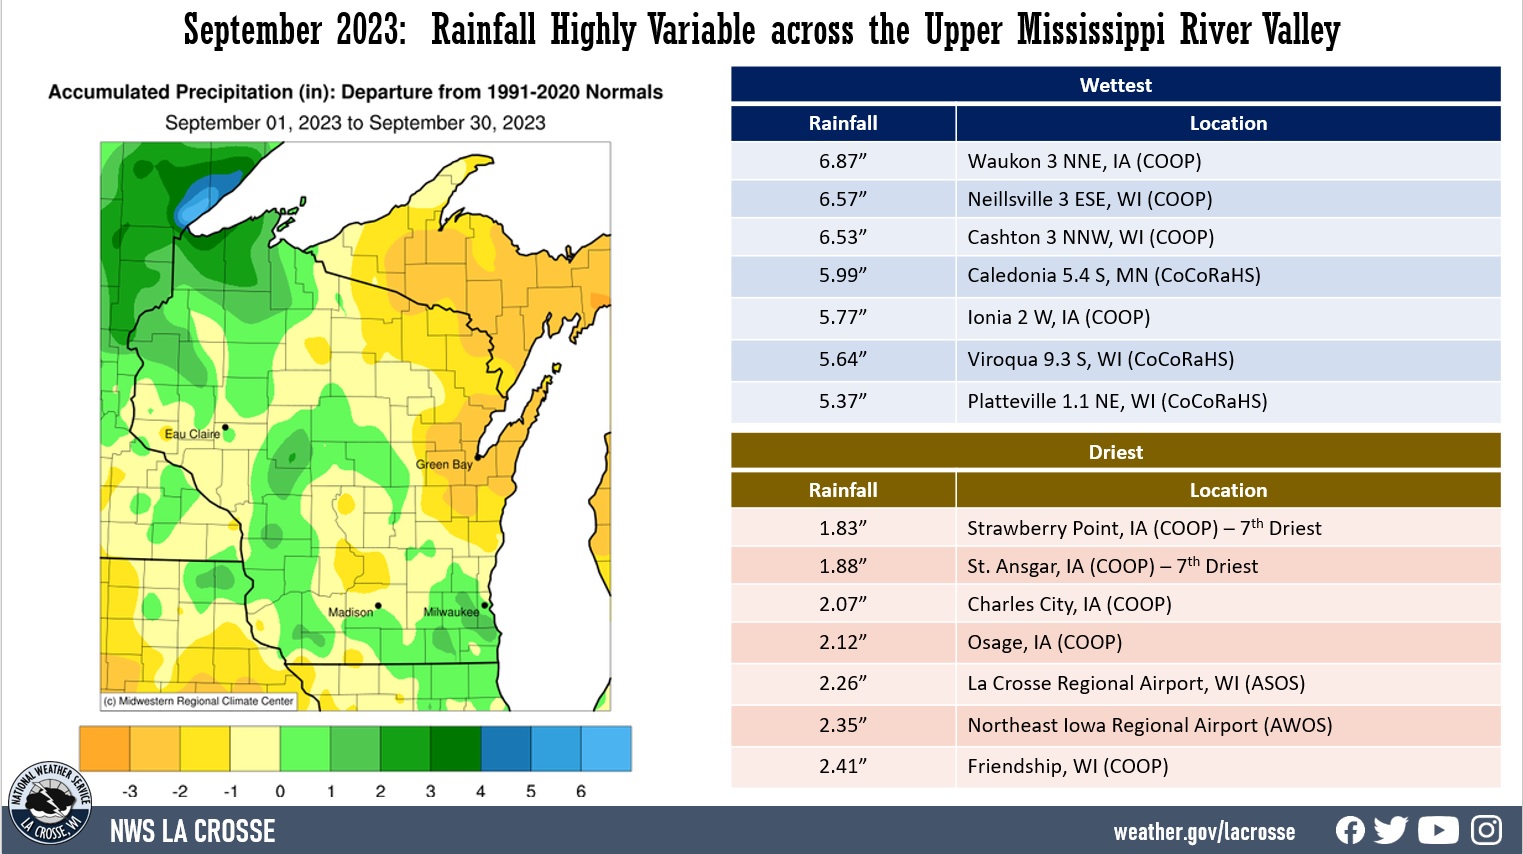
September Rainfall - Highly Variable

Rainfall was highly variable across the Upper Mississippi River Valley during September 2023 ranging from 1.85" at Elkader 6 SSW, IA (COOP) to 6.87" at Waukon 3 NNE, IA (CoCoRaHS). Rainfall anomalies ranged from 2" drier than normal to 3" wetter than normal. The highest one-day precipitation was 5.08" at Ionia 2 W, IA (COOP) from September 22-23. It was the 7th driest September at Strawberry Point, IA, and St. Ansgar, IA.

A map of 2023 September rainfall anomalies and 2 tables displaying the wettest and driest locations. Rainfall was highly variable across the region during September 2023


Abnormally dry (D0) to exceptional (D4) drought continued across the Upper Mississippi River Valley. The exceptional (D4) drought maxed out at 27.42% on September 19 and it was down to 0% by the end of the month. The extreme (D3) drought decreased from a max of 59.2% on September 12 to 41.9% by the end of September.

There were 2 convective warnings (2 severe thunderstorm warnings) in September. The long-term average (1986-2023) for September is 12 severe weather warnings (8 severe thunderstorm warnings, 1 tornado warning, and 3 flash flood warnings).

Below are the climate summaries for La Crosse, WI, and Rochester, MN.

La Crosse, WI


September 2023 was Drier and Unusually Warm (5th warmest) at La Crosse, WI


...September 2023 Highlights...

Temperatures - 5th Warmest

During September, the average temperature at La Crosse Regional Airport was 68.6°F. This was 3.8°F warmer than the 1991-2020 normal of 64.8°F. This was the 5th warmest September and the warmest since 2019 (69.1°F - 2nd warmest). The warmest September occurred in 2015 when the average temperature was 69.3°F. 5 out of the 10 warmest Septembers have occurred since 2015. 9 out of the 16 warmest Septembers have occurred since 2004. September 2023 La Crosse Climate Factoid


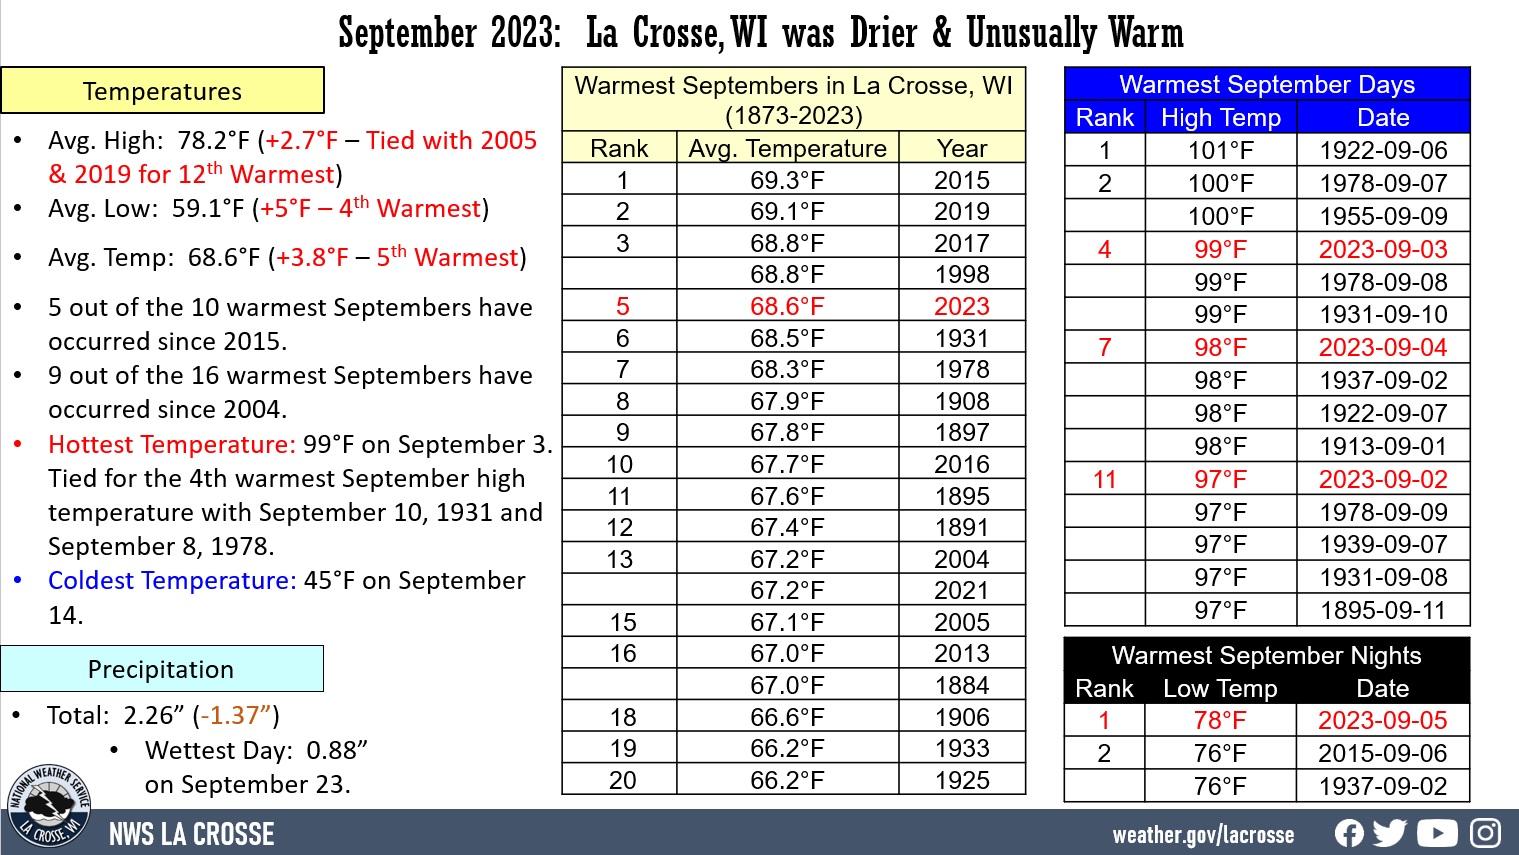
The table below contains the 20 warmest Septembers in La Crosse, WI.

   Warmest Septembers
    in La Crosse, WI
       1873-2023

Rank   Avg. Temp   Year
----   ---------   ----
  1     69.3°F     2015
  2     69.1°F     2019
  3     68.8°F     2017
        68.8°F     1998
  5     68.6°F     2023
  6     68.5°F     1931
  7     68.3°F     1978
  8     67.9°F     1908
  9     67.8°F     1897
 10     67.7°F     2016
 11     67.6°F     1895
 12     67.4°F     1891
 13     67.2°F     2021
        67.2°F     2004
 15     67.1°F     2005
 16     67.0°F     2013
        67.0°F     1884
 18     66.6°F     1906
 19     66.2°F     1933
        66.2°F     1925

  • The average high temperature was 78.2°F. This was 2.7°F warmer than the 1991-2020 of 75.5°F. This was tied with 2005 and 2019 for the 12th warmest in September. The warmest average high temperature in September was 81.4°F in 1998.
  • The average low temperature was 59.1°F. This was 5°F warmer than the 1991-2020 of 54.1°F. This was the 4th warmest in September. The warmest average low temperature in September was 60°F in 2019.
  • The hottest temperature was 99°F on September 3. Tied for the 4th warmest September high temperature on September 10, 1931, and September 8, 1978. Only September 6, 1922 (101°F), September 7, 1978 (100°F), and September 9, 1955 (100°F) were warmer.
  • The coldest high temperature was 67°F on September 7.
  • The warmest low temperature was 78°F on September 5. Warmest low temperature during the month of September. The previous record was 76°F on September 2, 1937, and September 6, 2015. This was the second month in a row where the warmest monthly low temperature was either tied or broken.
  • The coldest low temperature was 45°F on September 14.
  • There were 4 days with high temperatures of 90°F or warmer. The long-term average is 1 day.

Rainfall - Below Normal

  • A total of 2.26" of rain fell at La Crosse Regional Airport. This was 1.37" drier than the 1991-2020 normal of 3.63". 5 out of the last 6 months (going back to April) have been drier than normal. 15.35" of precipitation has fallen during this growing season (starting on April 1). This was 9.57" drier than the 1991-2020 normal of 24.92". This lack of rainfall resulted in the rapid development of drought. The U.S. Drought Monitor began the month of September with severe (D2) to exceptional (D3) drought in La Crosse County. By the end of September, the county had improved from moderate (D1) to severe (D2) drought. 
  • Measurable rain fell on 10 days (33.3%) and trace amounts of rain fell on another 2 days (6.7%).
  • The wettest calendar day was on September 23 when 0.88" of rain fell.

...Records...

  • Daily Records...
    • September 3 - Record High - 99°F - Previous Record 95°F in 1929 
    • September 4 - Record High - 98°F - Previous Record 95°F in 1925
    • September 5 - Record Warm Low - 78°F - Previous Record 74°F in 1912
    • September 30 - Record Warm Low - 68°F - Previous Record 68°F in 1877, 1878, and 1879
  • Monthly Records... 
    • September 5 - Warmest Low in September - 78°F - Previous record 76°F on September 2, 1937 and September 6, 2015

...Looking Ahead to October...

  • The normal high temperature in La Crosse starts off at 69°F on October 1st and falls to 54°F by the end of the month. The normal low temperature starts off at 47°F on the 1st and falls to 36°F by the end of the month. The warmest October temperature on record was 93°F on October 6, 1963, and the coldest was 6°F on October 25, 1887.  
  • The normal mean temperature for October is 51.7°F. La Crosse’s warmest October occurred in 1963 with an average temperature of 61.2°F, and its coldest October occurred in 1917 with an average temperature of 39.4°F. 
  • The normal October precipitation is 2.49". The wettest October occurred in 1881 with 12.09" of precipitation (the second wettest month - only August 2007 was wetter with 13.75") and the driest October occurred in 1952 with only 0.02" of precipitation (third driest month - only November 1976 with a trace and December 1943 with 0.01" were drier). The wettest October day occurred on October 28, 1900, when 4.89" of rain fell (4th wettest calendar day). Normally, there are 2 days with thunderstorms.
  • The normal October snowfall is 0.3". The snowiest October occurred in 1917 with 7" of snow. The snowiest October day occurred on October 28, 1917, when 4.7" of snow fell.

Rochester, MN

September 2023 was Slightly Drier and Unusually Warm (3rd warmest - warmest since 1931) at Rochester, MN


...September 2023 Highlights...

Temperatures - 3rd Warmest & Warmest since 1931

During September, the average temperature at Rochester International Airport was 66.2°F. This was 5.1°F warmer than the 1991-2020 normal of 61.1°F. This was tied with 2015 for the 3rd warmest September and the warmest since 1931 (66.9°F - 2nd warmest). The warmest September occurred in 1908 when the average temperature was 69.6°F. 10 out of the 20 warmest Septembers have occurred since 2004. September 2023 Rochester Climate Factoid

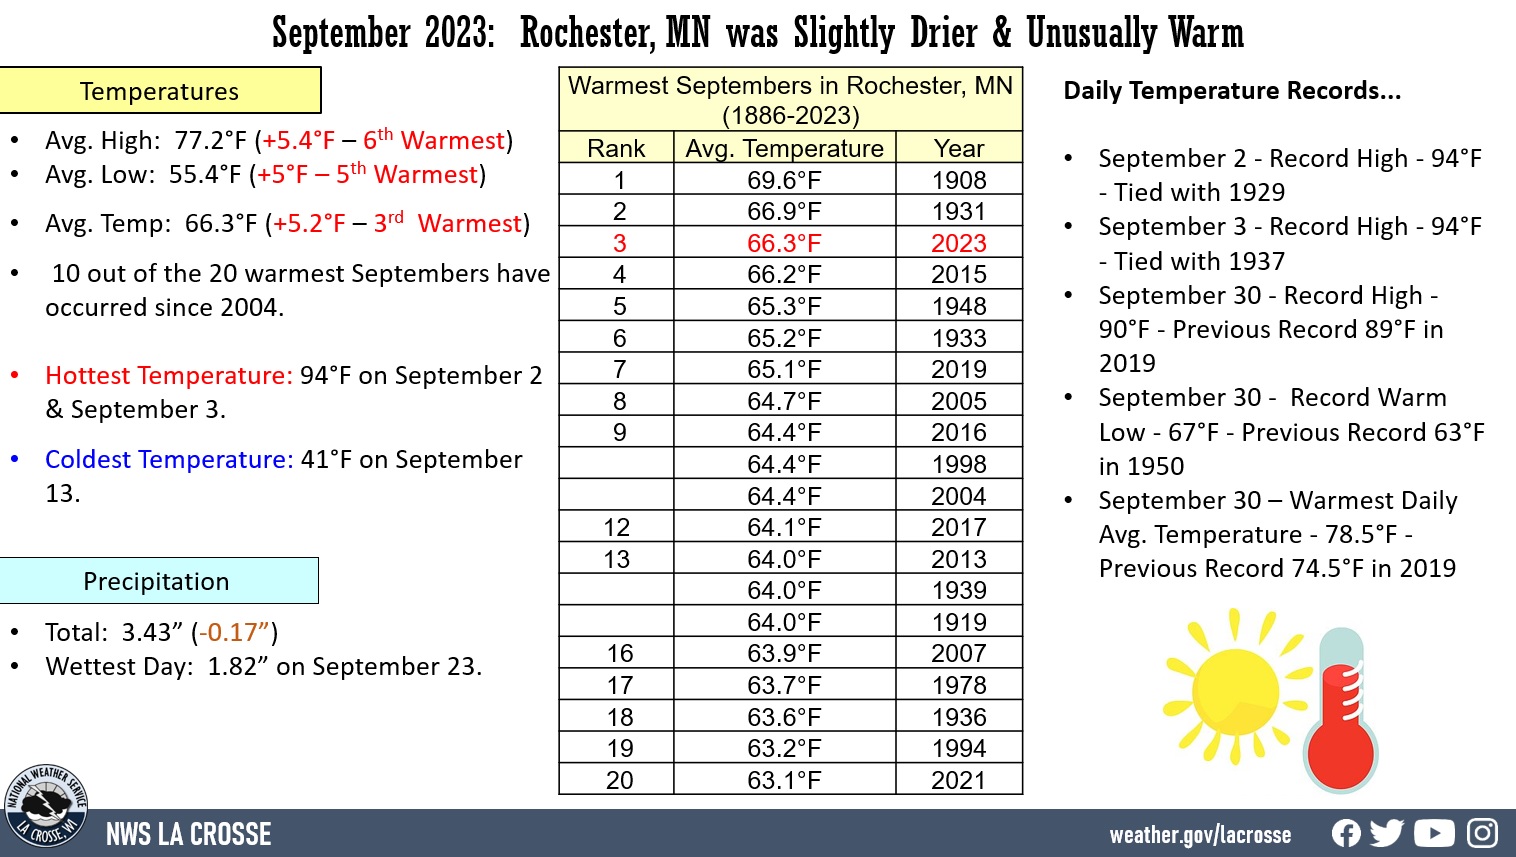
The table below contains the 20 warmest Septembers in Rochester, MN.

   Warmest Septembers
    in Rochester MN
       1886-2023

Rank   Avg. Temp   Year
----   ---------   ----
  1     69.6°F     1908
  2     66.9°F     1931
  3     66.3°F     2023
  4     66.2°F     2015
  5     65.3°F     1948
  6     65.2°F     1933
  7     65.1°F     2019
  8     64.7°F     2005
  9     64.4°F     2016
        64.4°F     2004
        64.4°F     1998
 12     64.1°F     2017
 13     64.0°F     2013
        64.0°F     1939
        64.0°F     1919
 16     63.9°F     2007
 17     63.7°F     1978
 18     63.6°F     1936
 19     63.2°F     1994
 20     63.1°F     2021

  • The average high temperature was 77.2°F. This was 5.4°F warmer than the 1991-2020 of 71.8°F. This was the 6th warmest in September. The warmest average high temperature in September was 81.9°F in 1908.
  • The average low temperature was 55.4°F. This was 5°F warmer than the 1991-2020 of 50.4°F. This was the 5th warmest in September. The warmest average low temperature in September was 57.3°F in 1908.
  • The hottest temperature was 94°F on September 2 and September 3. These were the warmest September temperatures since September 7, 1978.
  • The coldest high temperature was 62°F on September 7.
  • The warmest low temperature was 69°F on September 5.
  • The coldest low temperature was 41°F on September 13.
  • There were 4 days with high temperatures of 90°F or warmer. The long-term average is 1-day.

Rainfall - Slightly Below Normal

A total of 3.43" of rain fell at Rochester International Airport. This was 0.17" drier than the 1991-2020 normal of 3.60". 5 out of the last 6 months (going back to April) have been drier than normal. 15.98" of precipitation has fallen during this growing season (starting on April 1). This was 9.15" drier than the 1991-2020 normal of 25.13". This lack of rainfall resulted in the rapid development of drought. The U.S. Drought Monitor began the month of September with exceptional (D3) drought in Olmsted County. By the end of September, the county had improved from severe (D2) to exceptional (D3) drought. 

Measurable rain fell on 10 days (33.3%) and trace amounts of rain fell on another 4 days (13.3%).

The wettest calendar day was on September 23 when 1.82" of rain fell. This was the wettest September day since September 12, 2019 (2.70") and the wettest calendar day March 31, 2023 (2.15").

...Records...

  • Daily Records...
    • September 2 - Record High - 94°F - Tied with 1929
    • September 3 - Record High - 94°F - Tied with 1937
    • September 30 - Record High - 90°F - Previous Record 89°F in 2019
    • September 30 -  Record Warm Low - 67°F - Previous Record 63°F in 1950 
    • September 30 - Warmest Daily Avg. Temperature - 78.5°F - Previous Record 74.5°F in 2019

...Looking Ahead to October...

The normal high temperature in Rochester starts off at 66°F on October 1st and falls to 50°F by the end of the month. The normal low temperature starts off at 44°F on the 1st and falls to 32°F by the end of the month. The warmest October temperature on record is 93°F on October 3, 1997, and the coldest is -6°F on October 25, 1887.  

The normal mean temperature for October is 47.9°F. Rochester’s warmest October occurred in 1963 with an average temperature of 58.1°F, and its coldest October occurred in 1917 with an average temperature of 37.6°F. 

The normal October precipitation is 2.43". The wettest October occurred in 1911 with 9.11" of precipitation and the driest October occurred in 1952 with only 0.01" of precipitation. The wettest October day occurred on October 6, 1911, when 2.85" of precipitation fell. Normally, there are 2 days with thunderstorms.

The normal October snowfall is 0.9". The snowiest October occurred in 2009 with 7.9" of snow. The snowiest October day occurred on October 22, 1979, when 5" of snow fell.