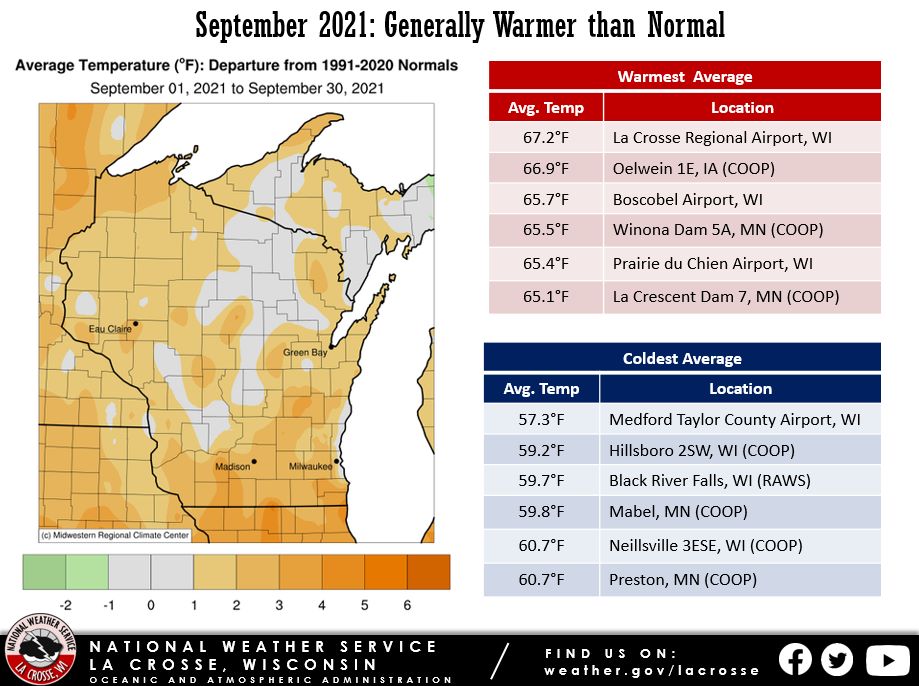
During September 2021, average temperatures ranged from near-normal to 3 degrees above normal across the Upper Mississippi River Valley. The average temperatures ranged from 57.3°F at Medford Taylor County Airport to 67.2°F at La Crosse Regional Airport. September average temperatures typically range from 55°F to 65°F.
La Crosse WI tied 2004 for the 11th warmest September. Rochester, MN tied 2018 for the 18th warmest September. Both locations have seen 7 out of the last 9 Septembers (going back to 2013) were among their 22 warmest Septembers.
The hottest temperature was 91°F at Boscobel Airport on September 19. Meanwhile, the coldest temperature was 32°F at Black River Falls, WI on September 23.
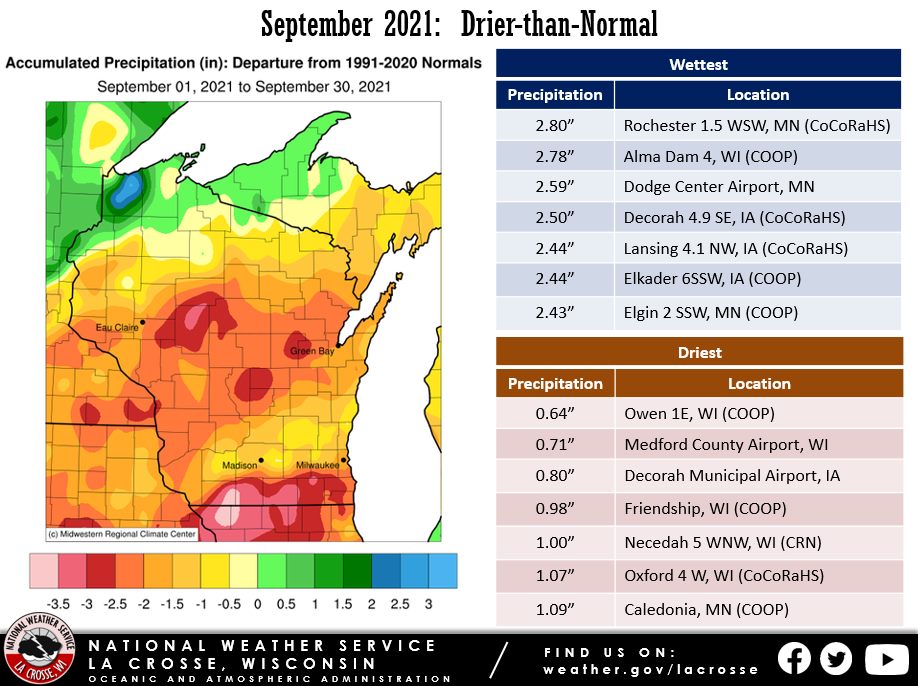
Rainfall ranged anywhere from 1 to 3.5" below normal across the Upper Mississippi River Valley. Rainfall values ranged from 0.64" at the Owen, WI cooperative observer to 2.80" in the Rochester area. September rainfall typically ranges from 3 to 4.4".
 |
 |
September 2021
Temperature Departures |
September 2021
​Rainfall Departures |
More details on the September 2021 climate in La Crosse WI and Rochester, MN can be found below.
La Crosse, WI...
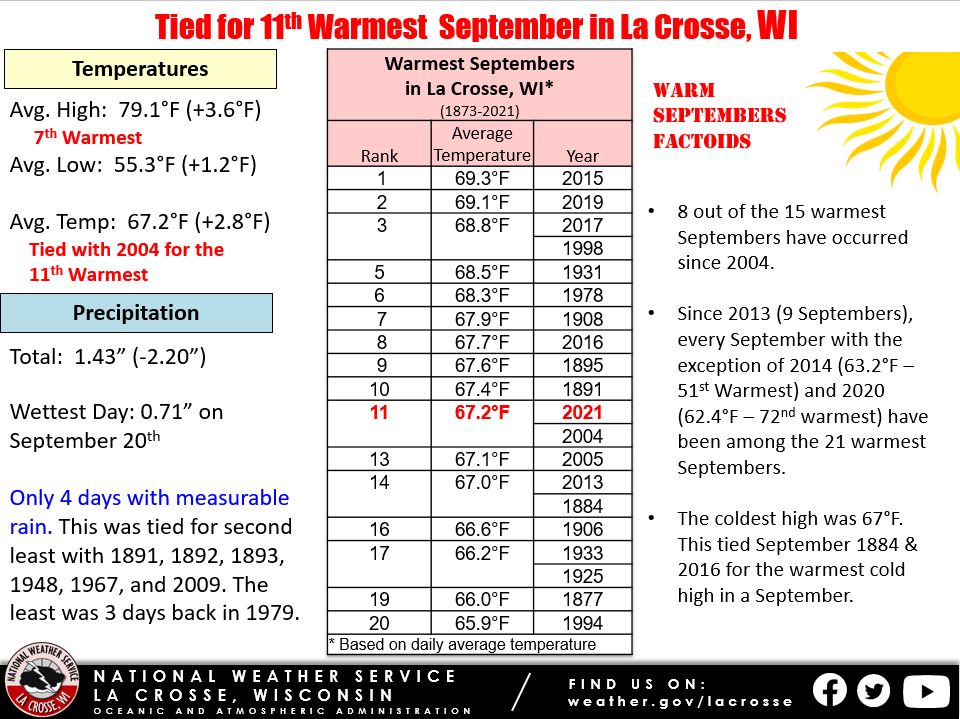
Tied for the 11th Warmest September in La Crosse, WI
September 2021 Highlights...
|
Temperatures - Tied for 11th Warmest with 2004
- The average temperature was 67.2°F at La Crosse Regional Airport. This was 2.4°F warmer than the 1991-2020 normal of 64.8°F. This was tied with 2004 for the 11th warmest September and the warmest since 2019 (69.1°F - 2nd warmest). Temperature records date back to 1873.
- 8 out of the 15 warmest Septembers have occurred since 2004.
- The high temperature averaged 79.1°F. This was 3.6°F warmer than the 1991-2020 normal of 75.5°F. This was the 7th warmest and the warmest since 2017 (80.5°F - 2nd warmest).
- The low temperature averaged 55.3°F. This was 1.2°F warmer than the 1991-2020 normal of 54.1°F.
|
 |
- The warmest temperature was 90°F on September 19. This was the 31st day with temperatures at or above 90 degrees. This was the 11th most for a calendar year and the most since 2012 (37 days - tied for 2nd with 1995).
- The warmest low temperature was 64°F on September 11, September 19, and September 20.
- The coldest high temperature was only 67°F on September 3. This was tied for the warmest cold September high with September 20, 1884, September 24, 1884, and September 28, 2016
- The coldest temperature was 43°F on September 18.
Rainfall - Below Normal
- A total of 1.43" of rain fell. This was 2.20" drier than the 1991-2020 normal of 3.63". This was the driest September since 2017 (0.95" - 9th driest).
- Measurable rain fell on just 4 days (13.3%). This was the least since 2009 (also 4 days). This was tied for second least in a September with 1891, 1892, 1893, 1948, 1967, and 2009. The least was 3 days back in 1979.
- Trace amounts fell on another 5 days (16.7%).
- The wettest day occurred September 20 when 0.71" fell.
- On the evening of September 20, severe weather occurred in La Crosse County. A 58 mph wind gust was reported at La Crosse Regional Airport. Wind damage was reported in the Mindoro area where trees were uprooted or snapped and a roof was blown off a structure.
Records...
Looking Ahead to October...
- The normal high temperature in La Crosse starts off at 69°F on the 1st and falls to 54°F by the end of the month. The normal low temperature starts off at 47°F on the 1st and falls to 36°F by the end of the month. The warmest October temperature on record is 93°F on October 6, 1963, and the coldest is 6°F on October 25, 1887.
- The normal mean temperature for the month is 51.7°F. La Crosse’s warmest October occurred in 1963 with an average temperature of 61.2°F, and their coldest October occurred in 1917 with an average temperature of 39.4°F.
- The normal October precipitation is 2.49". The wettest October occurred in 1881 with 12.09" of precipitation (second wettest month - only August 2007 was wetter with 13.75") and the driest October occurred in 1952 with only 0.02" of precipitation (third driest month - only November 1976 with a trace and December 1943 with 0.01 inches were drier). The wettest October day occurred on October 28, 1900, when 4.89" of rain fell (4th wettest calendar day). Normally, there are 2 days with thunderstorms.
- The normal October snowfall is 0.3". The snowiest October occurred in 1917 with 7" of snow. The snowiest October day occurred on October 28, 1917, when 4.7" of snow fell.
Rochester, MN...
Tied for the 18th Warmest September in Rochester MN
September 2021 Highlights...
|
Temperatures - Tied for 18th Warmest with 2018
- The average temperature was 63.1°F at Rochester International Airport. This was 2°F warmer than the 1991-2020 normal of 61.1°F. This was tied with 2018 for the 18th warmest September. Temperature records date back to 1886.
- 13 out of the 22 warmest Septembers have occurred since 2002.
- The high temperature averaged 75.2°F. This was 3.4°F warmer than the 1991-2020 normal of 71.8°F. This was the 14th warmest and the warmest since 2017 (75.5°F - 11th warmest).
- The low temperature averaged 51°F. This was 0.6°F warmer than the 1991-2020 normal of 50.4°F.
|
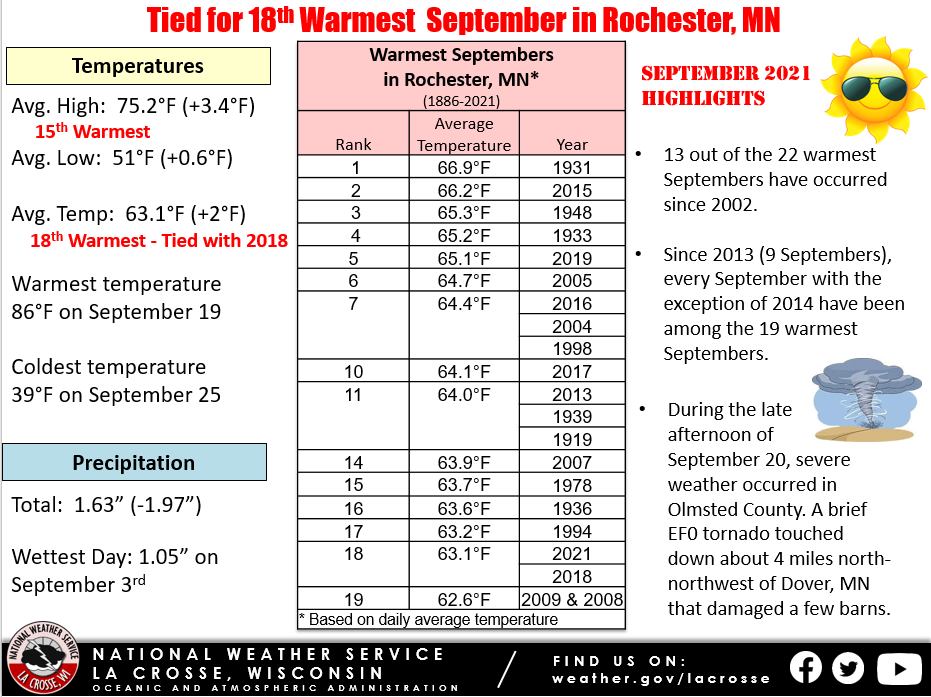 |
- The warmest temperature was 86°F on September 19.
- The warmest low temperature was 62°F on September 3.
- The coldest high temperature was 61°F on September 19.
- The coldest low temperature was 39°F on September 25.
Rainfall - Below Normal
- A total of 1.63" of rain fell. This was 1.97" drier than the 1991-2020 normal of 3.60". This was the driest September since 2013 (1.22" - 18th driest).
- Measurable rain fell on just 7 days (23.3%) and trace amounts fell on another 2 days (6.7%).
- The wettest day occurred on September 3 when 1.05" fell.
- During the late afternoon of September 20, severe weather occurred in Olmsted County. A brief EF0 tornado touched down about 4 miles north-northwest of Dover, MN that damaged a few barns. This was the first tornado in Olmsted County since June 4, 2019 (EF1 tornado near Rochester, MN).
Records...
Looking Ahead to October...
- The normal high temperature in Rochester starts off at 66°F on the 1st and falls to 50°F by the end of the month. The normal low temperature starts off at 44°F on the 1st and falls to 32°F by the end of the month. The warmest October temperature on record is 93°F on October 3, 1997, and the coldest is -6°F on October 25, 1887.
- The normal mean temperature for the month is 47.9°F. Rochester’s warmest October occurred in 1963 with an average temperature of 58.1°F, and their coldest October occurred in 1917 with an average temperature of 37.6°F.
- The normal October precipitation is 2.43". The wettest October occurred in 1911 with 9.11" of precipitation and the driest October occurred in 1952 with only 0.01" of precipitation. The wettest October day occurred on October 6, 1911, when 2.85" of precipitation fell. Normally, there are 2 days with thunderstorms.
- The normal October snowfall is 0.9". The snowiest October occurred in 2009 with 7.9" of snow. The snowiest October day occurred on October 22, 1979, when 5" of snow fell.

