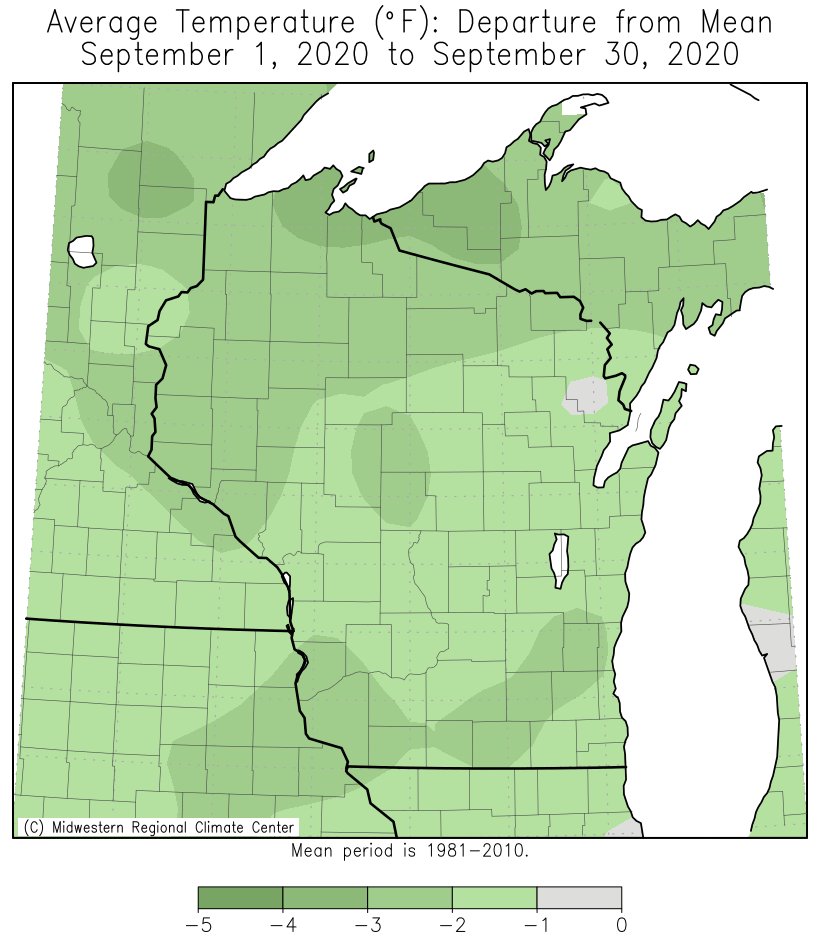
This was the first September since 2012 that temperatures averaged below normal across the Upper Mississippi River Valley. Average temperatures were up to 3F colder-than-normal. Average temperatures ranged from 53F at Medford County Airport to 63.2F in Decorah, IA. Rainfall was up to 3 inches drier-than-normal along and north of Interstate 90 and up to 4 inches wetter-than-normal south of Interstate 90. Rainfall totals ranged from 1.68 inches near Theilman, MN (Wabasha County) to 7.75 inches near Muscoda, WI (Grant County). Below are the temperature and rainfall anomalies across the region.
 |
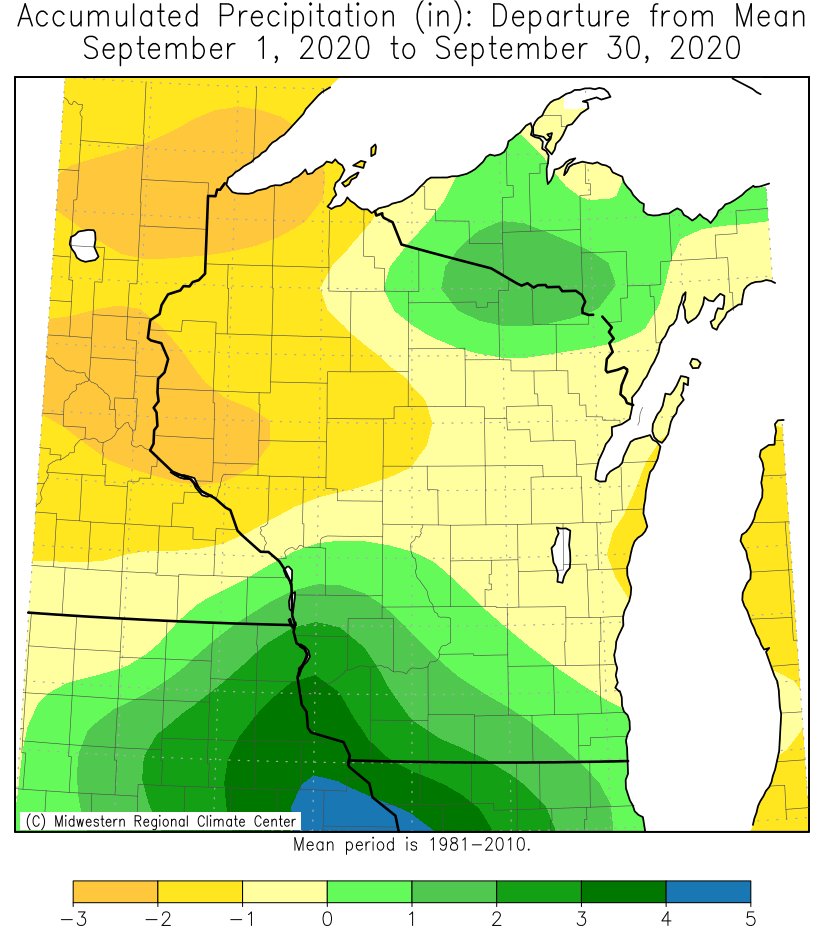 |
| September 2020 Temperature Departures | September 2020 Rainfall Departures |
September temperatures averaged 62.4F or 0.4F colder-than-normal. This ended a stretch of 7 straight Septembers with above-normal temperatures. This included the warmest (2015), 2nd warmest (2019), 4th warmest (2017), and 9th warmest (2016) Septembers. This is why this September felt so much colder than it actually was in reality. The last time we were this cool in a September was 2012 (61.4F).
Temperatures were highly variable during the month. Temperatures were below-normal on 15 days, above-normal on 14 days, and near-normal on 1 day. The coldest stretch of weather was from September 8-10. Record cold highs were tied on September 8 and broken on September 9. The warmest weather occurred on September 22-23 and September 25-26. During these time periods, temperatures averaged 11 degrees above normal.
Like temperatures, rainfall was also near normal. A total of 3.62 inches of rain fell which was 0.06 inches wetter-than-normal. This was the driest September since 2017 when just 0.95 inches of rain fell. The wettest day was September 24 when 1.33 inches of rain fell.
The average temperature in La Crosse for October is 50.2 degrees. The average high temperature falls from 67 degrees to 53 degrees through the month, while the average low temperature falls from 46 degrees to 36 degrees. The warmest October on record was in 1963 with an average of 61.2 degrees and the coldest was 39.4 degrees in 1917.
The average precipitation in October is 2.17 inches. The wettest October was in 1900 with 12.09 inches of precipitation, while the driest October occurred in 1952, with only 0.02 inches of precipitation. The average snowfall is 0.2 inches.
September temperatures averaged 59.2F or 1.7F colder-than-normal. This ended a stretch of 5 straight Septembers with above-normal temperatures. This included the 3rd warmest (2015), 6th warmest (2019), 8th warmest (2016), 11th warmest (2017), and 19th warmest (2018) Septembers. The last time we were this cool in a September was 2011 (59.3F).
Temperatures were highly variable during the month. Temperatures were below-normal on 17 days, above-normal on 12 days, and near-normal on 1 day. The coldest stretch of weather was from September 8-11. Record cold highs were broken on September 8, September 9, and September 10. The warmest weather occurred from September 21 to September 26 when temperatures averaged 9.6F above-normal.
A total of 2.81 inches of rain fell. This was 0.64 inches drier-than-normal. This was the driest September since 2017 when just 2.17 inches of rain fell. The wettest day was September 24 when 1.32 inches of rain fell.
The average temperature in Rochester for October is 48.4 degrees. The average high temperature falls from 65 degrees to 51 degrees through the month, while the average low temperature falls from 44 degrees to 34 degrees. The warmest October on record was 1963 with an average of 58.1 degrees, and the coldest October was 37.6 degrees in 1917.
The average precipitation in October is 2.24 inches. The wettest October was in 1911 with 9.11 inches of precipitation, while the driest October occurred in 1952, with only a trace of precipitation reported. The average snowfall 0.8 inches.

