Temperatures:
| During October 2023, average temperatures ranged from 46.2°F at Medford Taylor County Airport, WI (AWOS) to 54.9°F at Guttenberg Lock & Dam 10, IA in the Upper Mississippi River Valley. Temperature anomalies ranged from 1°F to 4°F warmer than normal. The hottest temperature was 92°F at Decorah, IA (COOP) on October 2. Meanwhile, the coldest temperature was 17F at Sparta Fort McCoy, WI (ASOS) on October 30. |
 |
Precipitation:
| Precipitation ended up wetter than normal across the Upper Mississippi River Valley. Precipitation varied from 1.97" at Elma, IA (COOP) to 10.03" near Ettrick, WI (CoCoRaHS). Precipitation anomalies ranged from near normal to 6" wetter than normal. The highest one-day precipitation was 6.23" at Black River Falls Sewage, WI (COOP) from October 24-25. |
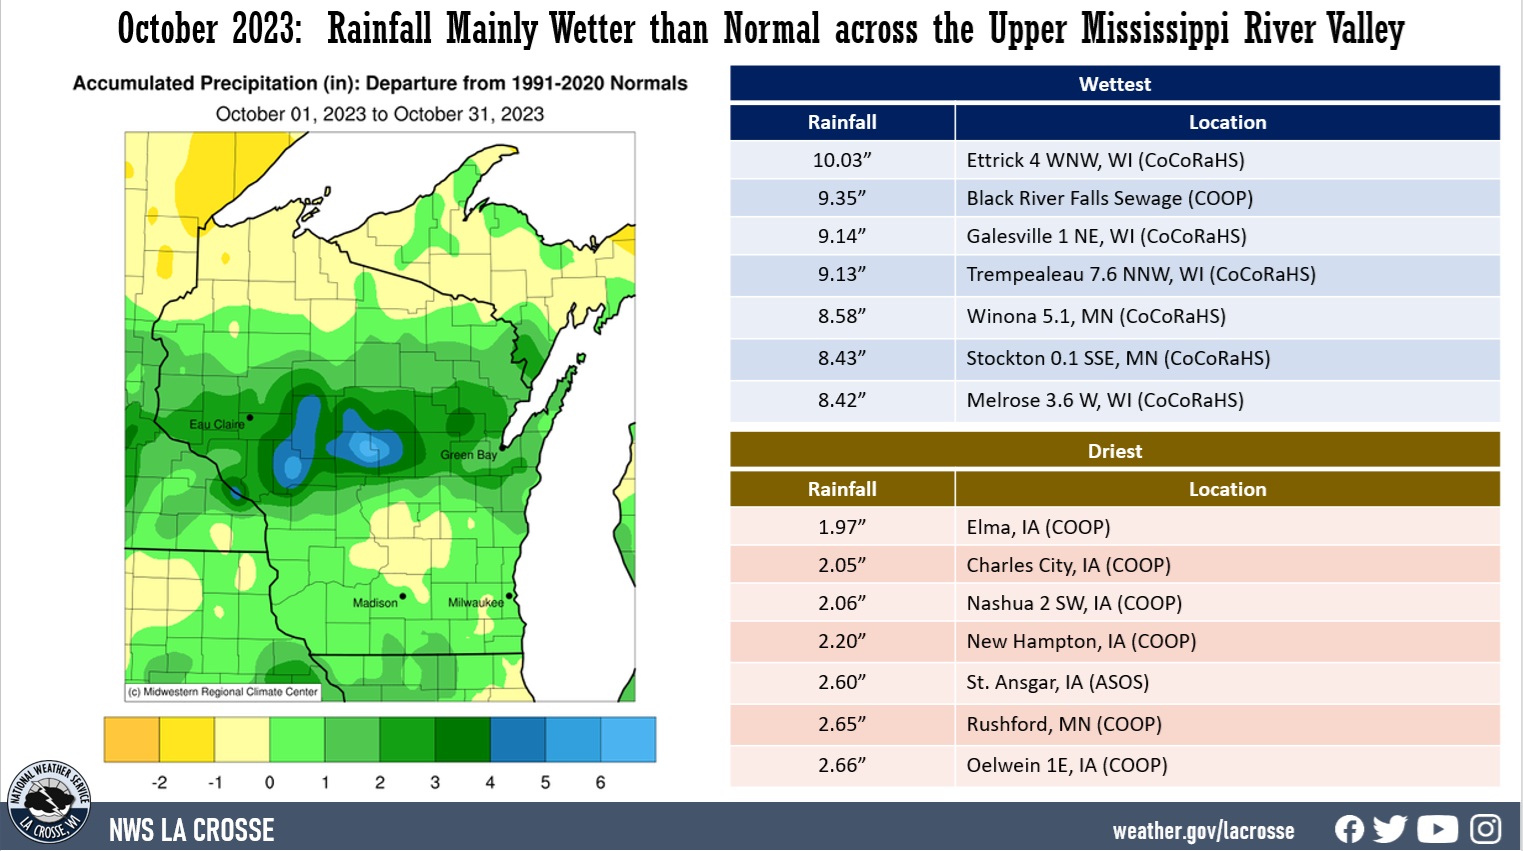 |
Abnormally dry (D0) to extreme (D3) drought continued across the Upper Mississippi River Valley. The drought was improving mainly north of Interstate 90 and in southwest Wisconsin. There have been little improvements in northeast Iowa.
There were 2 convective warnings (2 severe thunderstorm warnings) in October. The long-term average (1986-2023) for October is 2 severe weather warnings.
Snowfall:
| Monthly snowfall was near to above normal. Snow totals ranged from a trace to 2" near Elgin, MN, and Preston, MN. These snow totals were near normal to 2" snowier than normal. The highest one-day snowfalls were 2.0" near Elgin, MN (COOP), Preston, MN (COOP), and Medford, WI (COOP) from October 30-31. |
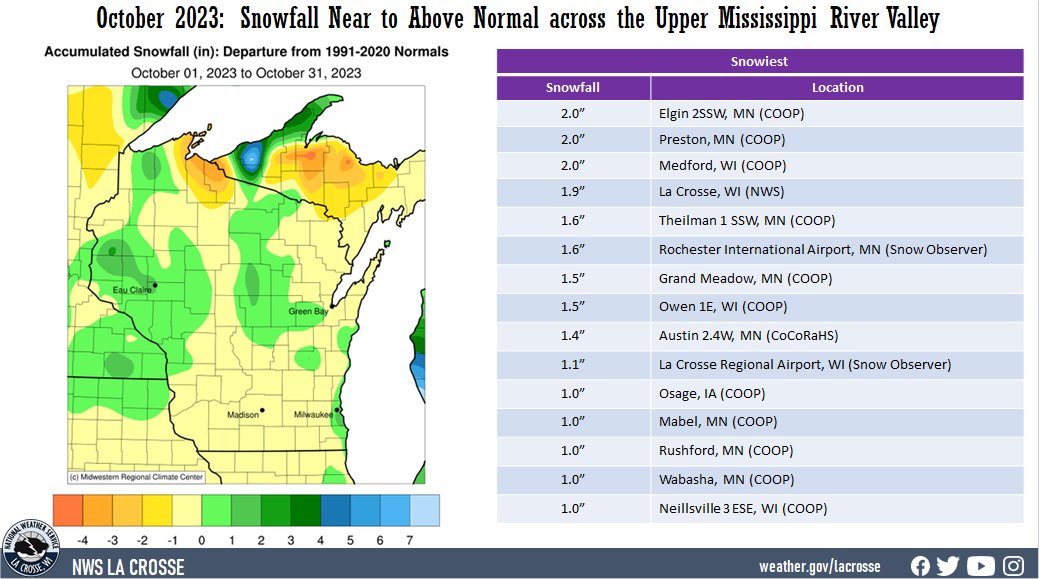 |
The October climate summaries for La Crosse, WI, and Rochester, MN.
La Crosse, WI
October 2023 was Warmer, Wetter, and Snowier than Normal in La Crosse, WI
...October 2023 Highlights...
Temperatures - Warmer than Normal
- During October 2023, the average temperature was 53.2°F at La Crosse Regional Airport. This was 1.5°F warmer than the 1991-2020 normal of 51.7°F. This was the 3rd consecutive month with above-normal temperatures. 5 out of the last 6 months have been warmer than normal.
- The average high temperature was 61.5°F. This was 0.1â–‘°F colder than the 1991-2020 normal of 61.6°F.
- the average low temperature was 44.8°F. This was 2.9°F warmer than the 1991-2020 normal of 41.9°F.
|
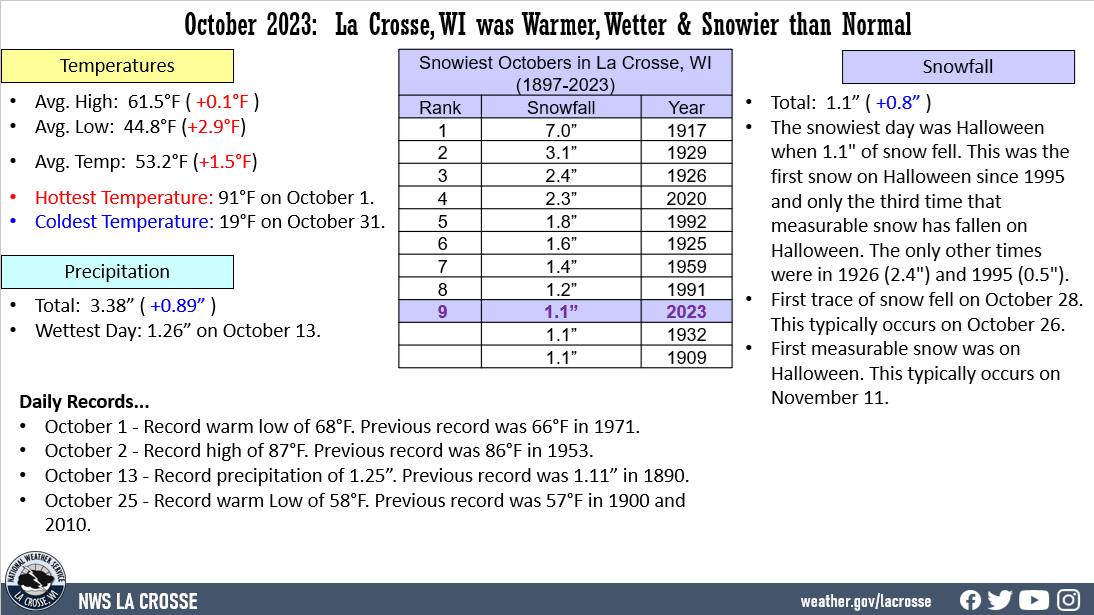 |
- The hottest temperature was 91°F on October 1. This was tied with October 3, 1997, for the third hottest October temperature. The only days which were warmer were October 6, 1963 (93°F) and October 1, 1976 (92°F).
- The coldest high temperature was 37°F on October 31.
- The warmest low was 68°F on October 1.
- The coldest temperature was 25°F on October 31.
Precipitation - 29th Wettest October
- A total of 3.38 inches of precipitation fell at La Crosse Regional Airport. This was 0.89" wetter than the 1991-2020 normal of 2.49".
- This was the first month to be wetter than normal since July 2023.
- The wettest day was 1.25" on October 13.
- Precipitation fell on 14 days. There were 11 days (35.5%) with measurable precipitation and 3 days (9.7%) with a trace of precipitation.
Snowfall - Tied for 9th Snowiest
There was a total of 1.1" of snow measured by the snow observer near La Crosse Regional Airport. This was 0.8" greater than the 1991-2020 normal of 0.3". This October was tied for the 9th snowiest October with 1909 and 1932. Below are the 10 Snowiest Octobers.
Snowiest Octobers
in La Crosse, WI
1897-2023
Rank Snowfall Year
---- -------- ----
1 7.0 inches 1917
2 3.1 inches 1929
3 2.4 inches 1926
4 2.3 inches 2020
5 1.8 inches 1992
6 1.6 inches 1925
7 1.4 inches 1959
8 1.2 inches 1991
9 1.1 inches 2023
1.1 inches 1932
1.1 inches 1909
- The first trace of snow of the 2023-24 snow season fell on October 28. This typically occurs on October 26.
- The snowiest day was Halloween when 1.1" of snow fell. This was the first snow on Halloween since 1995 and only the third time that measurable snow has fallen on Halloween. The only other times were in 1926 (2.4") and 1995 (0.5"). This was the first measurable snow of the 2023-24 snow season. This typically occurs on November 11.
- Snow fell on 2 days. Measurable snow fell on 1 day (3.2%) and a trace on yet another day (3.2%).
...Records...
Daily...
- October 1 - Record warm low of 68°F. Previous record was 66°F in 1971.
- October 2 - Record high of 87°F. Previous record was 86°F in 1953.
- October 13 - Record precipitation of 1.25". Previous record was 1.11" in 1890.
- October 25 - Record warm Low of 58°F. Previous record was 57°F in 1900 and 2010.
...Looking Ahead to November...
- The normal high temperature in La Crosse starts off at 53°F on November 1st and falls to 38°F by the end of the month. The normal low temperature starts off at 35°F on the 1st and falls to 23°F by the end of the month. The warmest November temperature on record is 80°F on November 1, 1933, and the coldest is -21°F on November 29, 1875.
- The normal mean temperature for November is 37.6°F. La Crosse’s warmest November occurred in 2001 with an average temperature of 47.5°F, and their coldest November occurred in 1880 with an average temperature of 25°F.
- The normal November precipitation is 1.85". The wettest November occurred in 1934 with 7.01" of precipitation and the driest November occurred in 1976 with just a trace of precipitation (driest month ever in La Crosse). The wettest November day occurred on November 1, 1990, when 2.80" of precipitation fell. Normally, there is 1 day with thunderstorms.
- The normal November snowfall is 3.4". The snowiest November occurred in 1991 with 30.3" of snow and the least snow was none in 1949 and 1999. The snowiest November day occurred on November 23, 1991, when 13" of snow fell.
Rochester, MN
October 2023 was Warmer, Wetter, and Snowier than Normal in Rochester, MN
...October 2023 Highlights...
Temperatures - 30th Warmest October
- During October 2023, the average temperature was 50.1°F at Rochester International Airport. This was 2.2°F warmer than the 1991-2020 normal of 47.9°F. This was the 3rd consecutive month with above-normal temperatures. 5 out of the last 6 months have been warmer than normal.
- The average high temperature was 59.5°F. This was the 1.6°F warmer than the 1991-2020 normal of 57.9°F.
- The average low temperature was 40.8°F. This was 2.8°F above the 1991-2020 normal of 38°F.
|
 |
- The hottest temperature was 90°F on October 1. This was tied with October 2, 1953, and October 9, 2010, for the second hottest October temperature. The only day that was warmer was October 3, 1997 (93°F).
- The coldest high temperature was 32°F on October 28.
- The warmest low was 65°F on October 1.
- The coldest temperature was 19°F on October 30.
Precipitation - 7th Wettest October
- A total of 4.78" of precipitation fell at Rochester International Airport. This was 2.35" wetter than the 1991-2020 normal of 2.43". This was the 7th wettest October and the wettest since 2019 (5.71 inches). Below are the 10 Wettest Octobers.
Wettest Octobers
in Rochester, MN
1886-2023
Rank Precipitation Year
---- ------------- ----
1 9.11 inches 1911
2 7.57 inches 2009
3 6.08 inches 1970
4 5.71 inches 2019
5 5.09 inches 2017
6 4.95 inches 1979
7 4.78 inches 2023
8 4.71 inches 1998
9 3.86 inches 1966
10 3.83 inches 1941
- The wettest day was 2.26" on October 24. This was the 4th wettest October day. Only October 6, 1911 (2.85"); October 14, 1966 (2.81"); and October 16, 1911 (2.35") were wetter.
- Precipitation fell on 13 days. There were 10 days (32.3%) with measurable precipitation and 3 days (9.7%) with a trace of precipitation.
Snowfall - Tied for 14th Snowiest
There was a total of 1.6 inches of snow measured by the snow observer near Rochester International Airport. This was 0.7 inches greater than the 1991-2020 normal of 0.9 inches. This October was tied with 2018 for the 14th snowiest October. Below are the 15 Snowiest Octobers.
Snowiest Octobers
in Rochester, MN
1910-2023
Rank Snowfall Year
---- -------- ----
1 7.9 inches 2009
2 6.6 inches 1929
3 5.5 inches 1917
4 5.4 inches 1979
5 4.5 inches 1991
6 4.2 inches 2020
7 4.0 inches 1930
8 2.9 inches 1976
9 2.6 inches 2017
2.6 inches 1989
11 2.3 inches 1995
12 2.2 inches 1981
13 2.1 inches 1969
14 1.6 inches 2023
1.6 inches 2018
- The snowiest day was Halloween when 1.1" of snow fell. This was the first snow on Halloween since 1995 (1.7"). Measurable snow has fallen on 9 Halloweens since 1910.
- Measurable snow fell on 3 days (9.7%) and there were no traces of snow.
...Records...
Daily...
- October 1 - Record high of 90°F. Previous record was 88°F in 1976.
- October 24 - Record precipitation of 2.26". Previous record was 1.18" in 1946.
- October 28 - Record snow of 0.4". Previous record was 0.2" in 1933 and 2015.
- October 28 - Tied cold high record of 32°F with 2017.
...Looking Ahead to November...
- The normal high temperature in Rochester starts off at 49°F on November 1st and falls to 34°F by the end of the month. The normal low temperature starts off at 32°F on the 1st and falls to 19°F by the end of the month. The warmest November temperature on record is 77°F on November 1, 1893, and the coldest is -24°F on November 28, 1887.
- The normal mean temperature for November is 33.6°F. Rochester’s warmest November occurred in 2001 with an average temperature of 45.4°F, and its coldest November occurred in 1985 with an average temperature of 22.9°F.
- The normal November precipitation is 1.80". The wettest November occurred in 1909 with 5.91" of precipitation and the driest November occurred in 1917 with only 0.01". The wettest November day occurred on November 1, 1991, when 2.30" of precipitation fell. Normally, there is 1 day with thunderstorms.
- The normal November snowfall is 4.5". The snowiest November occurred in 1985 with 22.5" of snow and the least snow was none in 1913 and 1939. The snowiest November day occurred on November 30, 1934, when 12" of snow fell.

