|
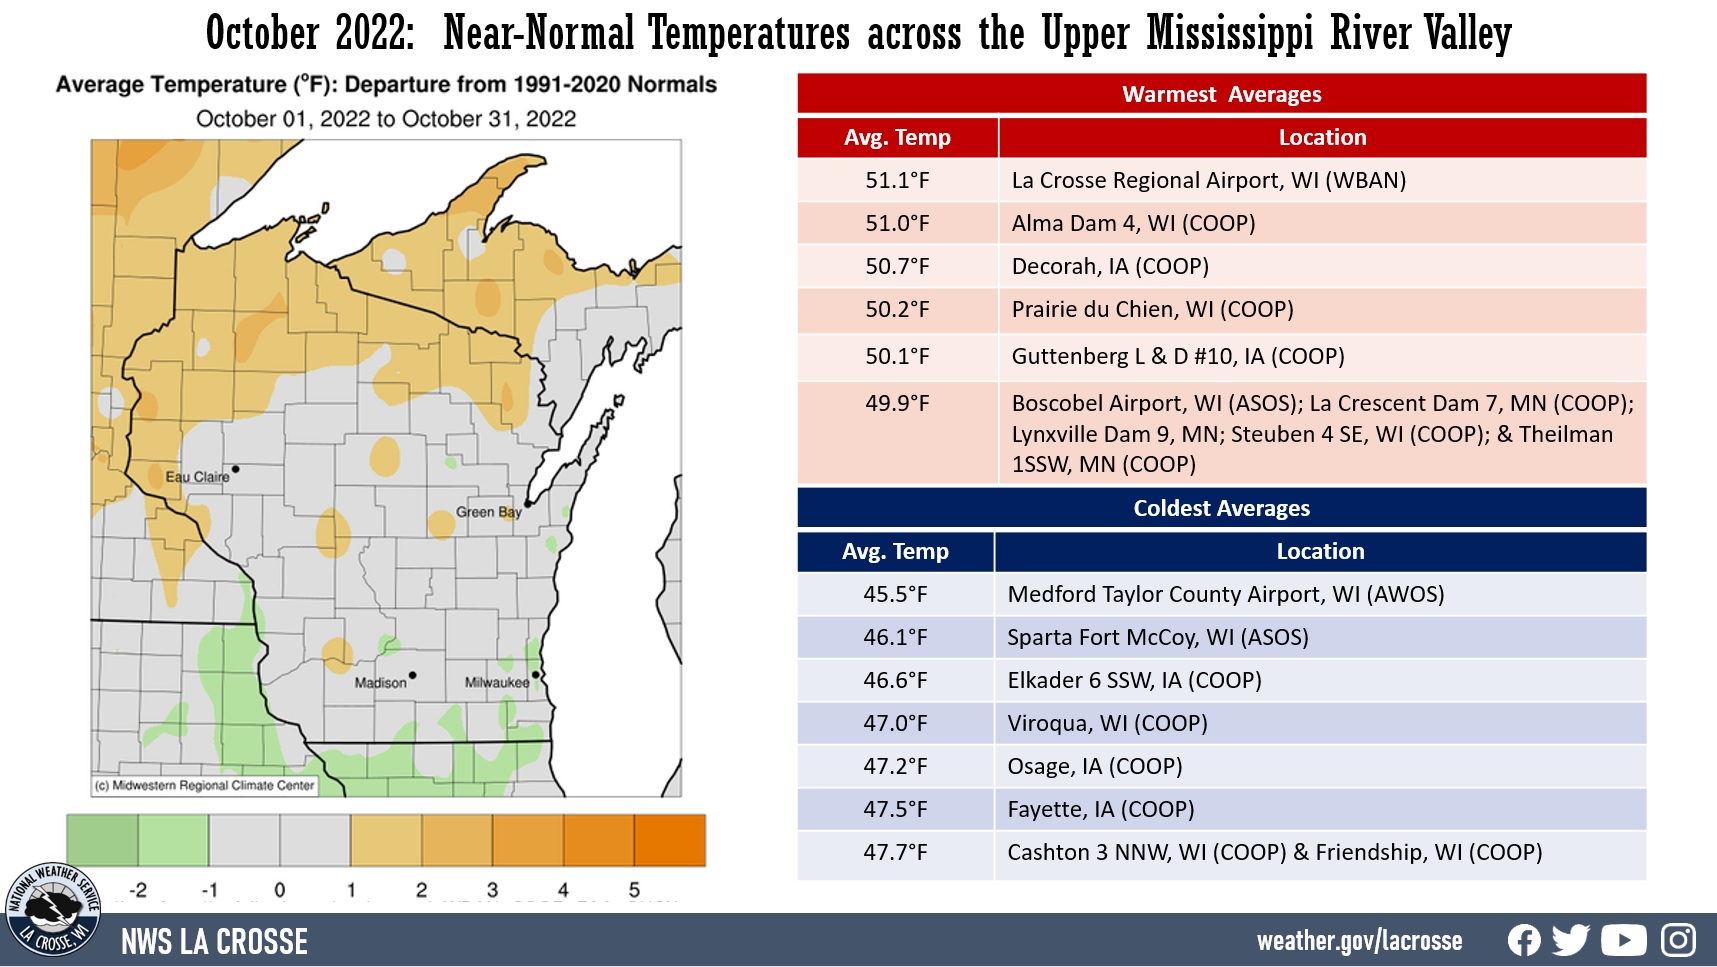
Upper Mississippi River Valley Temperatures - Near Normal
During October 2022, temperatures averaged near-normal across the Upper Mississippi River Valley. Monthly average temperatures ranged from 45.5°F at Medford Taylor County Airport, WI (AWOS) to 51.1°F at La Crosse Regional Airport, WI (ASOS). Temperature anomalies ranged from 2°F colder-than-normal to 2°F warmer-than-normal. The hottest temperature was 86°F near Oelwein, IA (COOP) on October 23, and the coldest temperature was 14°F at Osage, IA (COOP) & Sparta Fort McCoy Airport, WI (ASOS) on October 19.
|
 |
|
Upper Mississippi River Valley Precipitation Summary - Mainly Drier-than-Normal
October was drier-than-normal across the Upper Mississippi River Valley. Rainfall anomalies ranged from 0.5" to 2.5” drier-than-normal across the Upper Mississippi River Valley. Rain totals ranged from 0.35” at Dodge Center, MN (AWOS) to 2.22” in Fayette, IA (COOP). The greatest 1-day rainfall was 1.80" at Fayette, IA (COOP). This rain fell from 7 AM on October 24 to 7 AM on October 25.
|
.jpg) |
Several COOP observers’ rainfall totals were among their 20 driest for the month of October. This included St. Ansgar, IA which had its driest October with just 0.56” of rain. Their previous record was 1.10” in 2020. Their precipitation records date back to 2007. The following table contains those climate stations that had one of their driest 20 Octobers.
|
Climate Stations in which October 2022 was Among Their Driest Octobers
|
|
Location
|
2022 Precipitation
|
Rank
|
Driest
|
Records Began
|
| Austin Waste Water Treatment Facility, MN |
0.48" |
8th |
0.00" in 1952 |
1937 |
| St. Ansgar, IA |
0.56" |
1st |
Previous Record 1.10” in 2020 |
2007 |
| Alma Dam 4, WI |
0.58" |
Tied for 6th with 1950 |
0.12" in 1952 |
1937 |
| Charles City, IA |
0.68" |
15th |
Trace in 1952 |
1893 |
| Rochester International Airport, MN |
0.70" |
16th |
0.01" in 1952 |
1886 |
| Ionia 2W, IA |
0.85" |
5th |
0.32" in 2005 |
2002 |
| Steuben, 4 SE, WI |
0.92" |
9th |
0.00" in 1975 |
1974 |
| Minnesota City Dam 5A, MN |
0.96" |
15th |
0.04" in 1953 |
1939 |
| Guttenberg Lock & Dam 10, IA |
0.99" |
18th |
T in 1952 |
1937 |
For the second October in a row, there were no severe weather warnings. The long-term (1987-2022) average is 1 severe thunderstorm warning. The most active October was back in 2006 when there were 17 severe thunderstorm warnings. During that October, there were 5 warnings on the afternoon of the 2nd and the remainder of the warnings were issued from the evening of 4th and early morning of 5th.
|
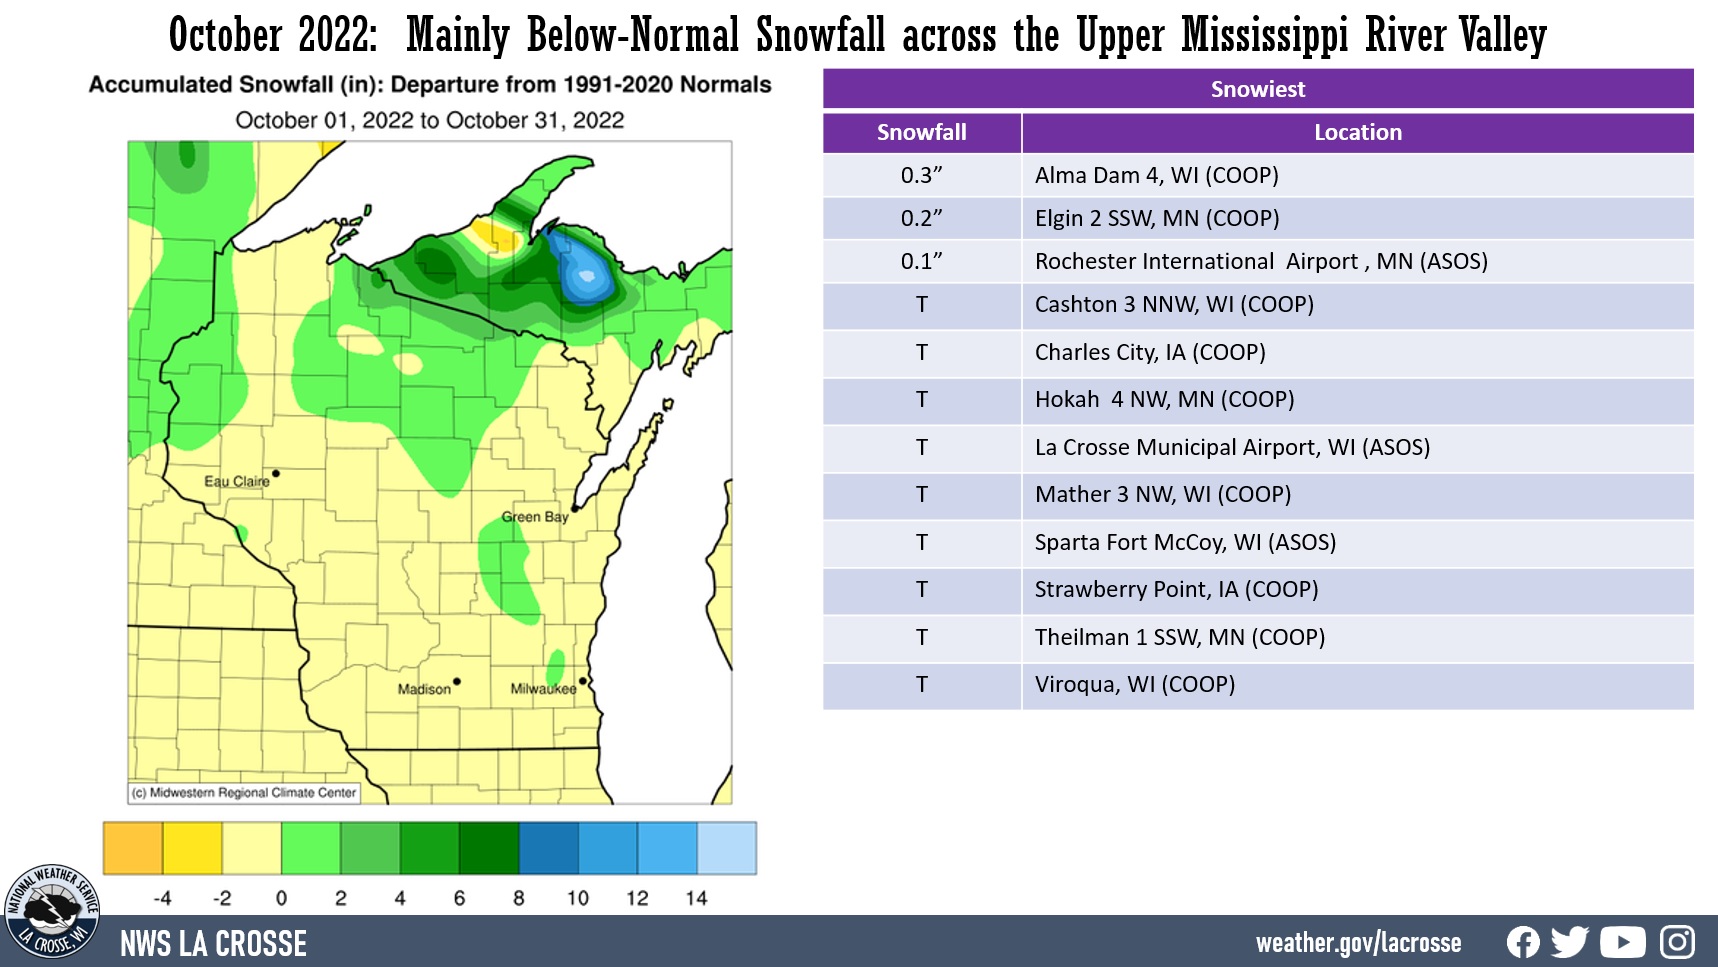
Upper Mississippi River Valley Snowfall Summary - Mainly Below Normal
Snowfall was below normal for the month. The following locations reported measurable snow: Alma Dam 4, WI (0.3"), Elgin 2 SSW, MN (0.2"), and Rochester International Airport (0.1"). Much of the rest area saw a trace of snow. Typically in October less than an inch of snow falls across the area.
|
 |
Below are the October 2022 climate summaries for La Crosse, WI, and Rochester, MN.
La Crosse, WI
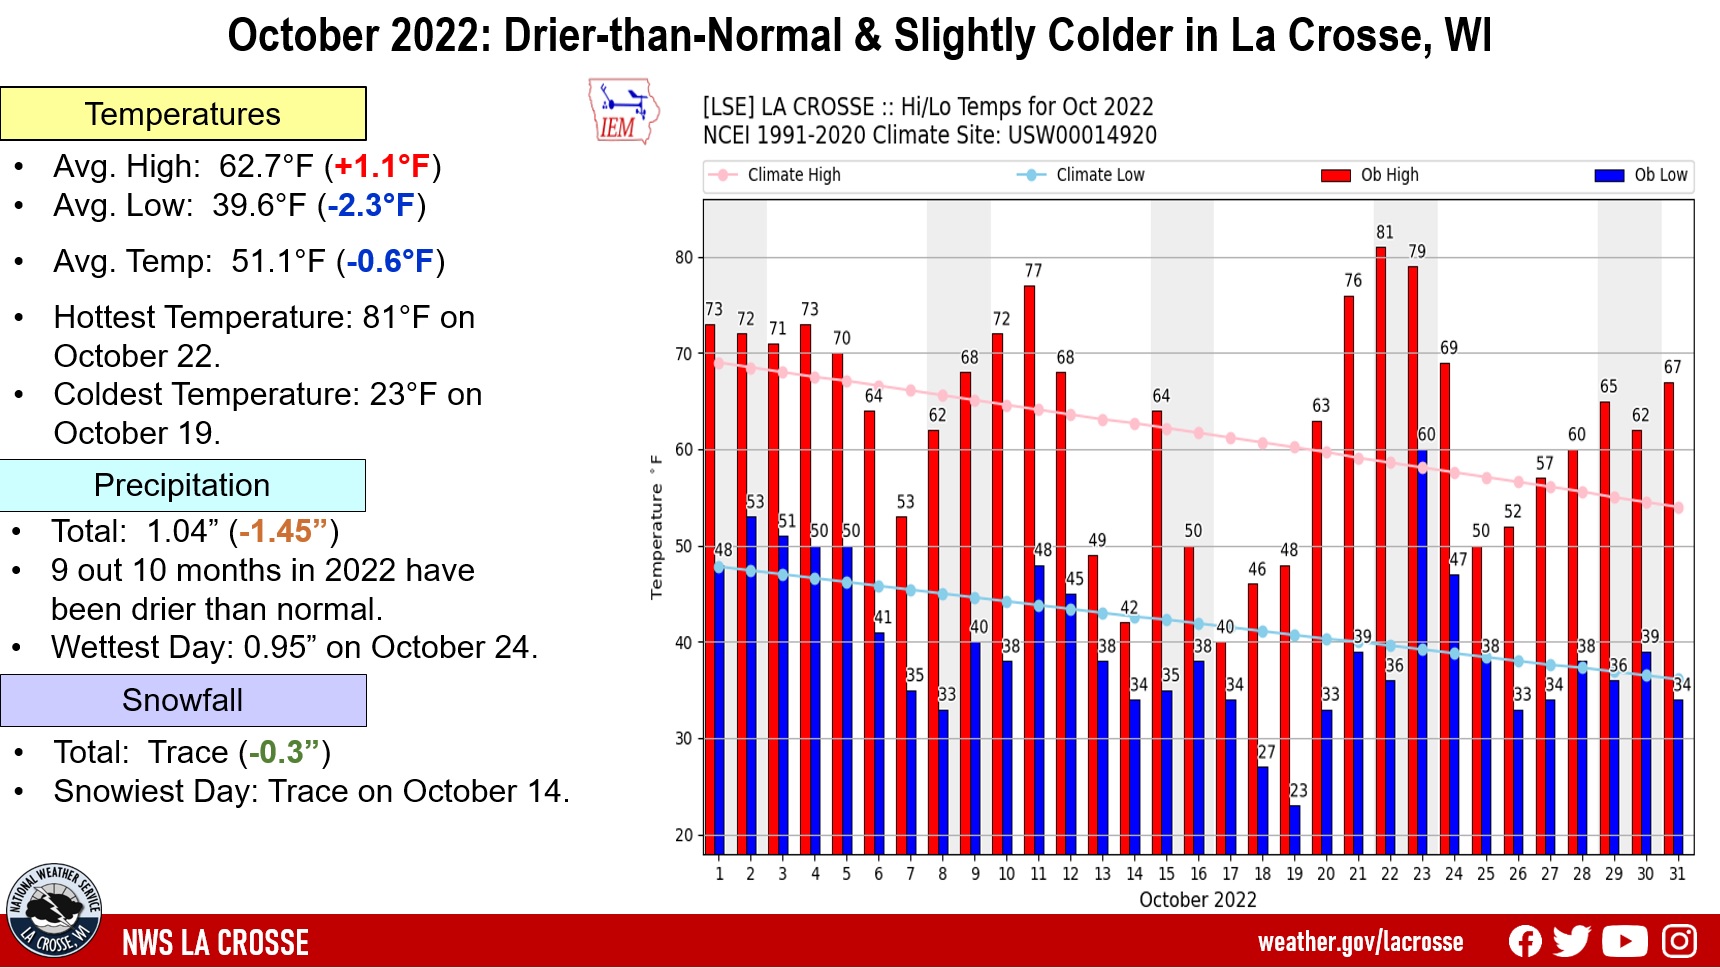
October 2022 was Dry and Slightly Cooler in La Crosse WI
...October 2022 Highlights...
|
Temperatures - Slightly Cooler than Normal
- The average temperature was 51.1°F at La Crosse Regional Airport. This was 0.6°F cooler than 1991-2010 normal of 51.7°F.
- The average high temperature was 62.7°F. This was 1.1°F warmer than 1991-2010 normal of 61.6°F.
- The average low temperature was 39.6°F. This was 2.3°F colder than 1991-2010 normal of 41.9°F.
- The hottest temperature was 81°F on October 22.
- The coldest temperature was 23°F on October 19.
|
 |
- The first 32°F temperature or colder for the autumn occurred on October 18 (27°F). This typically occurs on October 11. The earliest date was September 13 in 1902 and the latest date was November 9 (2016).
Precipitation - Tied for 31st Driest
Snowfall - Below Normal
- A trace of snow fell during October. This was 0.3" below 1991-2020 normal of 0.3".
- This snow fell on October 14. This was the first snow of the 2022-23 snow season. The first trace of snow of a snow season typically occurs on October 26. This was the earliest snow in the snow season since October 2019 (October 11). The earliest trace in the snow season was September 23 in 1928.
October 2022 Records...
Looking Ahead to November...
- The normal high temperature in La Crosse starts off at 53°F on November 1st and falls to 38°F by the end of the month. The normal low temperature starts off at 35°F on the 1st and falls to 23°F by the end of the month. The warmest November temperature on record is 80°F on November 1, 1933, and the coldest is -21°F on November 29, 1875.
- The normal mean temperature for November is 37.6°F. La Crosse’s warmest November occurred in 2001 with an average temperature of 47.5°F, and their coldest November occurred in 1880 with an average temperature of 25°F.
- The normal November precipitation is 1.85". The wettest November occurred in 1934 with 7.01" of precipitation and the driest November occurred in 1976 with just a trace of precipitation (driest month ever in La Crosse). The wettest November day occurred on November 1, 1990, when 2.80" of precipitation fell. Normally, there is 1 day with thunderstorms.
- The normal November snowfall is 3.4". The snowiest November occurred in 1991 with 30.3" of snow and the least snow was none in 1949 and 1999. The snowiest November day occurred on November 23, 1991, when 13" of snow fell.
Rochester, MN
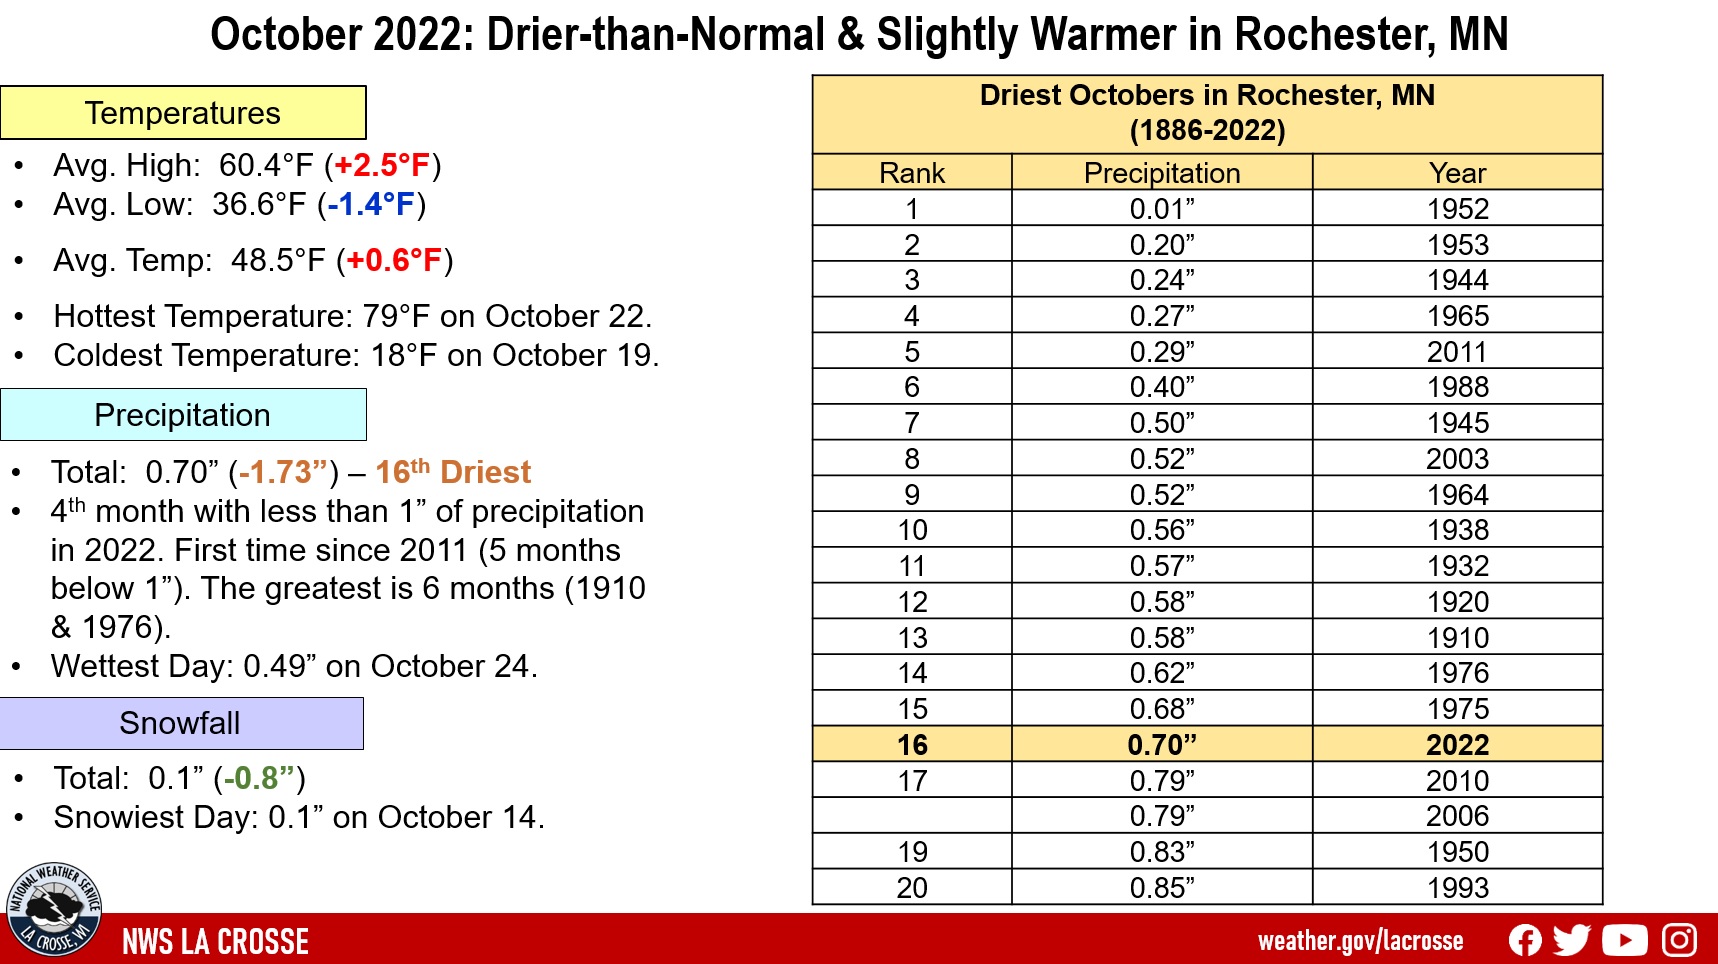
October 2022 was Dry and Slightly Warmer in Rochester MN
...October 2022 Highlights...
|
Temperatures - Slightly Warmer than Normal
- The average temperature was 48.5°F at Rochester International Airport. This was 0.6°F warmer than 1991-2010 normal of 47.9°F.
- The average high temperature was 60.3°F. This was 2.4°F warmer than the 1991-2010 normal of 57.9°F.
- The average low temperature was 36.6°F. This was 1.4°F colder than 1991-2010 normal of 38°F.
- The hottest temperature was 79°F on October 22.
- The coldest temperature was 18°F on October 19.
|
 |
- The first 32°F temperature or colder for the autumn occurred on October 7 (27°F). This typically occurs on September 30. The earliest date was August 30 in 1915 and the latest date was October 29 (1973).
Precipitation - 16th Driest
- A total of 0.70" of precipitation fell. This was 1.73" drier than 1991 to 2020 normal of 2.43". This was the 16th driest October and the driest since 2011 (0.29"). The driest October occurred back in 1952 (0.01"). Here are the 20 driest Octobers for Rochester, MN.
Driest Octobers
in Rochester, MN
1886-2022
October
Rank Precipitation Year
---- ------------- ----
1 0.01 inches 1952
2 0.20 inches 1953
3 0.24 inches 1944
4 0.27 inches 1965
5 0.29 inches 2011
6 0.40 inches 1988
7 0.50 inches 1945
8 0.52 inches 2003
0.52 inches 1964
10 0.56 inches 1938
11 0.57 inches 1932
12 0.58 inches 1920
0.58 inches 1910
14 0.62 inches 1976
15 0.68 inches 1975
16 0.70 inches 2022
17 0.79 inches 2010
0.79 inches 2006
19 0.83 inches 1950
20 0.85 inches 1993
- 4th month with less than 1” of precipitation in 2022. First time since 2011 (5 months below 1”). The greatest is 6 months (1910 & 1976).
- Measurable precipitation fell on 6 days (19.4%) and a trace of precipitation fell on 3 days (9.7%).
- The wettest day was October 24 when 0.49" of rain fell. This was 70% of the monthly precipitation.
- There were 2 days with thunderstorms and no days with dense fog.
Snowfall - Below Normal
- A total of 0.1" of snow fell. This was 0.8" below 1991 to 2020 normal of 0.9".
- The snowiest day was October 14 when 0.1" of snow fell. This was the first snow of the 2022-23 snow season. The first trace of snow typically falls on October 20 and the first measurable snow typically falls on November 3.
October 2022 Records...
Looking Ahead to November...
- The normal high temperature in Rochester starts off at 49°F on November 1st and falls to 34°F by the end of the month. The normal low temperature starts off at 32°F on the 1st and falls to 19°F by the end of the month. The warmest November temperature on record is 77°F on November 1, 1893, and the coldest is -24°F on November 28, 1887.
- The normal mean temperature for November is 33.6°F. Rochester’s warmest November occurred in 2001 with an average temperature of 45.4°F, and its coldest November occurred in 1985 with an average temperature of 22.9°F.
- The normal November precipitation is 1.80". The wettest November occurred in 1909 with 5.91" of precipitation and the driest November occurred in 1917 with only 0.01". The wettest November day occurred on November 1, 1991, when 2.30" of precipitation fell. Normally, there is 1 day with thunderstorms.
- The normal November snowfall is 4.5". The snowiest November occurred in 1985 with 22.5" of snow and the least snow was none in 1913 and 1939. The snowiest November day occurred on November 30, 1934, when 12" of snow fell.

