|
October 2021 Temperatures
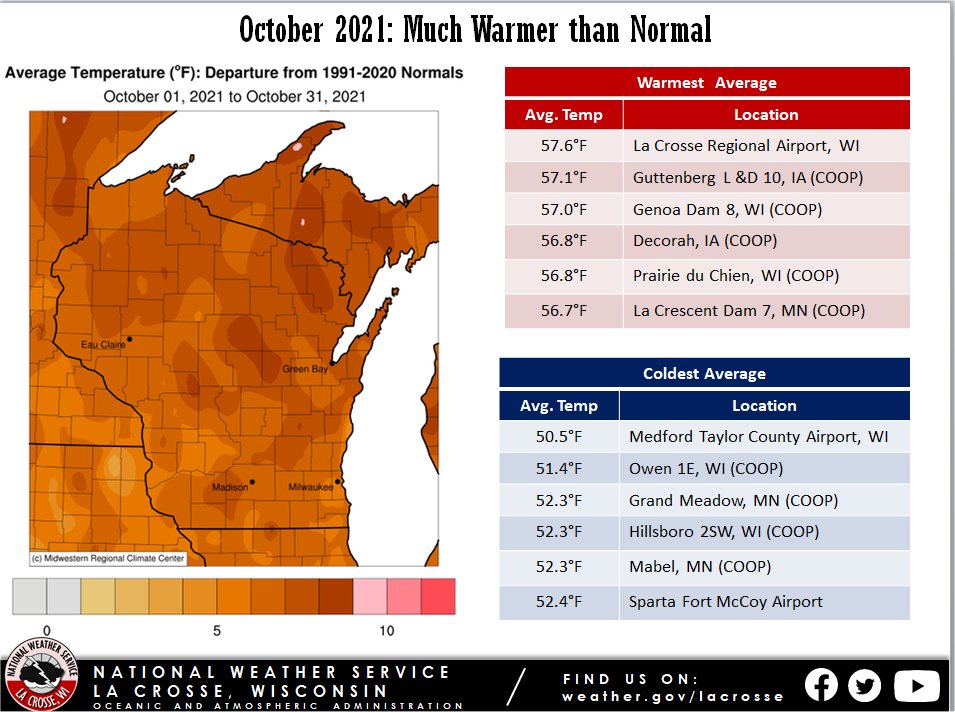
During October 2021, average temperatures in the Upper Mississippi River Valley were much warmer-than-normal ranging from 2 to 7 degrees above normal. The average temperatures ranged from 50.5°F at Medford Taylor County Airport to 57.6°F at La Crosse Regional Airport. October average temperatures typically range from 45°F to 50°F.
La Crosse WI had their 5th warmest October and warmest since 1963. Rochester MN had its 10th warmest October and warmest since 2007.
Above-normal October temperatures are not that unusual during La Niñas. Out of the 24 La Niñas since 1949-50 13 of them had well above-normal temperatures and 8 were near normal. Only 3 La Niñas saw well below-normal temperatures (1954-55, 1988-89, and 2020-21).
|
 |
The hottest temperature was 89°F near Oelwein, IA and Theilman, MN on October 1. Meanwhile, the coldest temperature was 20°F at Sparta Fort McCoy Airport and Black River Falls, WI on October 26.
|
|
October 2021 Rainfall
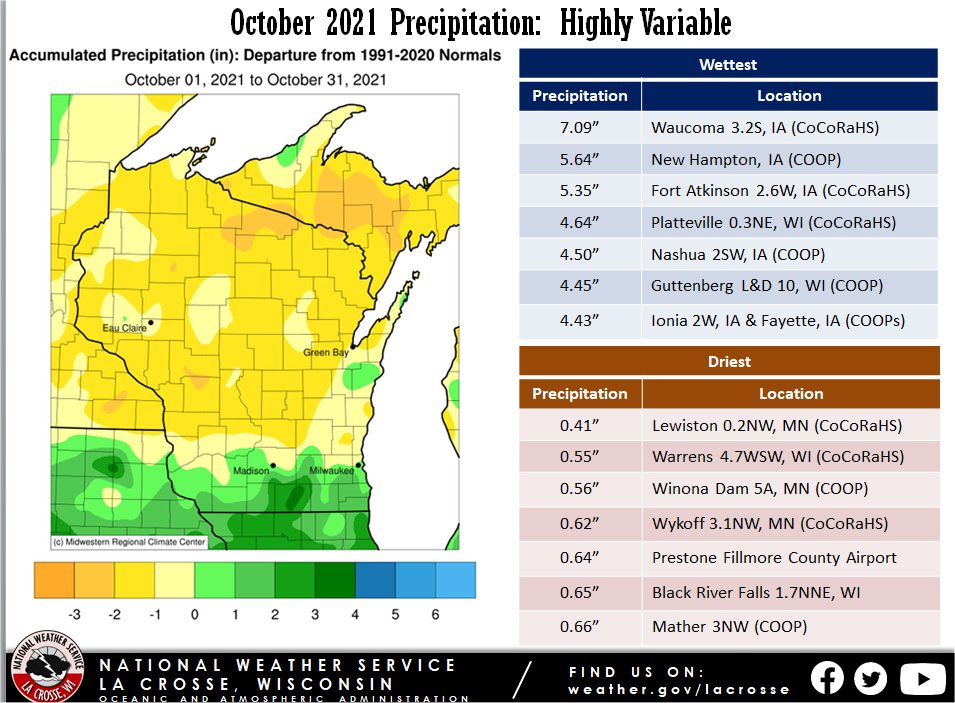
October rainfall was highly variable across the Upper Mississippi River Valley. Rainfall deficits were up to 3" below normal across southeast Minnesota and in west-central, central, and north-central Wisconsin. Meanwhile, they ranged from near-normal to 4 inches wetter than normal in northeast Iowa and southwest Wisconsin. The driest location was reported by a CoCoRaHS observer near Lewiston, MN (0.41"). The wettest location was reported by a CoCoRaHS observer near Waucoma, IA (7.90"). October rainfall typically ranges from 2.4 to 3".
|
 |
More details on the October 2021 climate in La Crosse WI and Rochester, MN can be found below.
La Crosse, WI
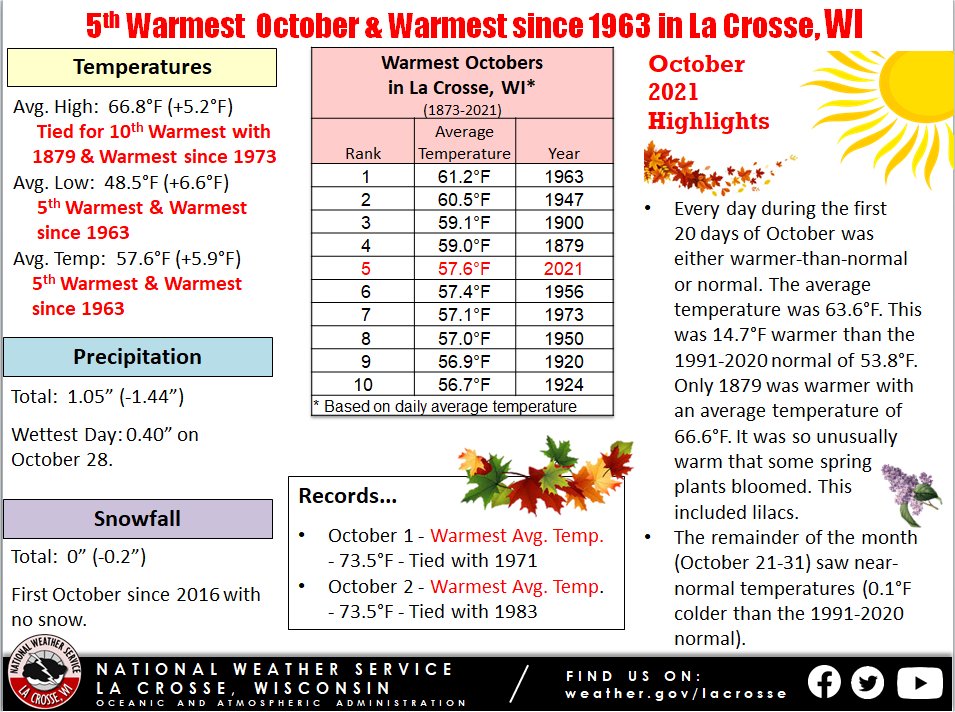
5th Warmest October and Warmest Since 1963 in La Crosse, WI
October 2021 Highlights...
|
Temperatures...5th Warmest October and Warmest Since 1963
- The first 20 days of October were either warmer-than-normal (19 days) or normal (1 day - October 16). The average temperature was 63.6°F. This was 14.7°F warmer than the 1991-2020 normal of 53.8°F. Only 1879 was warmer with an average temperature of 66.6°F. It was so unusually warm that some spring plants rebloomed. This included lilacs.
- The remainder of the month was more seasonable with an average temperature of 46.8°F. This was 0.1°F below the 1991-2020 normal 46.9°F. These days included 6 days that were below normal, 4 days that were above normal, and 1 day which was normal.
|
 |
- Average temperature was 57.6°F. This was 5.9°F warmer than the 1991-2020 normal of 51.7°F. This was the 5th warmest October and the warmest since 1963 (61.2°F - warmest October).
- Average high temperature was 66.8°F. This was 5.2°F warmer than the 1991-2020 normal of 61.6°F. Tied with 1879 for the 10th warmest in October and the warmest since 1973 (67.6°F - 7th warmest in October).
- Average low temperature was 48.5°F. This was 6.6°F warmer than the 1991-2020 normal of 41.9°F. This was the 5th warmest in October and the warmest since 1963 (51.1°F - 3rd warmest in October).
- The warmest temperature was 85°F on October 1.
- The coldest temperature was 32°F on October 23 and October 26.
Precipitation...Driest October since 2006
- A total of 1.05" of rain fell which was 1.44" drier than the 1991-2020 of 2.49". This was the driest October since 2006 (0.90").
- The wettest day was 0.40" on October 28.
- Measurable rain fell on 10 days and a trace of rain fell on 4 days.
Snowfall...
- No snow fell. This was 0.2" below the 1991-2020 normal of 0.2". This was the first October without any snow since 2016. During 2020, there were 2.3 inches (4th most in October).
Records...
- October 1 - Warmest Avg. Temp. - 73.5°F - Tied with 1971
- October 2 - Warmest Avg. Temp. - 73.5°F - Tied with 1983
Looking ahead to November...
- The normal high temperature in La Crosse starts off at 53°F on November 1st and falls to 38°F by the end of the month. The normal low temperature starts off at 35°F on the 1st and falls to 23°F by the end of the month. The warmest November temperature on record is 80°F on November 1, 1933, and the coldest is -21°F on November 29, 1875.
- The normal mean temperature for the month is 37.6°F. La Crosse’s warmest November occurred in 2001 with an average temperature of 47.5°F, and their coldest November occurred in 1880 with an average temperature of 25°F.
- The normal November precipitation is 1.85". The wettest November occurred in 1934 with 7.01" of precipitation and the driest November occurred in 1976 with just a trace of precipitation (driest month ever in La Crosse). The wettest November day occurred on November 1, 1990, when 2.80" of precipitation fell. Normally, there is 1 day with thunderstorms.
- The normal November snowfall is 3.4". The snowiest November occurred in 1991 with 30.3" of snow and the least snow was none in 1949 and 1999. The snowiest November day occurred on November 23, 1991, when 13" of snow fell.
Rochester, MN
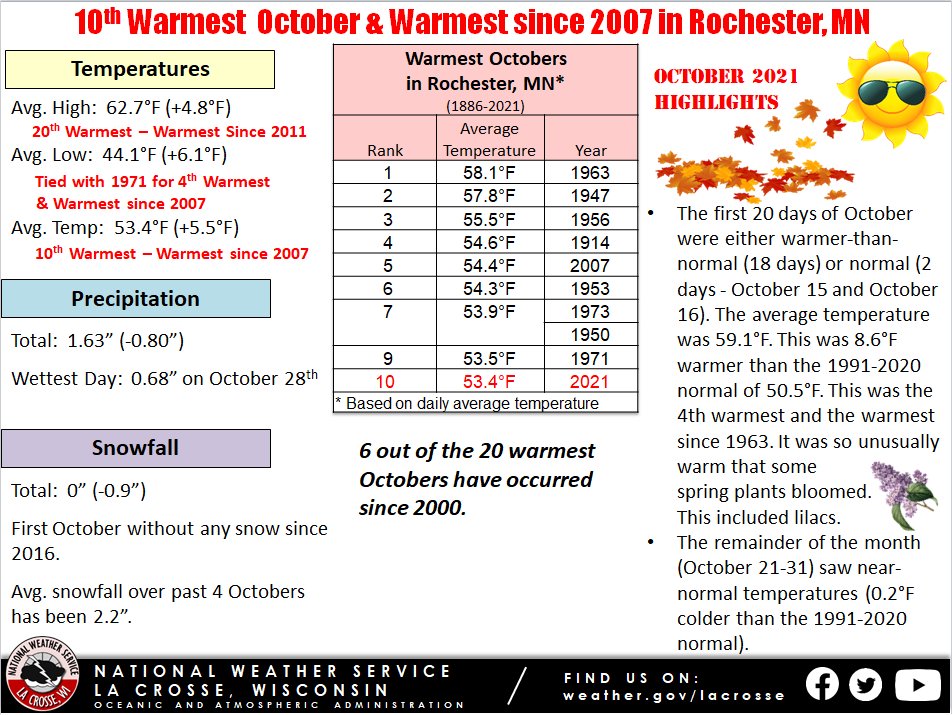
10th Warmest October and Warmest Since 2007 in Rochester, MN
October 2021 Highlights...
|
Temperatures...10th Warmest October
- Every day during the first 20 days of October was either warmer-than-normal (18 days) or normal (2 days - October 15 and October 16). The average temperature was 59.1°F. This was 8.6°F warmer than the 1991-2020 normal of 50.5°F. This was the 4th warmest and the warmest since 1963. It was so unusually warm that some spring plants rebloomed. This included lilacs.
- The remainder of the month was more seasonable with an average temperature of 43.1°F. This was 0.2°F below the 1991-2020 normal 43.3°F. These days included 5 days that were below normal, 5 days that were above normal, and 1 day which was normal.
|
 |
- Average temperature was 53.4°F. This was 5.5°F warmer than the 1991-2020 normal of 47.9°F. This was the 10th warmest October and the warmest since 2007 (54.4°F - 5th warmest October).
- Average high temperature was 62.7°F. This was 4.8°F warmer than the 1991-2020 normal of 57.9°F. This was the 20th warmest in October and the warmest since 2011 (64.5°F - 12th warmest in October).
- Average low temperature was 44.1°F. This was 6.1°F warmer than the 1991-2020 normal of 38°F. This was tied with 1971 for the 4th warmest in October and the warmest since 2007 (45.9°F - 3rd warmest in October).
- The warmest temperature was 83°F on October 1.
- The coldest temperature was 28°F on October 23.
Precipitation...Driest October since 2006
- A total of 1.63" of rain fell. This was 0.80" drier than the 1991-2020 of 2.43".
- The wettest day was 0.68" on October 28.
- Measurable rain fell on10 days and a trace of rain fell on 4 days.
Snowfall...
- No snow fell. This was 0.9" below the 1991-2020 normal of 0.9". This was the first October without any snow since 2016.
- The average snowfall over the past 4 Octobers has been 2.2". During 2020, there were 4.2 inches (6th most in October).
Records...
Looking ahead to November...
- The normal high temperature in Rochester starts off at 49°F on November 1st and falls to 34°F by the end of the month. The normal low temperature starts off at 32°F on the 1st and falls to 19°F by the end of the month. The warmest November temperature on record is 77°F on November 1, 1893, and the coldest is -24°F on November 28, 1887.
- The normal mean temperature for the month is 33.6°F. Rochester’s warmest November occurred in 2001 with an average temperature of 45.4°F, and their coldest November occurred in 1985 with an average temperature of 22.9°F.
- The normal November precipitation is 1.80". The wettest November occurred in 1909 with 5.91" of precipitation and the driest November occurred in 1917 with only 0.01". The wettest November day occurred on November 1, 1991, when 2.30" of precipitation fell. Normally, there is 1 day with thunderstorms.
- The normal November snowfall is 4.5". The snowiest November occurred in 1985 with 22.5" of snow and the least snow was none in 1913 and 1939. The snowiest November day occurred on November 30, 1934, when 12" of snow fell.