Upper Mississippi River Climate Summary for November 2024:
Temperatures - Above Normal
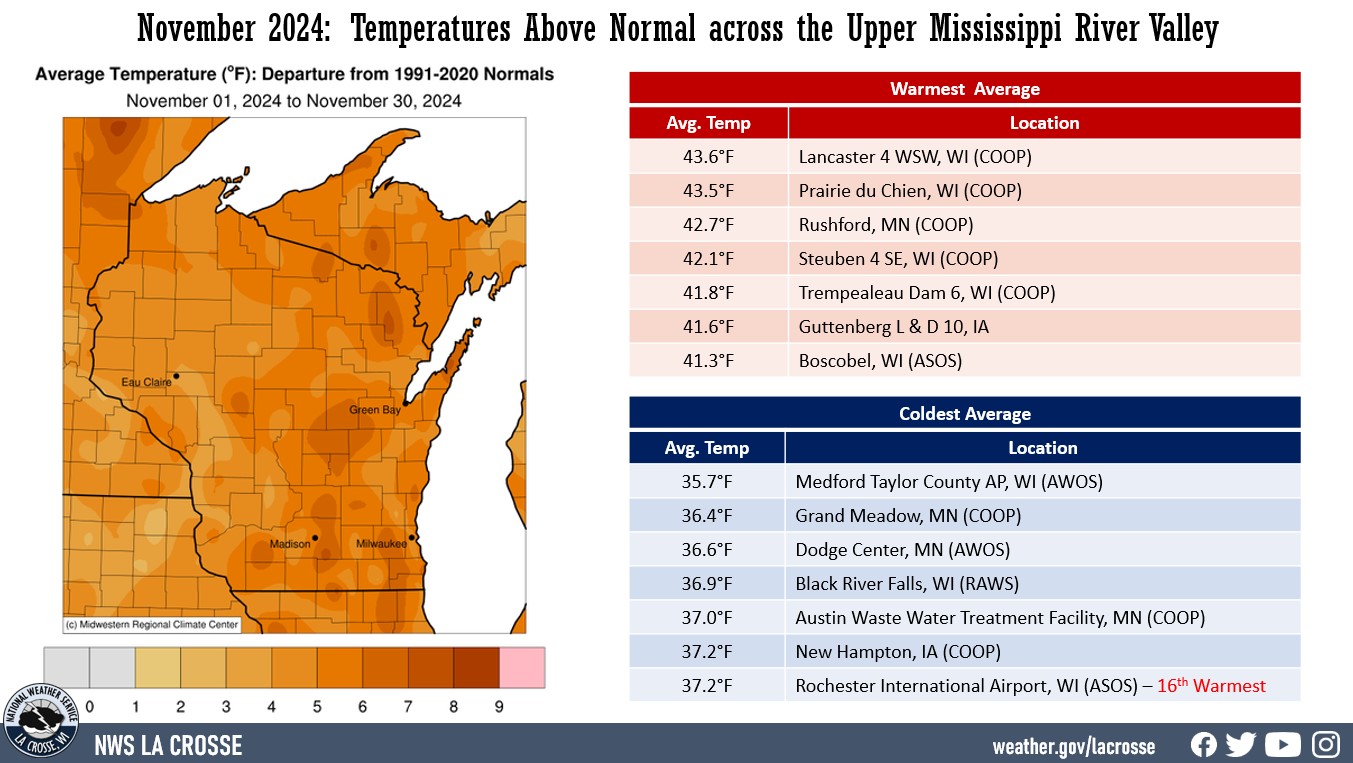
- During November 2024, average temperatures ranged from 35.7°F at Medford Taylor County Airport, WI (AWOS) to 43.6°F near Lancaster, WI (ASOS).
- Temperature anomalies ranged from 2 to 5°F warmer-than-normal.
- There was a 65°F difference between the warmest and coldest temperatures in the Upper Mississippi River Valley.
- The warmest temperature was 68°F at Boscobel, WI (AWOS) on November 4. Meanwhile, the coldest temperature was 3°F at Austin, MN (COOP) and Grand Meadow, MN (COOP) on November 30.
|
 |
Precipitation - Wetter than Normal
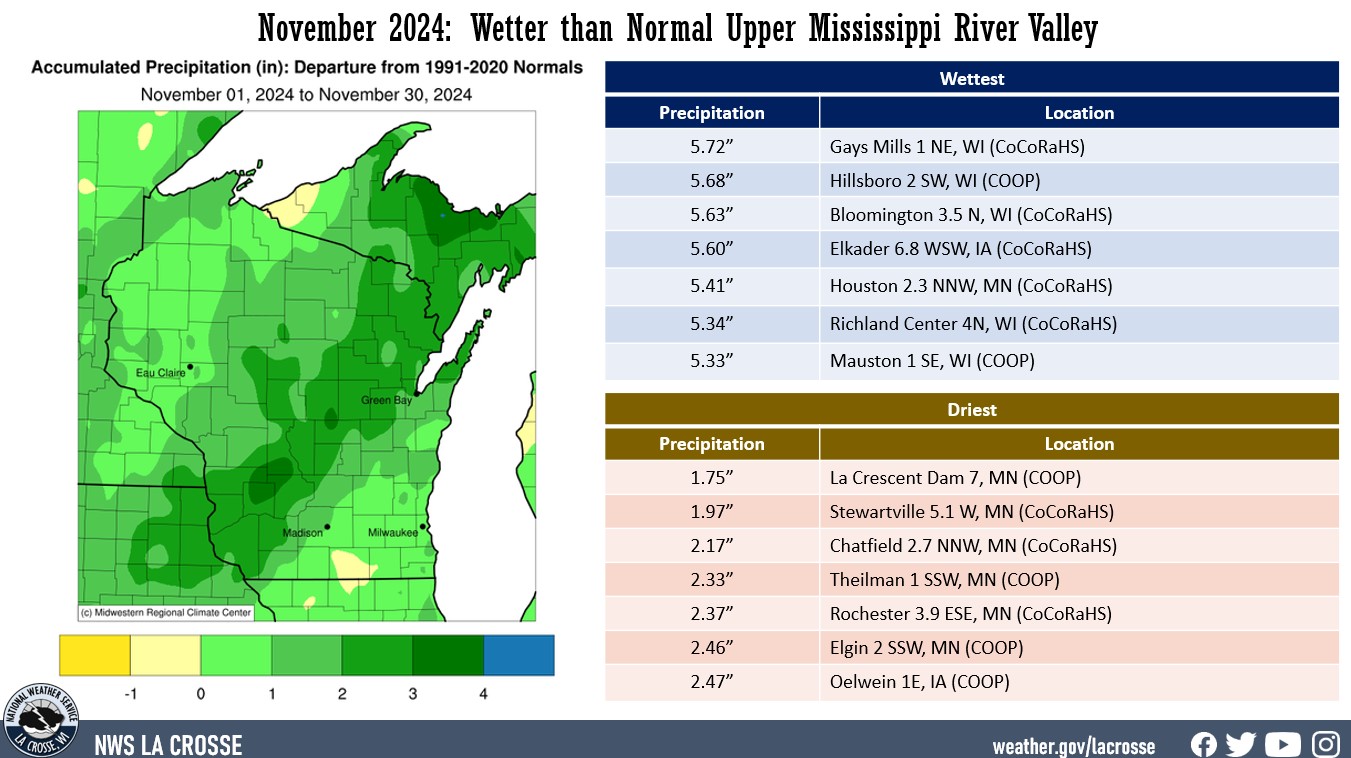
- Precipitation totals varied from 1.75" at La Crescent Dam 7, MN (CoCoRaHS) to 5.72" near Gays Mills, WI (CoCoRaHS).
- Rainfall anomalies ranged from a 1 to 4" wetter than normal.
- The highest one-day precipitation was 2.21" near Waucoma, IA (CoCoRaHS) from November 2 to November 3.
|
 |
| Snowfall - Less than Normal |
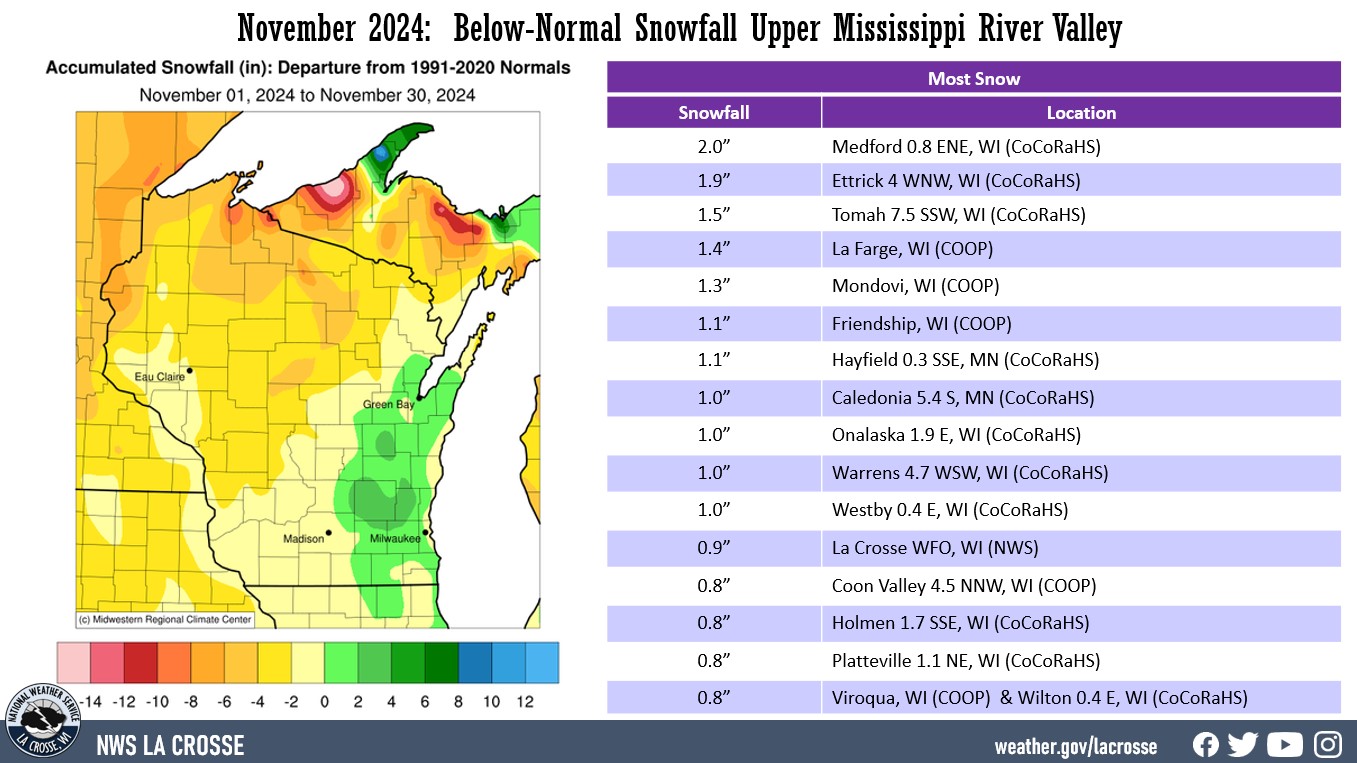
- Snowfall totals varied from a trace to 2" near Medford, WI (CoCoRaHS).
- Snowfall anomalies ranged from near-normal to 4" below normal.
- The highest one-day snowfall was 1.2" near La Farge, WI (COOP) from November 20 to November 21.
|
 |
Below are the November 2024 climate summaries for La Crosse, WI, and Rochester, MN.
La Crosse, WI
November 2024 - Warmer and Wetter than Normal in La Crosse, WI
...November 2024 Highlights...
Temperatures - Tied for 15th Warmest
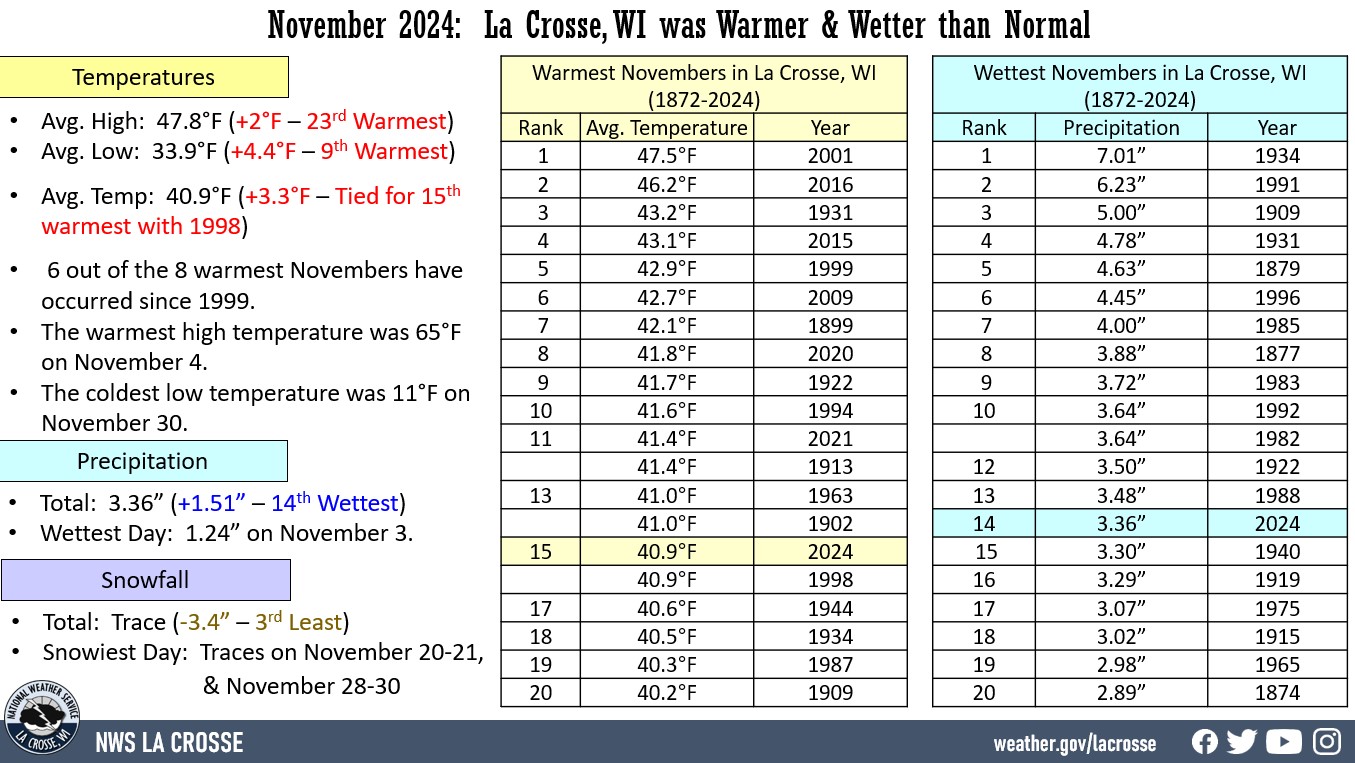
- During November 2024, the average temperature was 40.9°F at La Crosse Regional Airport.
- This was 3.3°F warmer than the 1991-2020 normal of 37.6°F. 6 out of the 8 warmest Novembers have occurred since 1999.
- Through November 25th, this November was the 6th warmest (averaging 44.4°F or 5.6°F warmer than normal). During the remainder of the month, the average temperature was 23°F or 8.8°F colder than normal. This resulted in this November being tied with 1998 for the 15th warmest.
|
 |
- The table below contains the 20 warmest Novembers for La Crosse, WI.
Warmest Octobers
20 Warmest Novembers
in La Crosse WI
1872-2024
Rank Avg Temp Year
---- -------- ----
1 47.5°F 2001
2 46.2°F 2016
3 43.2°F 1931
4 43.1°F 2015
5 42.9°F 1999
6 42.7°F 2009
7 42.1°F 1899
8 41.8°F 2020
9 41.7°F 1922
10 41.6°F 1994
11 41.4°F 1990
41.4°F 1913
13 41.0°F 1963
41.0°F 1902
15 40.9°F 2024
40.9°F 1998
17 40.6°F 1944
18 40.5°F 1934
19 40.3°F 1987
20 40.2°F 1909
- The average high temperature was 47.8°F. This was 2°F warmer than the 1991-2020 normal of 45.8°F. This was the 23rd warmest.
- The average low temperature was 33.9°F. This was 4.4°F warmer than the 1991-2020 normal of 29.5°F. This was the 9th warmest.
- The warmest high temperature was 65°F on November 4.
- The warmest low temperature was 52°F on November 4.
- The coldest high temperature was 22°F on November 30.
- The coldest low temperature was 11°F on November 30.
Precipitation - 14th Wettest
- A total of 3.36" of precipitation fell.
- This was 1.51" wetter than the 1991-2020 normal of 1.85".
- This was the 14th wettest November and the wettest November 1996 (4.45" - 6th wettest November).
- The table below contains the 20 wettest Novembers in La Crosse, WI.
20 Wettest Novembers
in La Crosse WI
1872-2024
Rank Precipitation Year
---- ------------- ----
1 7.01 inches 1934
2 6.23 inches 1991
3 5.80 inches 1909
4 4.78 inches 1931
5 4.63 inches 1879
6 4.45 inches 1996
7 4.00 inches 1985
8 3.88 inches 1877
9 3.72 inches 1983
10 3.64 inches 1992
3.64 inches 1982
12 3.50 inches 1922
13 3.48 inches 1988
14 3.36 inches 2024
15 3.30 inches 1940
16 3.29 inches 1919
17 3.07 inches 1975
18 3.02 inches 1915
19 2.98 inches 1965
20 2.89 inches 1874
- The wettest day was 1.24" on November 3.
- Measurable precipitation fell on 11 days (36.7%) and another 5 days (16.7%) had a trace of precipitation.
Snowfall - Tied for the 3rd Least
- A trace of snow was reported by the official snow observer near La Crosse Regional Airport.
- This was 3.4" below the 1991-2020 normal of 3.4".
- This was tied for the 3rd least with 13 other years. Only 1949 and 1999 had less (0").
- The snowiest November was 30.3" in 1991.
- The table below contain the 20 Novembers with the least amount of snow in La Crosse, WI.
Least Amount of
November Snowfall
in La Crosse, WI
1896-2024
Rank Snowfall Year
---- -------- ----
1 0.0 inches 1999
0.0 inches 1949
3 Trace 2024
Trace 2017
Trace 2016
Trace 2010
Trace 2009
Trace 2001
Trace 1987
Trace 1982
Trace 1976
Trace 1973
Trace 1969
Trace 1941
Trace 1913
Trace 1904
17 0.1 inches 2012
0.1 inches 1963
0.1 inches 1914
0.1 inches 1912
0.1 inches 1899
- The snowiest days were a trace on November 20, November 21, November 25, November 28, November 29, and November 30.
- A trace of snow fell on 6 days (20%).
...Daily Records...
...Looking Ahead to December...
- The normal high temperature in La Crosse starts at 38°F on December 1st and falls to 26°F by the end of the month. The normal low temperature starts off at 23°F on the 1st and falls to 10°F by the end of the month. The warmest December temperature on record is 69°F on December 15, 2021, and the coldest is -37°F on December 24, 1872.
- The normal mean temperature for December is 25.1°F. La Crosse’s warmest December occurred in 1877 with an average temperature of 38.9°F, and their coldest December occurred in 1983 with an average temperature of 6.4°F.
- The normal December precipitation is 1.49". The wettest December occurred in 2015 with 4.93" of precipitation and the driest December occurred in 1943 with just 0.01". The wettest December day occurred on December 13, 2015, when 1.71" of precipitation fell.
- The normal December snowfall is 10.9" (2nd snowiest month). The snowiest December occurred in 2008 with 32.7" of snow and the least snow was a trace in 1943, 1979, and 2006. The snowiest December day occurred on December 7, 1927 (La Crosse's snowiest day), when 16.7" of snow fell.
Rochester, MN
November 2024 - Warmer and Wetter than Normal in Rochester, MN
...November 2024 Highlights...
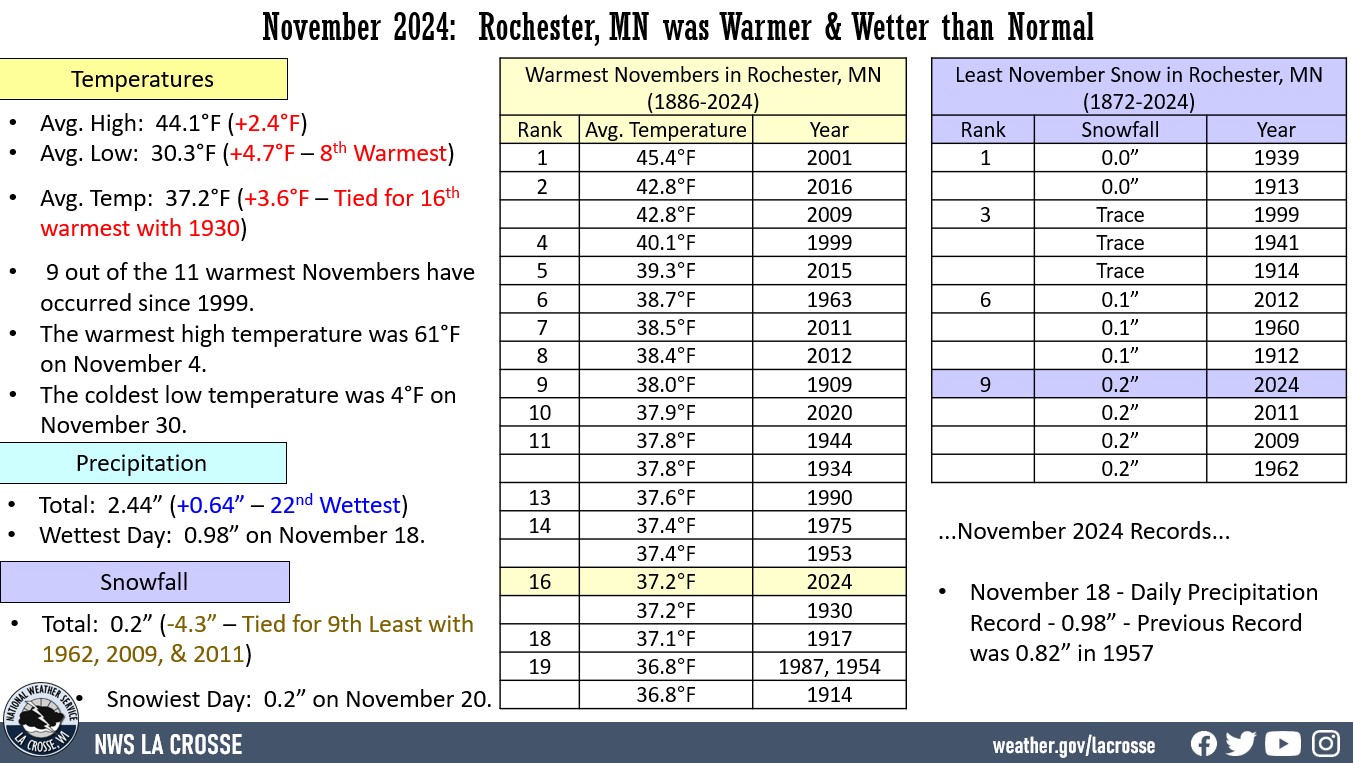
Temperatures - Tied for 16th Warmest
- During November 2024, the average temperature was 37.2°F at Rochester International Airport.
- This was 3.6°F warmer than the 1991-2020 normal of 33.6°F.
- 9 out of the 11 warmest Novembers have occurred since 1999.
- Through November 25th, this November was the 7th warmest (averaging 41°F or 6.2°F warmer than normal). During the remainder of the month, the average temperature was 18.2°F or 9.5°F colder than normal. This resulted in this November being tied with 1930 for the 16th warmest.
|
 |
- The table below lists the 20 warmest Novembers at Rochester, MN.
20 Warmest Novembers
in Rochester MN
1886-2024
Rank Avg Temp Year
---- -------- ----
1 45.4°F 2001
2 42.8°F 2016
42.8°F 2009
4 40.1°F 1999
5 39.3°F 2015
6 38.7°F 1963
7 38.5°F 2011
8 38.4°F 2012
9 38.0°F 1909
10 37.9°F 2020
11 37.8°F 1944
37.8°F 1934
13 37.6°F 1990
14 37.4°F 1975
37.4°F 1953
16 37.2°F 2024
37.2°F 1930
18 37.1°F 1917
19 36.8°F 1987
36.8°F 1954
36.8°F 1914
- The average high temperature was 44.1°F. This was 2.4°F warmer than the 1991-2020 normal of 41.7°F.
- The average low temperature was 30.3°F. This was 4.7°F warmer than the 1991-2020 normal of 25.6°F. This was the 8th warmest.
- The warmest high temperature was 61°F on November 4.
- The warmest low temperature was 49°F on November 4.
- The coldest high temperature was 18°F on November 30.
- The coldest low temperature was 4°F on November 30.
Precipitation - 22nd Wettest
- A total of 2.44" of precipitation fell at Rochester International Airport.
- This was 0.64" wetter than the 1991-2020 normal of 1.80".
- This was the 22nd wettest November and the wettest since 2020 (2.52" - 21st wettest November).
- 7 out of the 22 wettest November have occurred since 2000. 4 of these have occurred since 2015.
- The wettest day was 0.98" on November 18. This set a daily precipitation record. The previous record was 0.82" in 1957.
- Measurable precipitation fell on 11 days (36.7%) and another 4 days (13.3%) had a trace of precipitation.
Snowfall - Tied for 9th Least
- 0.2" of snow was reported by the official snow observer near Rochester International Airport.
- This was 4.3" below the 1991-2020 normal of 4.5".
- This was tied for the 9th least with 1962, 2009, and 2011.
- The least was 0" in 1913 and 1939.
- The snowiest November was 22.5" in 1985.
- The table below contain the 10 Novembers with the least amount of snow in Rochester, MN.
Least Amount of
November Snowfall
in Rochester MN
1893-2024
Rank Snowfall Year
---- -------- ----
1 0.0 inches 1939
0.0 inches 1913
3 Trace 1999
Trace 1941
Trace 1914
6 0.1 inches 2012
0.1 inches 1960
0.1 inches 1912
9 0.2 inches 2024
0.2 inches 2011
0.2 inches 2009
0.2 inches 1962
- The snowiest day was 0.2" on November 20.
- Measurable snow fell on 1 day (3.3%) and another 5 days (16.7%) had a trace of snow.
...Daily Records...
- November 18 - Daily Precipitation - 0.98" - Previous Record was 0.82" in 1957
...Looking ahead to December...
- The normal high temperature in Rochester starts off at 34°F on December 1st and falls to 24°F by the end of the month. The normal low temperature starts off at 19°F on the 1st and falls to 9°F by the end of the month. The warmest December temperature on record is 64°F on December 4, 2017, and December 15, 2021, and the coldest is -33°F on December 19, 1983.
- The normal mean temperature for December is 20.8°F. Rochester’s warmest December occurred in 1931 with an average temperature of 30.7°F, and its coldest December occurred in 1983 with an average temperature of 2.9°F.
- The normal December precipitation is 1.28". The wettest December occurred in 2010 with 3.68" of precipitation and the driest December occurred in 1943 with only a trace. This tied March 1910 and June 1910 for their driest month. The wettest December day occurred on December 11, 2010, when 1.36" of precipitation fell.
- The normal December snowfall is 12.4". The snowiest December occurred in 2010 with 41.3" of snow. This was their snowiest month. The least snow was a trace in 1913 and 1943. The snowiest December day occurred on December 11, 2010, when 15" of snow fell.