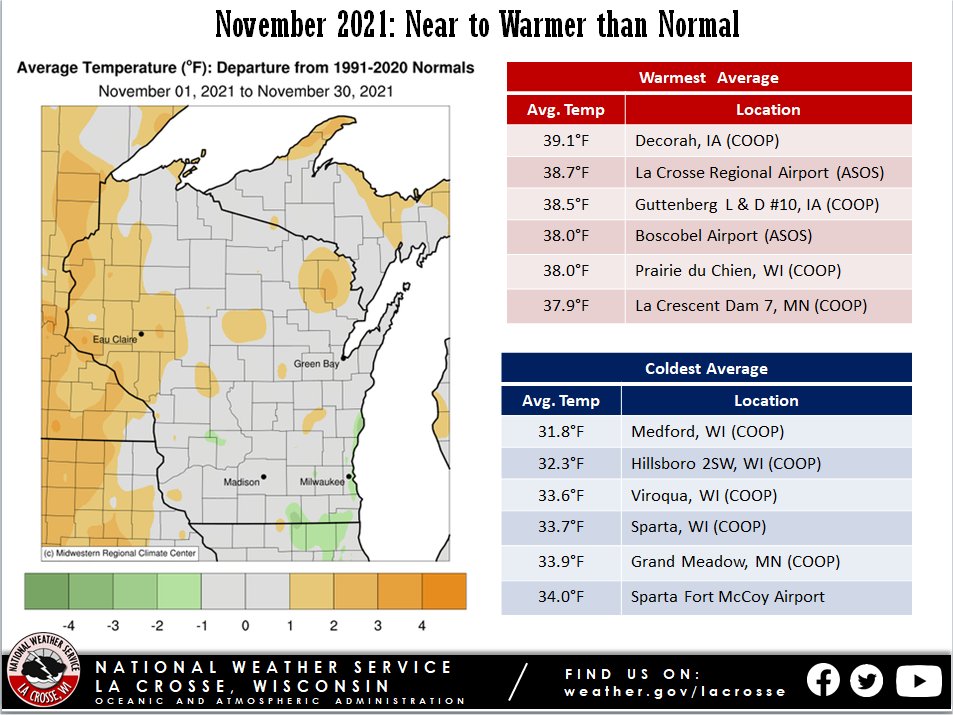
During November 2021, average temperatures in the Upper Mississippi River Valley ranged from 1°F colder-than-normal to 4°F warmer-than-normal. The average temperatures ranged from 31.8°F at Medford, WI to 39.1°F at Decorah, IA. November average temperatures typically range from 30°F to 40°F.
Above-normal November temperatures are not that unusual during La Niñas. Out of the 24 La Niñas since 1949, 10 of them had much above-normal temperatures and 12 were near normal. Only 2 saw much below-normal temperatures (1955 and 1995).
The hottest temperature was 71°F at Boscobel Airport on November 8. Meanwhile, the coldest temperature was 3°F at Black River Falls, WI on November 26.
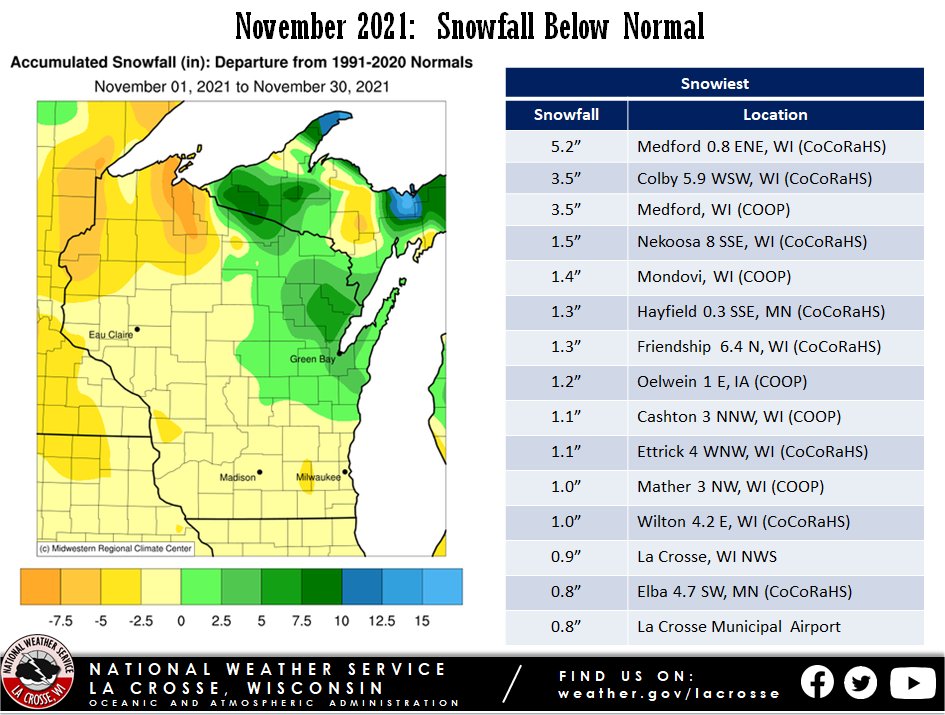
Precipitation was highly variable across the Upper Mississippi River Valley. Rainfall departures ranged from 2" drier-than-normal to 1" wetter-than-normal. The driest areas were in central and southwest Wisconsin and the wettest areas were from southeast Minnesota northeast into north-central Wisconsin. Precipitation totals ranged from 0.64" at Guttenberg Lock & Dam 10, IA (COOP observer) to 2.50" near Sheldon, WI (CoCoRaHS observer). November precipitation typically ranges from 1.6 to 2.4".
Snowfall was up to 5" below the 1991-2020 normal across the Upper Mississippi River Valley. Snowfall typically ranges from 2 to 7.5". The highest snow total was 5.2” near Medford, WI.
The images below show the temperature, precipitation, and snowfall anomalies for November 2021
 |
 |
 |
| Temperature Anomalies |
Precipitation Anomalies |
Snowfall Anomalies |
Below are the November 2021 climate summaries for La Crosse, WI, and Rochester, MN.
La Crosse, WI
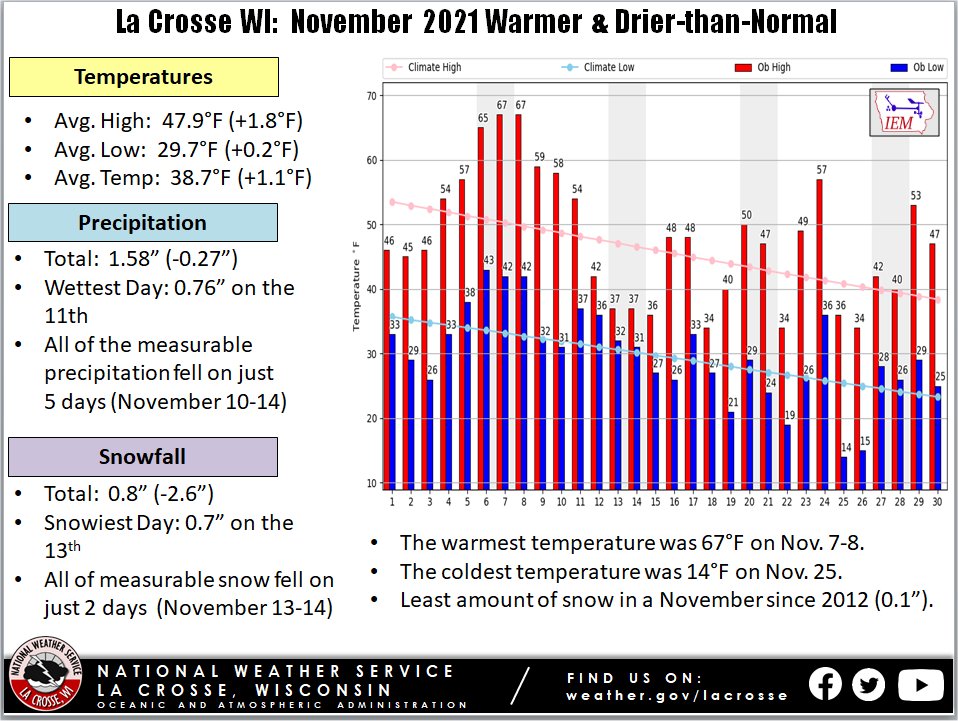
November 2021 was Warmer and Drier than Normal in La Crosse, WI
...November Highlights...
|
Temperatures...
- During November 2021, temperatures averaged warmer than normal. This is not that unusual for a La Niña November. 22 out of the 24 La Niñas since 1949 were either among the warmest third or near-normal. Only 2 Novembers (1955 and 1995) were among the coldest third.
- The average temperature was 38.7 degrees. This was 1.1 degrees warmer than the 1991-2020 normal of 37.6 degrees.
- The average high temperature was 47.6 degrees. This was 1.8 degrees warmer than the 1991-2020 normal of 45.8 degrees.
The average low temperature was 29.7 degrees. This was 0.2 degrees warmer than the 1991-2020 normal of 29.5 degrees.
- The warmest temperature was 67 degrees on November 7 and November 8.
- The coldest temperature was 14 degrees on November 25.
|
 |
Precipitation...
- A total of 1.58 inches of precipitation fell. This was 0.27 inches drier than the 1991-2020 normal of 1.85 inches. All of this precipitation fell on just 5 days (November 10-14).
- The wettest day was November 11 when 0.76 inches of precipitation fell.
- Measurable rain fell on 5 days and trace amounts fell on another 5 days.
Snowfall...
- A total of 0.8 inches of snow fell. This was 2.6 inches below the 1991-2020 normal of 3.4 inches.
- The snowiest day was November 13 when 0.7 inches of snow fell.
- Measurable snow fell on 2 days and trace amounts fell on another 2 days.
...November Records...
...Looking Ahead to December...
- The normal high temperature in La Crosse starts off at 38 degrees on December 1st and falls to 26 degrees by the end of the month. The normal low temperature starts off at 23 degrees on the 1st and falls to 10 degrees by the end of the month. The warmest December temperature on record is 67 degrees on November 5, 1998, and the coldest is -37 degrees on December 24, 1872.
- The normal mean temperature for the month is 25.1 degrees. La Crosse’s warmest December occurred in 1877 with an average temperature of 38.9 degrees, and their coldest December occurred in 1983 with an average temperature of 6.4 degrees.
- The normal December precipitation is 1.49 inches. The wettest December occurred in 2015 with 4.93 inches of precipitation and the driest December occurred in 1943 with just 0.01 inches. The wettest December day occurred on December 13, 2015, when 1.71 inches of precipitation fell.
- The normal December snowfall is 10.9 inches. The snowiest December occurred in 2008 with 32.7 inches of snow and the least snow was a trace in 1943, 1979, and 2006. The snowiest December day occurred on December 7, 1927 (La Crosse's snowiest day), when 16.7 inches of snow fell.
Rochester, MN
November 2021 was Warmer and Wetter than Normal in Rochester MN
...November Highlights...
|
Temperatures...
- During November 2021, temperatures averaged warmer than normal. This is not that unusual for a La Niña November. 22 out of the 24 La Niñas since 1949 were either among the warmest third or near-normal. Only 2 Novembers (1955 and 1995) were among the coldest third.
- The average temperature was 35.5 degrees. This was 1.9 degrees warmer than the 1991-2020 normal of 33.6 degrees.
- The average high temperature was 44.7 degrees. This was 3 degrees warmer than the 1991-2020 normal of 41.7 degrees.
- The average low temperature was 26.3 degrees. This was 0.7 degrees warmer than the 1991-2020 normal of 25.6 degrees.
- The warmest temperature was 67 degrees on November 6.
- The coldest temperature was 11 degrees on November 25.
|
 |
Precipitation...
- A total of 1.89 inches of precipitation fell. This was 0.09 inches wetter than the 1991-2020 normal of 1.80 inches. Other than the 0.01 inch that fell on the 30th, the remainder of this precipitation fell from November 10-13.
- The wettest day was November 10 when 1.42 inches of precipitation fell.
- Measurable rain fell on 5 days and trace amounts fell on another 4 days.
Snowfall...Tied with 1969 for 19th least.
- A total of 0.6 inches of snow fell. This was 3.9 inches below the 1991-2020 normal of 4.5 inches. This was tied with 1969 for the 19th least.
- The snowiest days were November 12 and 13 when 0.3 inches of snow fell.
- Measurable snow fell on 2 days and trace amounts fell on another 5 days.
...November Records...
...Looking Ahead to December...
- The normal high temperature in Rochester starts off at 34 degrees on December 1st and falls to 24 degrees by the end of the month. The normal low temperature starts off at 19 degrees on the 1st and falls to 9 degrees by the end of the month. The warmest December temperature on record is 64 degrees on December 4, 2017, and the coldest is -33 degrees on December 19, 1983.
- The normal mean temperature for the month is 20.8 degrees. Rochester’s warmest December occurred in 1931 with an average temperature of 30.7 degrees, and their coldest December occurred in 1983 with an average temperature of 2.9 degrees.
- The normal December precipitation is 1.28 inches. The wettest December occurred in 2010 with 3.68 inches of precipitation and the driest December occurred in 1943 with only a trace. This tied March 1910 and June 1910 for their driest month. The wettest December day occurred on December 11, 2010, when 1.36 inches of precipitation fell.
- The normal December snowfall is 12.4 inches. The snowiest December occurred in 2010 with 41.3 inches of snow. This was their snowiest month. The least snow was a trace in 1913 and 1943. The snowiest December day occurred on December 11, 2010, when 15 inches of snow fell.

