ENHANCED HAZARDOUS WEATHER OUTLOOK
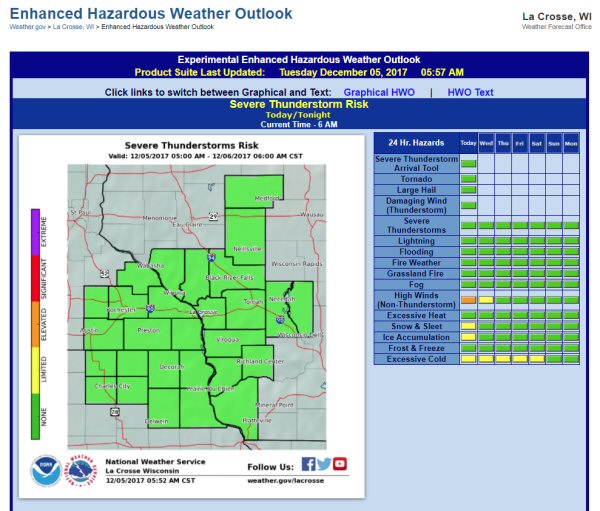
The Experimental Enhanced Hazardous Weather Outlook is a decision support service that supports preparedness and response efforts prior to and during hazardous weather. This service provides decision makers with convenient access to potential weather hazard information by graphically depicting the risk of weather hazards out through seven days.
Colors are used to highlight the risks and related impacts - from no risk to extreme - for various weather hazards (severe thunderstorms, snow, etc).
PROBABILISTIC SNOW FORECASTS
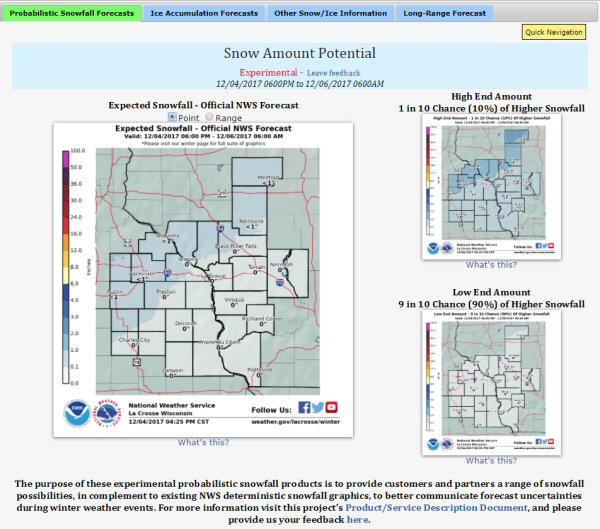
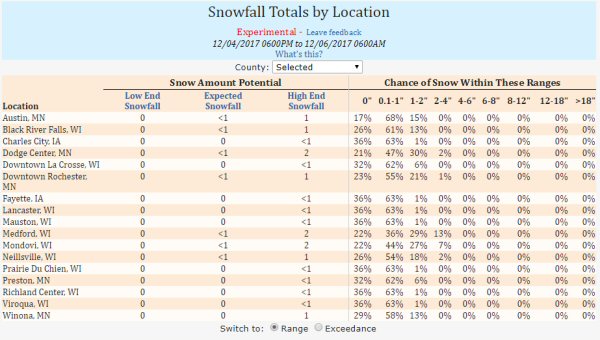
The purpose of the experimental probabilistic snowfall forecasts is to show you a range of snowfall possibilities, in addition to our existing NWS deterministic snowfall graphics, to better communicate forecast uncertainties. Through tables and graphics we hope to bring better understanding to how much snow or ice is expected, how likely amounts are, and even give you a "high end" and "low end" snowfall scenario.
Since these are experimental forecasts and information, let us know what you like and where we can improve.
Highlights:
Graphics
|
 |
WINTER MONITOR
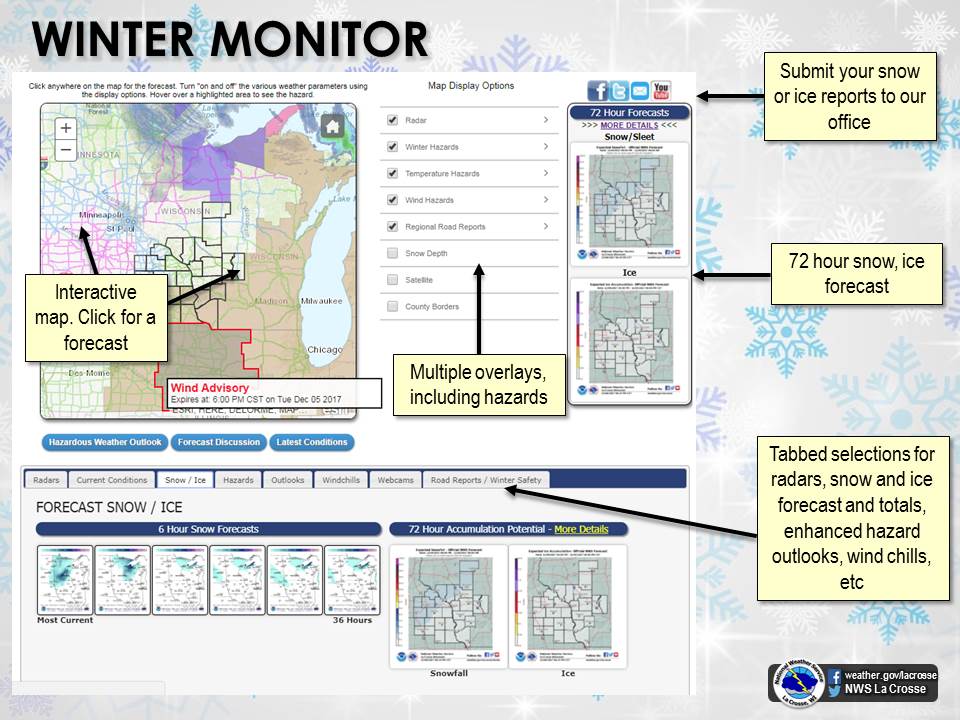
The Winter Monitor page has been available for a few years, and has served as a "one-stop shop" for all your winter forecast and planning needs.
Recently, we have enhanced and added more information to keep you "up-to-date" on what's going, what to expect, and what's happened - so you can make more informed choices on how to react and plan for the various winter weather hazards.
Highlights:
HOURLY WEATHER FORECAST
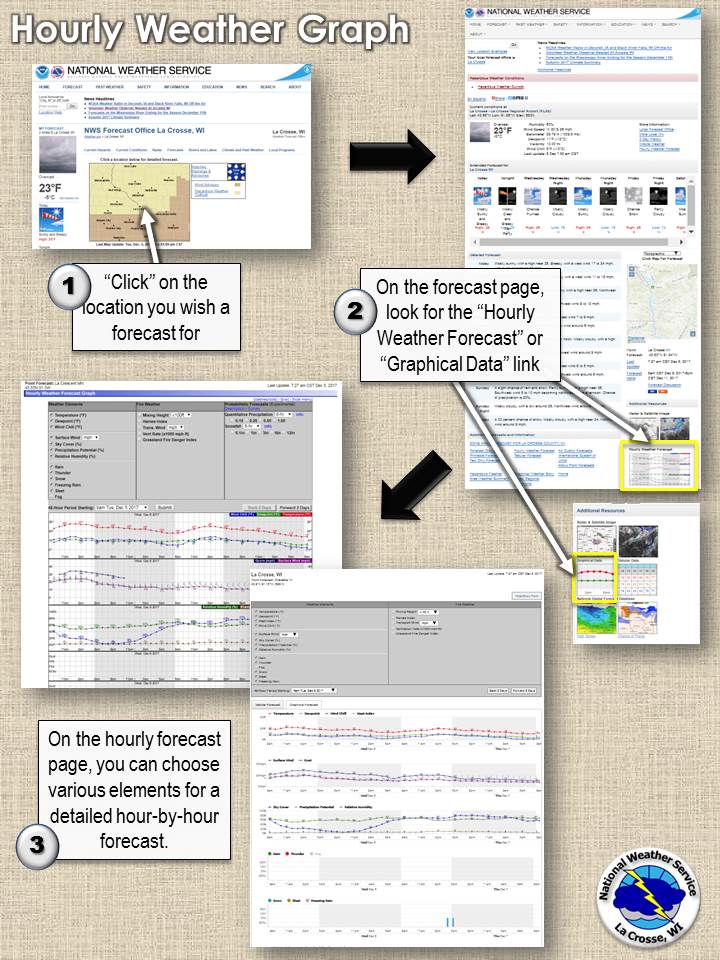
When are the wind chills going to be the coldest? When are the highest chances for snow? Is there a threat for sleet or freezing rain?
These are just a few questions you'll ask through the winter months, looking for information to better plan your day, outdoor exposure, road trips, etc.
While our forecast can answer most of these question, our hourly forecast will provide details on when we expect the coldest air, the highest precipitation chances, and the greatest threat for mixed precipitation (just to name a few).
How to access this great planning tool?


 Weather Story
 Weather Map
 Local Radar