| During meteorological summer 2022 (June 1-August 31), temperatures averaged near-normal across the Upper Mississippi River Valley. Monthly average temperatures ranged from 64.9°F at Medford Taylor County Airport, WI (AWOS) to 73.2°F at La Crosse Regional Airport, WI (ASOS). The hottest temperature was 101°F near Theilman, MN (COOP) on June 21 and the coldest temperature was 35°F at Sparta Fort McCoy, WI on June 3. | 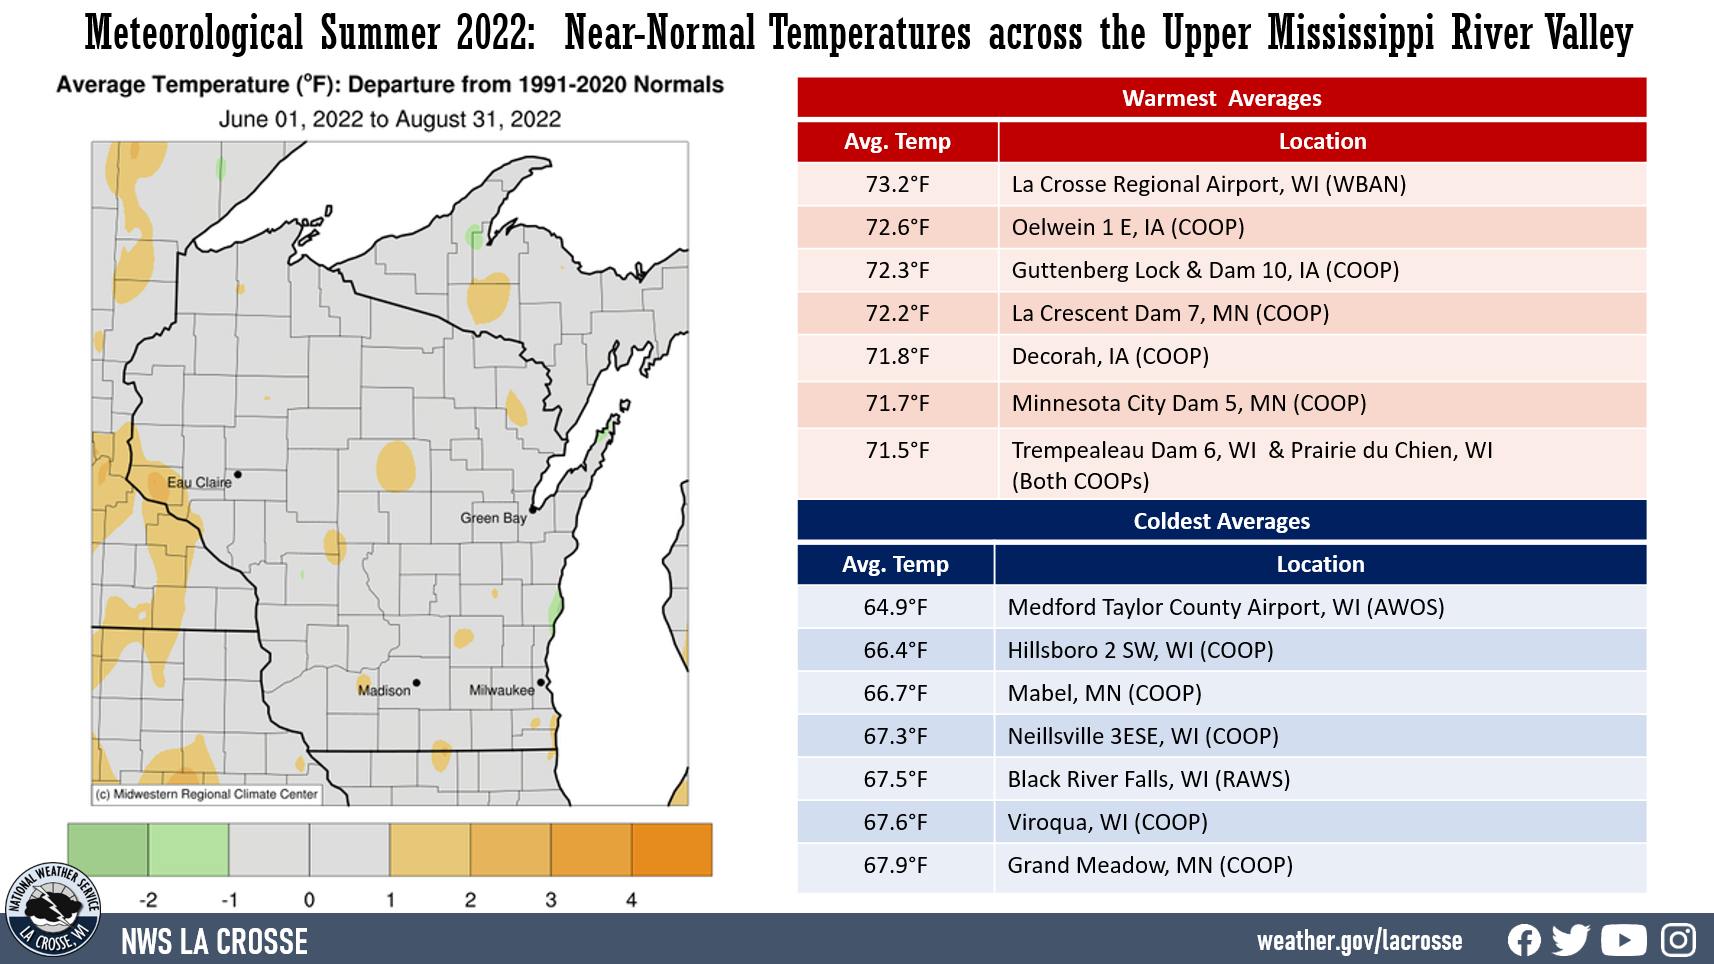 |
| During meteorological summer 2022 (June 1-August 31), temperatures averaged near-normal across the Upper Mississippi River Valley. Monthly average temperatures ranged from 64.9°F at Medford Taylor County Airport, WI (AWOS) to 73.2°F at La Crosse Regional Airport, WI (ASOS). The hottest temperature was 101°F near Theilman, MN (COOP) on June 21 and the coldest temperature was 35°F at Sparta Fort McCoy, WI on June 3. | |
Summer rainfall was highly variable across The Upper Mississippi River Valley. Rain totals ranged from 5.49” at Wabasha, MN (COOP) to 23.61” at Preston, MN (COOP). The greatest 1-day rainfall was 5.25" at Grand Meadow, MN (COOP). This rainfall fell from 7 AM on July 23 to 7 AM on July 24.
Rainfall anomalies ranged from 8” drier-than-normal to 8” wetter-than-normal across the region. It was the 2nd wettest summer at Preston, MN (only 1990 was wetter with 23.64") and St. Ansgar, IA (only 2008 was wetter with 21.24"). It was the 8th wettest summer at Caledonia, MN and Decorah, IA; and 9th wettest summer at Grand Meadow, MN and Prairie du Chien, WI. In contrast, Wabasha, MN had their 3rd driest summer and Lake City, MN had their 6th driest summer.
Below are the August 2022 climate summaries for La Crosse, WI and Rochester, MN.
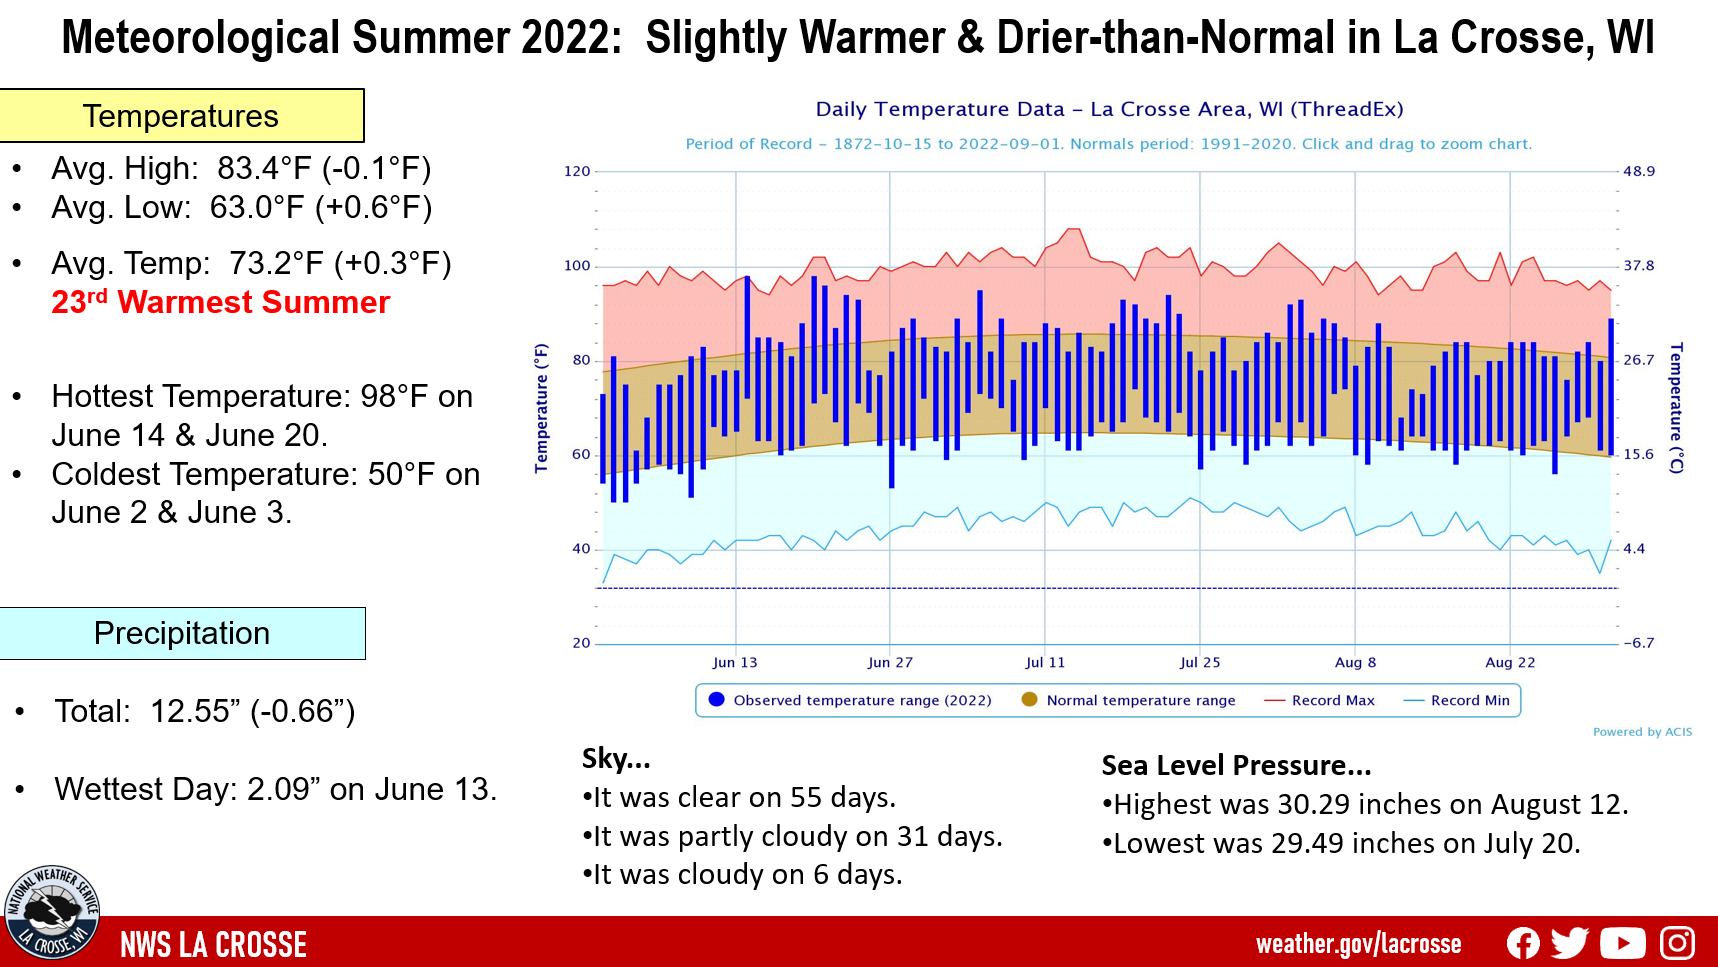
During the meteorological summer (June 1st through August 31st) of 2022, it was slightly warmer (+0.3°F) and drier (-0.66") than normal at La Crosse Regional Airport.
More details are listed below...
|
Temperatures...23rd Warmest
|
 |
Summer 2022 Temperatures
in La Crosse WI
Departure from
Normal
--------------
June Avg Temp 71.9°F +0.9°F
Avg Max Temp 82.3°F +0.6°F
Avg Min Temp 61.4°F +1.0°F
July Avg Temp 75.0°F Normal
Avg Max Temp 85.3°F -0.1°F
Avg Min Temp 64.6°F +0.1°F
August Avg Temp 72.7°F -0.1°F
Avg Max Temp 82.5°F -0.7°F
Avg Min Temp 62.9°F +0.6°F
Summer Avg Temp 73.2°F +0.3°F
Avg Max Temp 83.4°F -0.1°F
Avg Min Temp 63.0°F +0.6°F
Other temperature tidbits this summer...
Rainfall...Below Normal
Summer 2022 Rainfall
in La Crosse WI
Departure
Month Rain Total from Normal
----- ---------- -----------
June 5.15 inches +0.07 inches
July 3.90 inches -0.33 inches
August 3.50 inches -0.40 inches
Summer 12.55 inches -0.66 inches
Other rainfall tidbits this summer...
None 51 days 51.3 percent
Trace 8 days 8.7 percent
0.01-0.09 inches 13 days 14.1 percent
0.10-0.24 inches 7 days 7.6 percent
0.25-0.49 inches 4 days 4.3 percent
0.50-0.99 inches 4 days 4.3 percent
1.00-1.99 inches 4 days 4.3 percent
2.00-2.99 inches 1 day 1.1 percent
Sky...
Sea Level Pressure...
Winds...
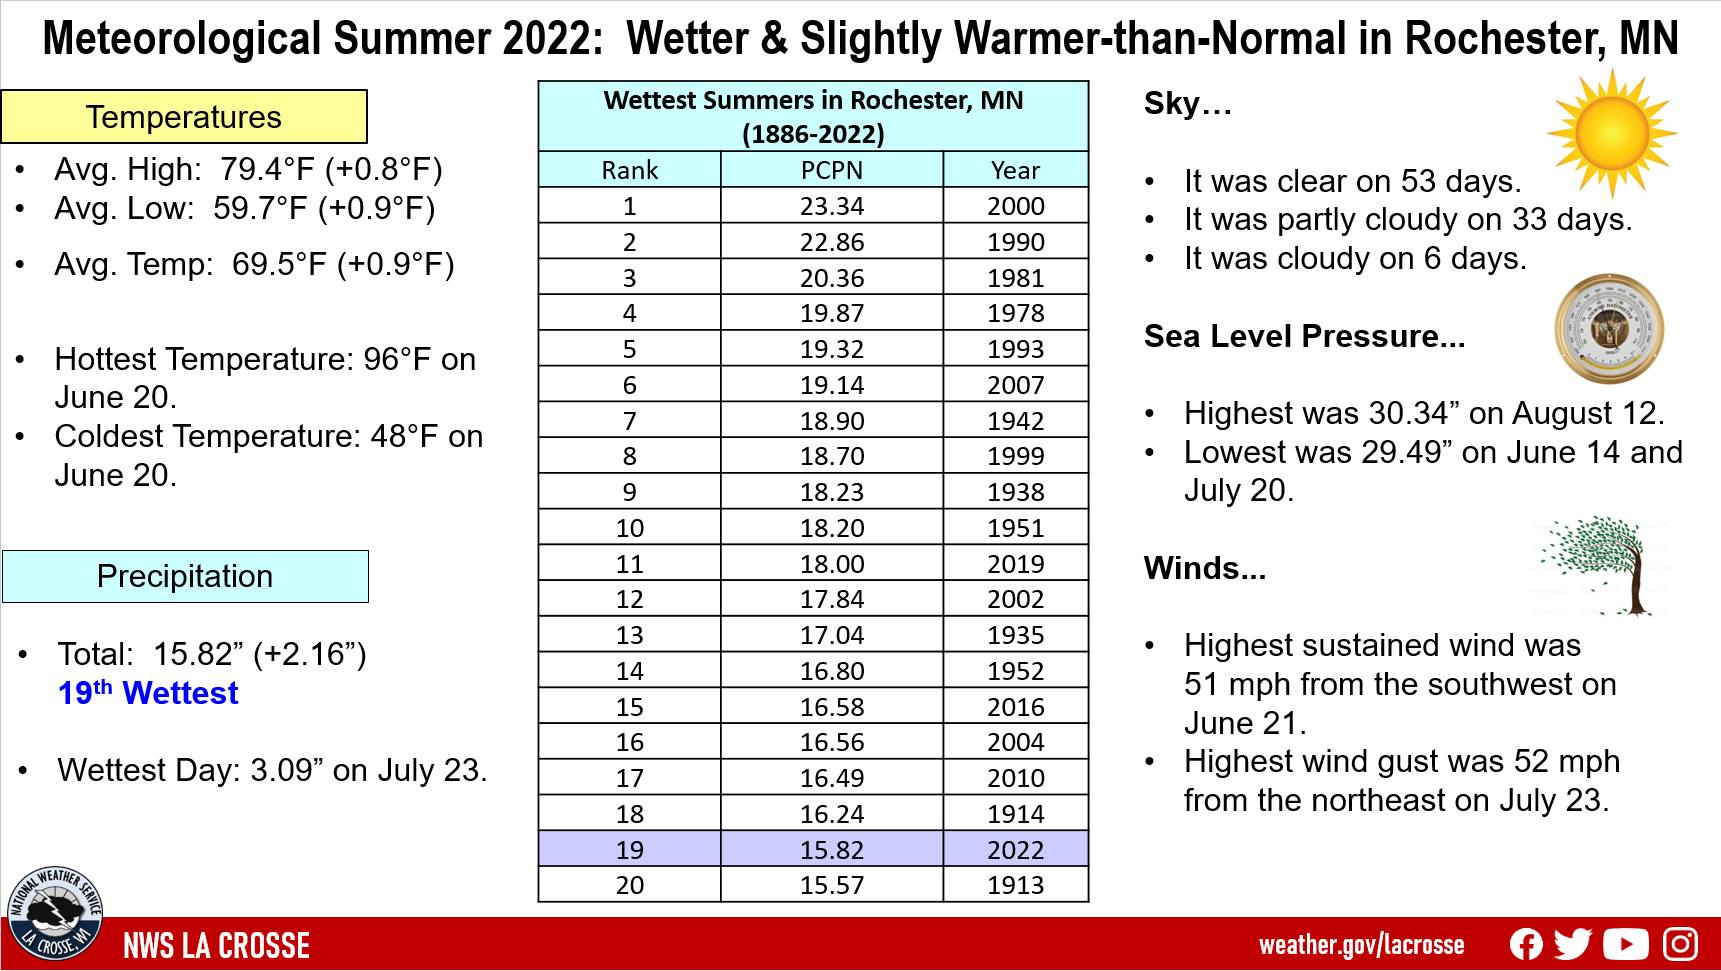
During the meteorological summer (June 1st through August 31st) of 2022, it was wetter than normal (2.16") and slightly warmer (+0.8°F) than normal at Rochester International Airport.
More details are listed below...
|
Temperatures...Slightly Warmer than Normal
|
 |
Summer 2022 Temperatures
in Rochester MN
Departure from
Normal
--------------
June Avg Temp 69.5°F +2.0°F
Avg Max Temp 79.9°F +2.3°F
Avg Min Temp 59.2°F +1.7°F
July Avg Temp 71.0°F +0.5°F
Avg Max Temp 80.8°F +0.5°F
Avg Min Temp 61.2F +0.4°F
August Avg Temp 68.0°F -0.2°F
Avg Max Temp 77.5°F -0.5°F
Avg Min Temp 58.6°F +0.3°F
Summer Avg Temp 69.5°F +0.8°F
Avg Max Temp 79.4°F +0.8°F
Avg Min Temp 59.7°F +0.9°F
Other temperature tidbits this summer...
Rainfall...19th Wettest
Twenty Wettest Augusts
in Rochester MN
1886-2022
Rank Rainfall Year
---- -------- ----
1 23.34 inches 2000
2 22.86 inches 1990
3 20.36 inches 1981
4 19.87 inches 1978
5 19.32 inches 1993
6 19.14 inches 2007
7 18.90 inches 1942
8 18.70 inches 1999
9 18.23 inches 1938
10 18.20 inches 1951
11 18.00 inches 2019
12 17.84 inches 2002
13 17.04 inches 1935
14 16.80 inches 1952
15 16.58 inches 2016
16 16.56 inches 2004
17 16.49 inches 2010
18 16.24 inches 1914
19 15.82 inches 2022
20 15.57 inches 1913
Summer 2022 Rainfall
in Rochester MN
Departure
Month Rain Total from Normal
----- ---------- -----------
June 4.28 inches -1.07 inches
July 5.01 inches +0.82 inches
August 6.53 inches +2.41 inches - 9th Wettest
Summer 15.82 inches +2.16 inches - 19th Wettest
Other rainfall tidbits this summer...
None 52 days 56.5 percent
Trace 8 days 8.7 percent
0.01-0.09 inches 13 days 14.1 percent
0.10-0.24 inches 4 days 4.3 percent
0.25-0.49 inches 5 days 5.4 percent
0.50-0.99 inches 5 days 5.4 percent
1.00-1.99 inches 4 days 4.3 percent
2.00-2.99 inches 0 days 0.0 percent
3.00 inches + 1 day 1.1 percent
Sky...
Sea Level Pressure...
Winds...

