Upper Mississippi River Climate Summary for May 2024:
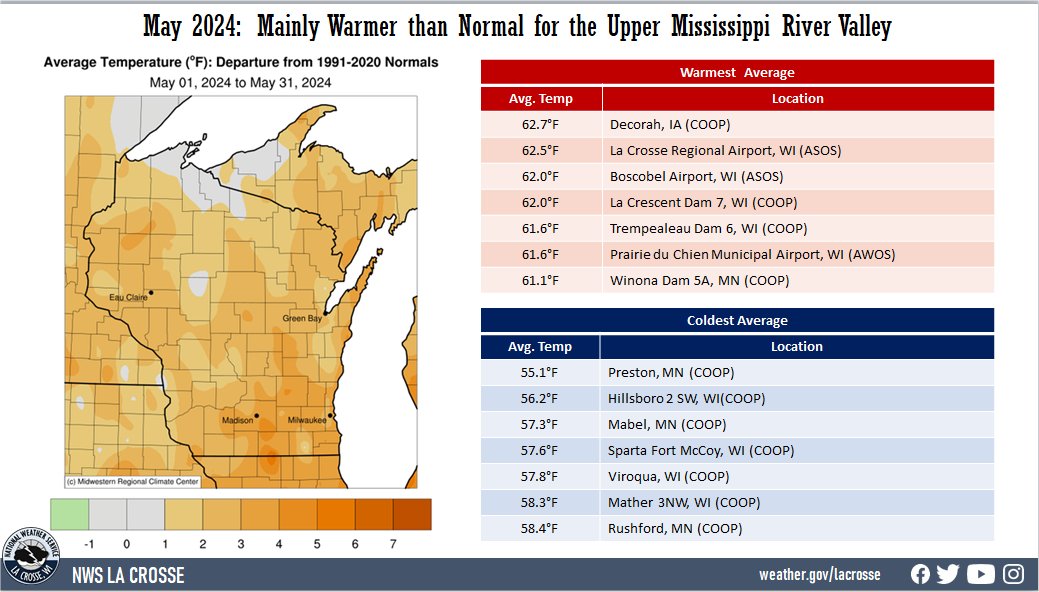
Temperatures - Warmer than Normal
- During May 2024, average temperatures ranged from 55.1°F at Preston, MN (COOP) to 62.7°F at Decorah, IA (COOP).
- Temperature anomalies ranged from near normal to 4°F above normal. There was a 65°F difference between the warmest and coldest temperatures in the Upper Mississippi River Valley.
- The warmest temperature was 91°F at Boscobel Airport, WI (ASOS) on May 18. Meanwhile, the coldest temperature was 26°F at Preston, MN on May 6.
|
 |
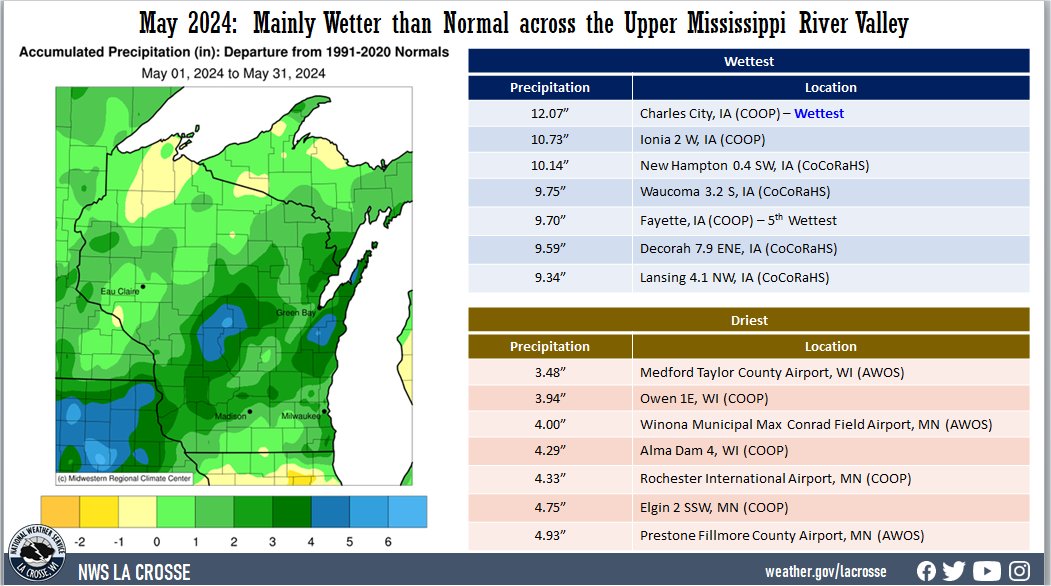
Precipitation - Wetter than Normal
- Precipitation totals varied from 3.48" at the Medford Taylor County Airport, WI to 12.07" at Charles City, IA.
- It was the wettest May for Charles City, IA. The previous record was 10.19" in 2004.
- Precipitation anomalies ranged from near normal to 6" wetter than normal.
- The highest one-day precipitation was 3.72" at Decorah Municipal Airport, IA (AWOS) on May 21.
- With a wet April and May south of Interstate 90, the 2023-24 drought ended for the La Crosse Hydrologic Service Area (HSA). Due to the large precipitation deficits from 6 to 12 months ago, abnormally dry (D0) conditions continue across northeast Iowa, and parts of southeast Minnesota and southwest Wisconsin. This is impacting groundwater levels.
|
 |
Below are the May 2024 climate summaries for La Crosse, WI, and Rochester, MN.
La Crosse, WI
May 2024 was Warmer and Wetter at La Crosse, WI
...May 2024 Highlights...
Temperatures - Warmer than Normal
- During May 2024, the average temperature at La Crosse Regional Airport was 62.5°F. This was 1.5°F warmer than the 1991-2020 normal of 61°F.
- The average high temperature was 74.1°F. This was 2.1°F warmer than the 1991-2020 normal of 72°F.
- The average low temperature was 50.9°F. This was 0.8°F warmer than the 1991-2020 normal of 50.1°F.
- The warmest temperature was 89°F on May 18 and the coldest temperature was 43°F on May 5.
|
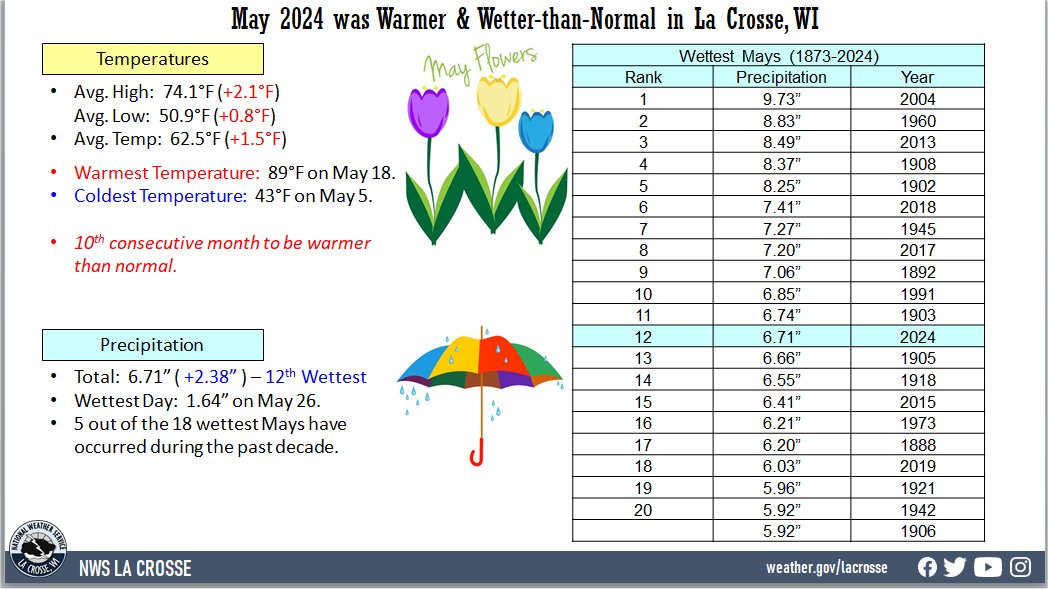 |
Precipitation - 12th Wettest
- A total of 6.71" of rain fell. This was 2.38" wetter than the 1991-2020 normal of 4.33". This was the 12th wettest May. Below are the 20 wettest Mays for La Crosse, WI.
Wettest Mays
for La Crosse, WI
1873-2020
Rainfall
Rank Amount Year
---- -------- ----
1 9.73 inches 2004
2 8.83 inches 1960
3 8.49 inches 2013
4 8.37 inches 1908
5 8.25 inches 1902
6 7.41 inches 2018
7 7.27 inches 1945
8 7.20 inches 2017
9 7.06 inches 1892
10 6.85 inches 1991
11 6.74 inches 1903
12 6.71 inches 2024
13 6.66 inches 1905
14 6.55 inches 1918
15 6.41 inches 2015
16 6.21 inches 1973
17 6.20 inches 1888
18 6.03 inches 2019
19 5.96 inches 1921
20 5.92 inches 1942
5.92 inches 1906
- 5 out of the 18 wettest Mays have occurred during the past decade. This was the wettest May since 2018 (7.41" - 6th wettest).
- The wettest day was on May 26 when 1.64" of rain fell.
- Measurable rain has fallen on 12 days (38.7%) and trace amounts on another 4 days (12.9%).
...Records...
...Looking Ahead to June...
- The normal high temperature in La Crosse rises from 78°F on June 1st to 85°F on the 30th. The normal low temperature rises from 56°F on the 1st to 64°F by the end of the month. The normal mean temperature for the month is 71.0°F. La Crosse’s hottest June occurred in 1993 with an average temperature of 76.5°F, and their coldest June occurred in 1969 with an average temperature of 61.4°F.
- For June, the hottest temperature was 102°F on June 20, 1933, and June 21, 1988, and the coldest temperature was 33°F on June 1, 1897. There are typically 4 days with temperatures at or above 90°F.
- The average precipitation for June is 5.08". The wettest June occurred in 1899 when 11.56" of rain fell. The driest June occurred in 1910 when 0.37" of rain fell. The wettest June day was 4.50" on June 18, 2011.
- Normally, there are 7 days with thunderstorms.
Rochester, MN
May 2024 was Warmer than Normal with Near-Normal Rainfall at Rochester, MN
...May 2024 Highlights...
Temperatures - Warmer than Normal
- During May 2024, the average temperature at Rochester International Airport was 59.5°F. This was 1.9°F warmer than the 1991-2020 normal of 57.6°F.
- The average high temperature was 71.3°F. This was 3.3°F warmer than the 1991-2020 normal of 68°F.
- The average low temperature was 47.7°F. This was 0.6°F warmer than the 1991-2020 normal of 47.1°F.
- The warmest temperature was 88°F on May 18 and the coldest temperature was 39°F on May 3 and May 5.
|
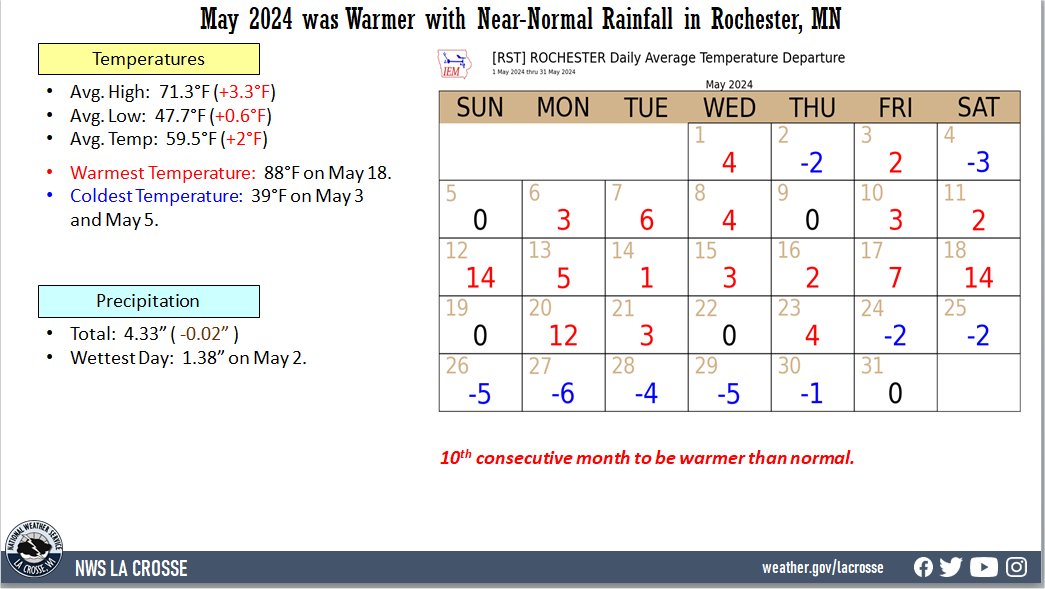 |
​Precipitation - Near Normal
- A total of 4.33" of rain fell. This was 0.02 inches drier than the 1991-2020 normal of 4.35".
- The wettest day was on May 2 when 1.38" of rain fell.
- Measurable rain has fallen on 13 days (41.9%) and trace amounts on another 5 days (16.1%).
...Records...
...Looking Ahead to June...
- The normal high temperature in Rochester rises from 74°F on June 1st to 80°F by the end of the month. The normal low temperature rises from 53°F on the 1st to 61°F by the end of the month. The normal mean temperature for the month is 67.5°F. Rochester’s hottest June occurred in 1933 with an average temperature of 73.9°F, and their coldest June occurred in 1969 with an average temperature of 59.6°F.
- For June, the hottest temperature was 105°F on June 27, 1934, and the coldest temperature was 31°F on June 9, 1937. There are typically 2 days with temperatures at or above 90°F.
- The average precipitation for June is 5.35". The wettest June occurred in 2000 when 12.51" of precipitation fell. The driest June occurred in 1910 when a trace of precipitation fell. The wettest June day was 4.90" on June 28, 2019.
- Normally, there are 8 days with thunderstorms.

