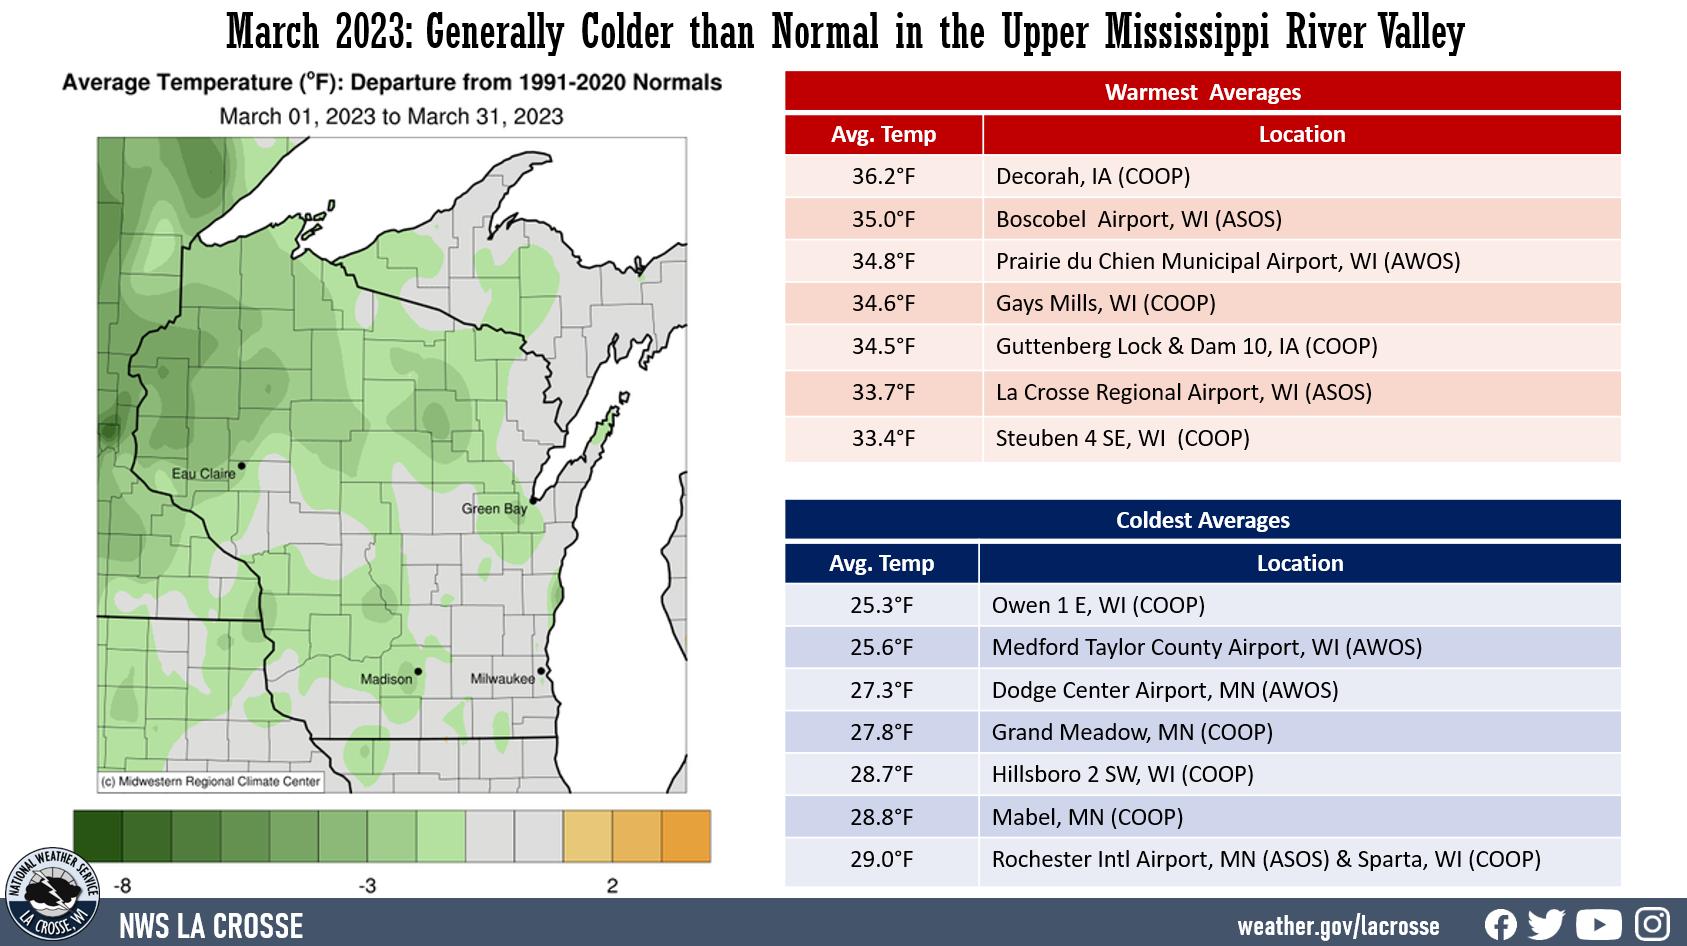
Temperatures:
| During March 2023, monthly temperatures ranged from 25.3°F near Owen, WI (COOP) to 36.2°F at Decorah, IA COOP). These temperatures ranged from near normal to 3°F colder than normal. The warmest temperature was 72°F at Charles City, IA (COOP) on the 31st. The coldest temperature was -12°F near Owen, WI (COOP) on the 15th. |
 |
Precipitation:
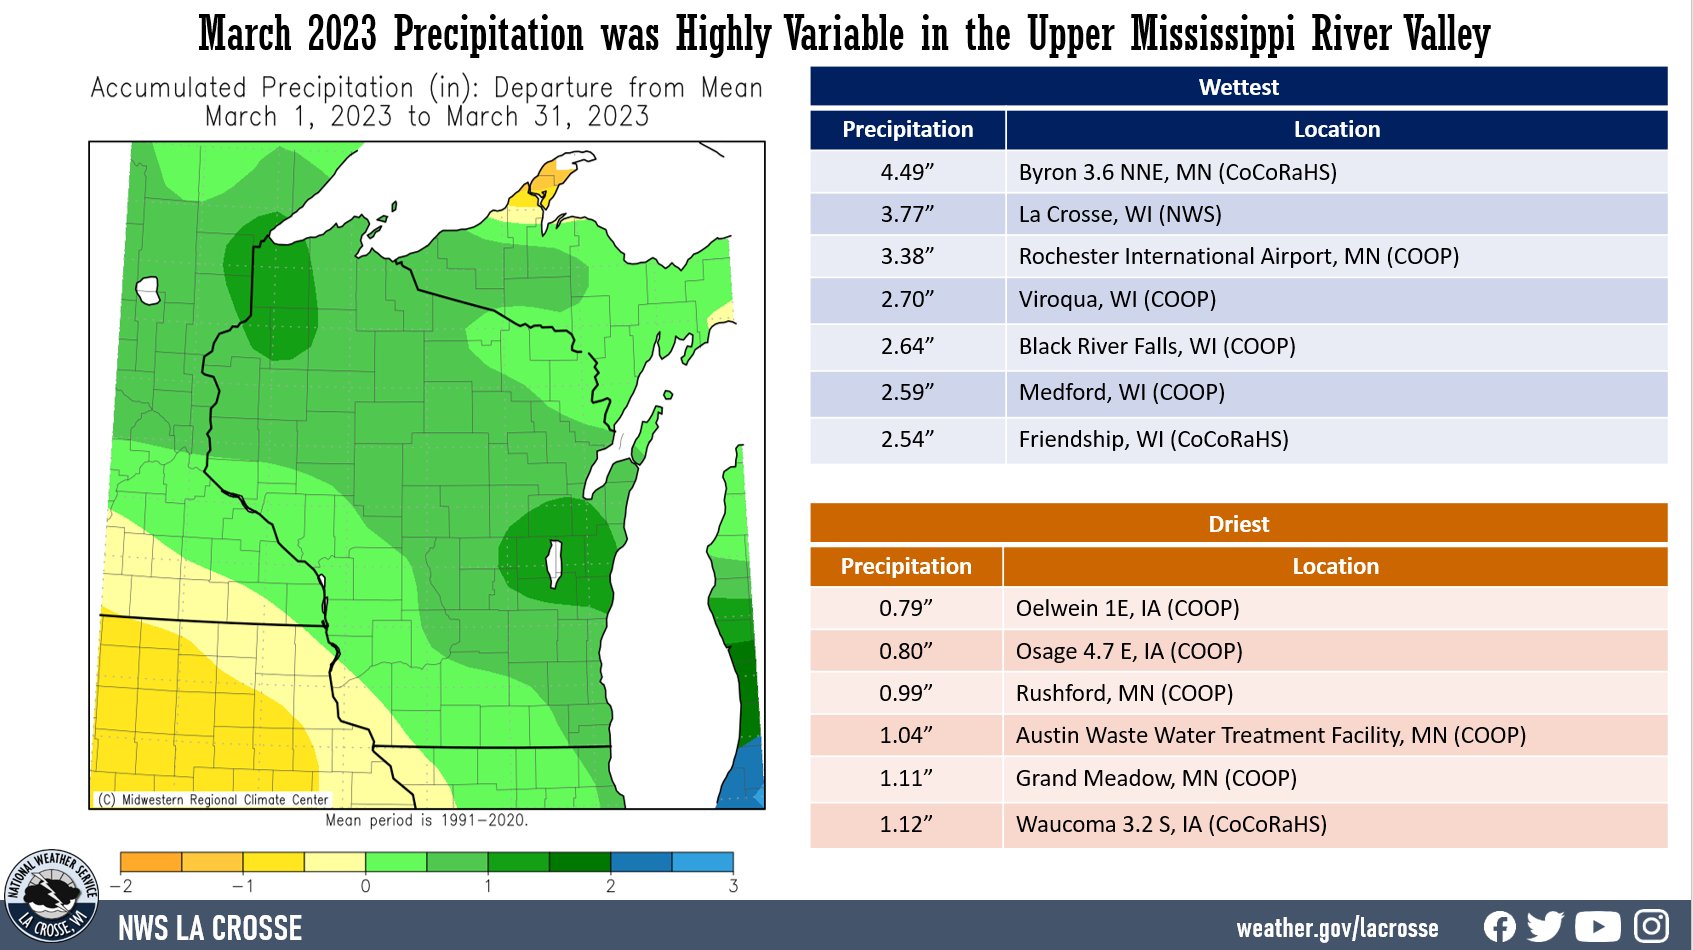
| Precipitation was highly variable in the Upper Mississippi River Valley. Precipitation anomalies ranged from near normal to 1" drier-than-normal in northeast Iowa and from near normal to 2” wetter-than-normal across the remainder of the area. Precipitation totals ranged from 0.79” near Oelwein, IA (COOP) to 4.49” near Byron, MN (CoCoRaHS). |
 |
|
March was the 7th wettest at Rochester, MN (3.38" - records date back to 1886) and the 10th wettest at La Crosse, WI (3.38" - records date back to 1873). The wettest calendar day for most locations occurred on March 31. Rochester, MN International Airport received 2.15" of precipitation. This was Rochester's 2nd wettest March Day. Only March 22, 2011, was wetter with 2.20”. La Crosse Regional Airport received 1.67" of precipitation. This was their 4th wettest March Day. Their wettest March day occurred on March 27, 1888, when 2.01” of precipitation. This was La Crosse's wettest March day since March 22, 2011 (1.82" - 2nd wettest March day). Their wettest March day occurred on March 27, 1888, when 2.01” of precipitation fell.
|
Snowfall:
|
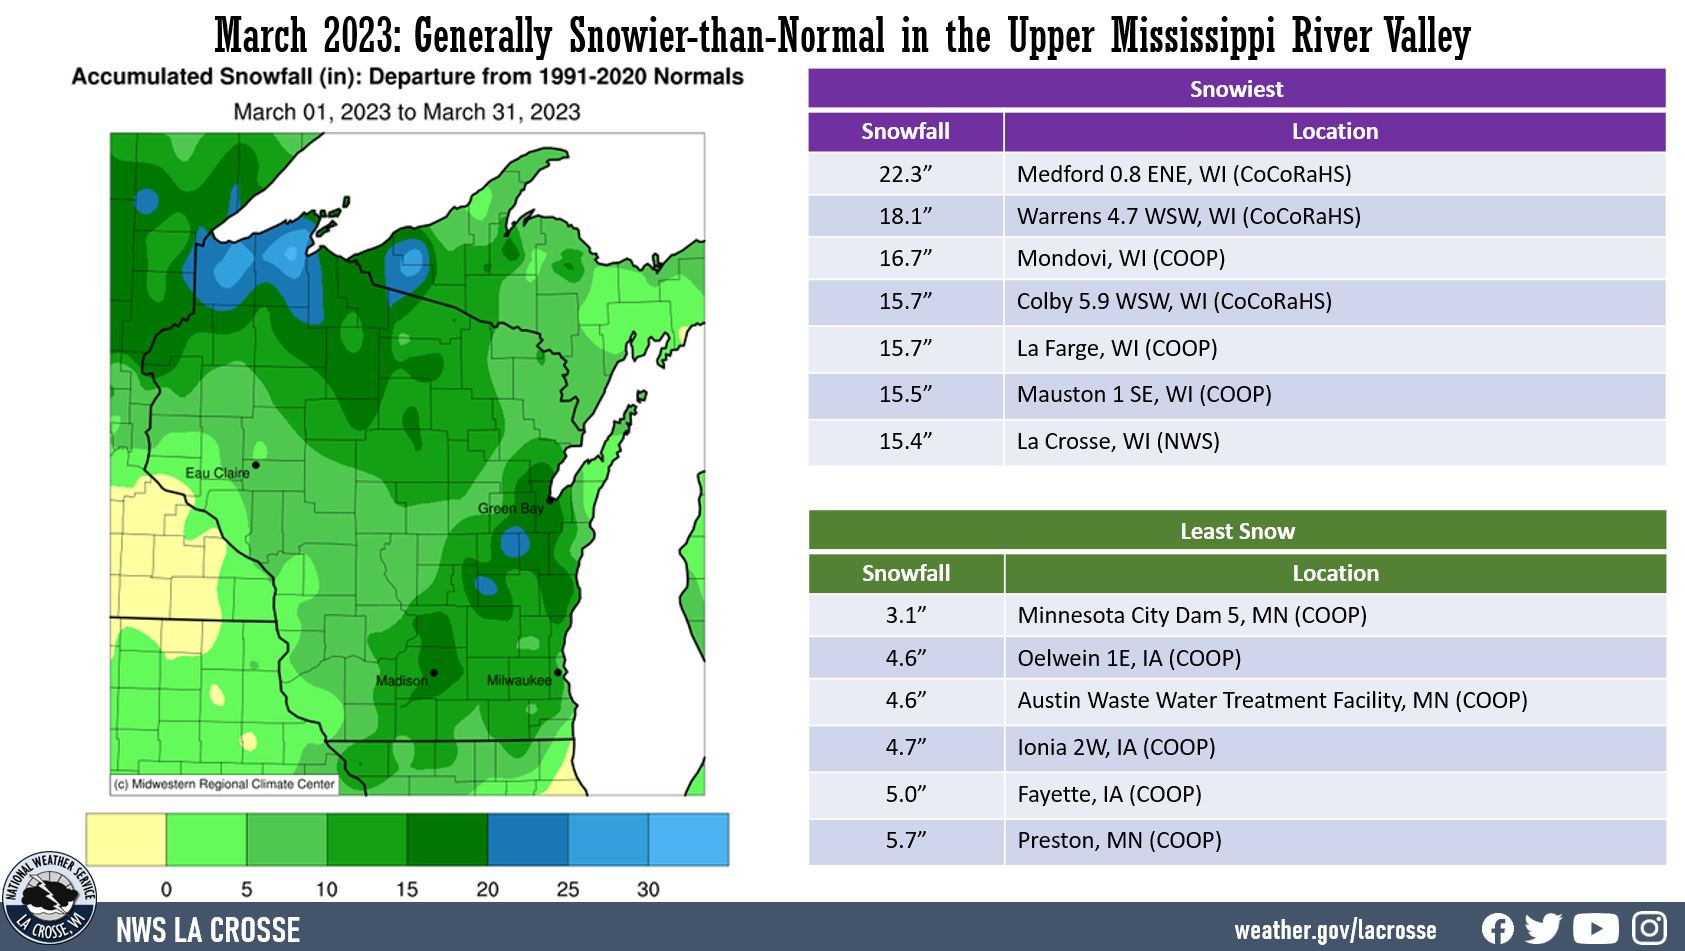
Snowfall ranged from 3.1" at Minnesota City Dam 5, MN (COOP) to 22.3" near Medford, WI (CoCoRaHS). These snowfall values ranged from near normal to 20" above normal. The greatest 1-day snowfall was 8.1" near Warrens, WI (CoCoRaHS). This snow fell from 7 AM on March 9 to 7 AM on March 10.
|
 |
Below are March 2023 climate summaries for La Crosse, WI, and Rochester, MN.
La Crosse, WI
March 2023 was Colder and Much Wetter than Normal in La Crosse, WII
Temperatures - Colder-than-Normal
- The average temperature at La Crosse Regional Airport was 33.7°F. This was 2.1°F colder than the 1991-2020 normal of 35.8°F. This was the coldest March since 2019 (30.2°F).
- The average high temperature was 42.7°F. This was 2.9°F colder than 1991-2020 normal of 45.6°F. Coldest since 2019 (40.4°F).
- The average low temperature was 24.6°F. This was 1.4°F colder than 1991-2020 normal of 26.0°F. Coldest since 2019 (20.1°F).
|
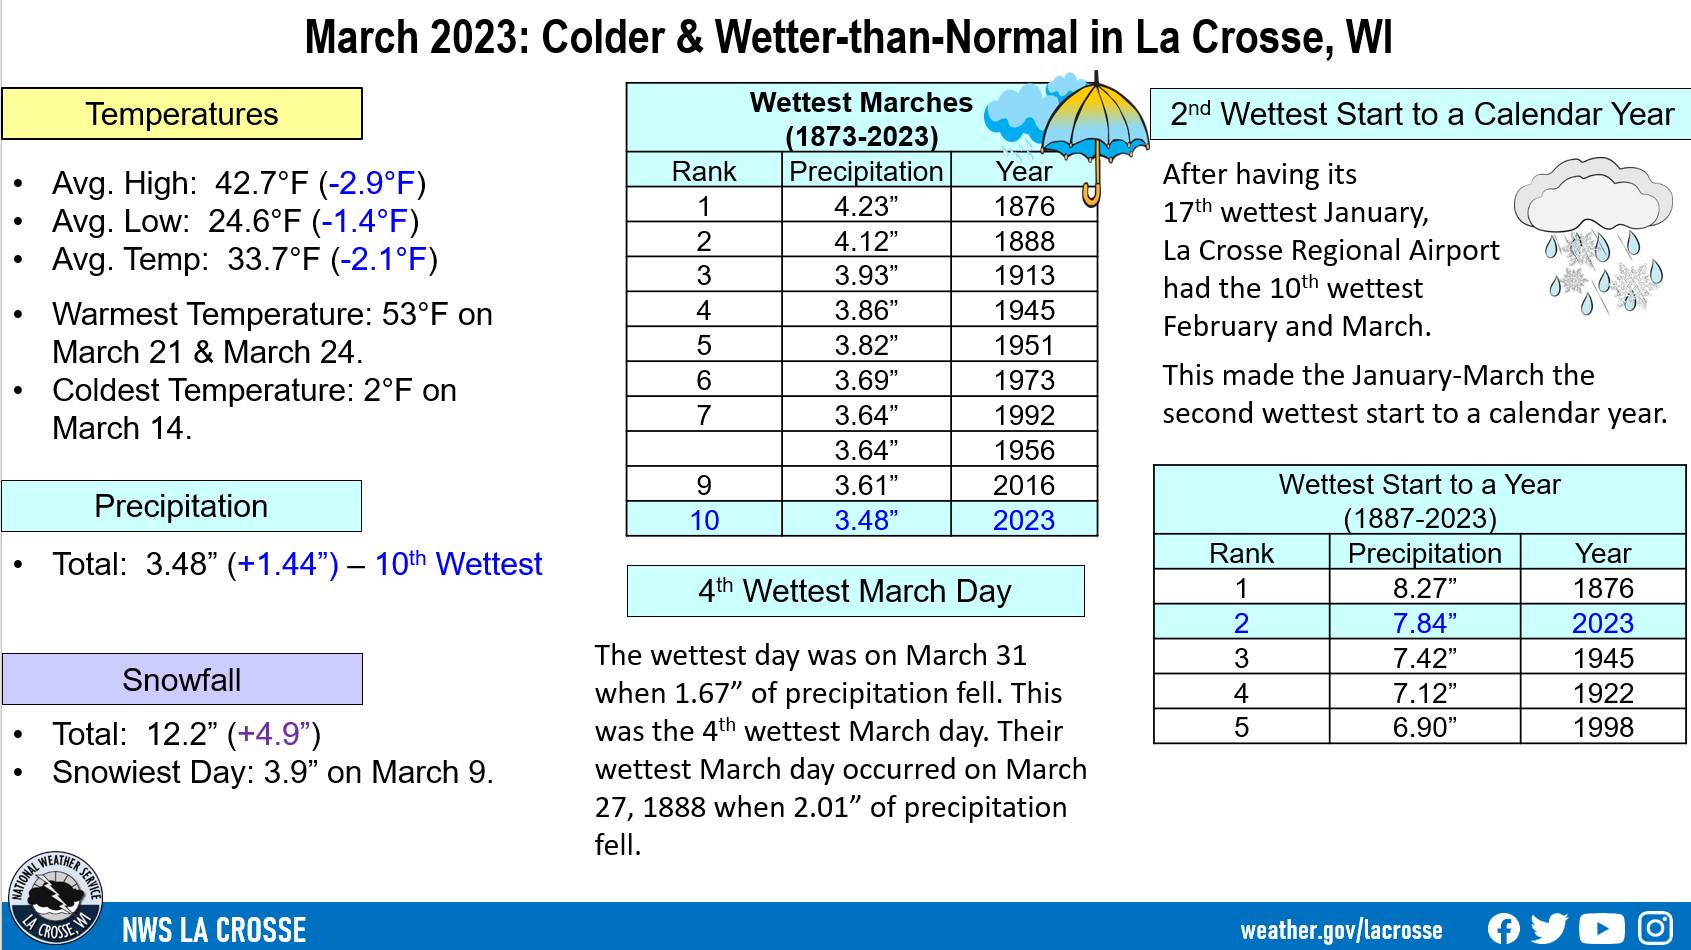 |
- The warmest temperature was 53°F on March 21 and March 24.
- The coldest high temperature was 28°F on March 17.
- The warmest low temperature was 37°F on March 31.
- The coldest temperature was 2°F on March 14.​
Precipitation - 10th Wettest
- A total of 3.48 inches of precipitation fell. This was 1.44 inches wetter than the 1991-2020 normal of 2.04 inches. This was the 10th wettest March. It was the wettest March since 2016 (3.61 inches - 9th wettest). The following are the 10 wettest Marches in La Crosse, WI.
Wettest Marches
in La Crosse WI
1873-2023
Rank Precipitation Year
---- ------------- ----
1 4.23 inches 1876
2 4.12 inches 1888
3 3.93 inches 1913
4 3.86 inches 1945
5 3.82 inches 1951
6 3.69 inches 1973
7 3.64 inches 1992
3.64 inches 1956
9 3.61 inches 2016
10 3.48 inches 2023
- The January 1 through March 31 precipitation total is 7.84 inches. This is the second wettest start to a year. Only 1876 was wetter with 8.27 inches. This year to date is 3.36 inches wetter than the 1991-2022 normal of 4.48 inches. Below are the 10 wettest starts to a year in La Crosse, WI.
Wettest January-March
in La Crosse WI
1873-2023
Rank Precipitation Year
---- ------------- ----
1 8.27 inches 1876
2 7.84 inches 2023
3 7.42 inches 1945
4 7.12 inches 1922
5 6.90 inches 1998
6 6.89 inches 1875
7 6.66 inches 1951
8 6.45 inches 1929
9 6.31 inches 1959
10 6.18 inches 1949
- This was the 4th consecutive month to be wetter than normal.
- The wettest day was 1.67 inches on March 31. This was nearly half (47.9%) of the monthly precipitation. This was the 4th wettest March day. The wettest March day occurred on March 27, 1880, when 2.01 inches of precipitation fell. Below are the 5 wettest March days in La Crosse, WI.
Wettest March Calendar Days
in La Crosse, WI
1873-2023
Rank Precipitation Date
---- ------------- ----
1 2.01 inches 3/27/1880
2 1.82 inches 3/22/2011
3 1.77 inches 3/15/1919
4 1.67 inches 3/31/2023
5 1.58 inches 3/09/1992
Snowfall - Above Normal
Snow Depth - Below Average
- The average snow depth was 1.6 inches. This was 0.4 inches below the 1893-2023 long-term average of 2 inches.
- The greatest snow depth was 6 inches on March 10 and March 12.
...Records...
...Looking ahead to April...
- The normal high temperature in La Crosse starts off at 53°F on April 1st and warms to 66°F by the end of the month. The normal low temperature starts off at 33°F on the 1st and warms to 44°F by the end of the month. The warmest April temperature on record is 93°F on April 29, 1910, and April 22, 1980; and the coldest is -7°F on April 1, 1924, and April 6, 1982.
- The normal mean temperature for April is 49°F. La Crosse’s warmest April occurred in 1915 with an average temperature of 56.9°F, and their coldest April occurred in 1874 and 2018 with an average temperature of 39.3°F.
- The normal April precipitation is 3.75 inches. The wettest April occurred in 1973 with 7.31 inches of precipitation and the driest occurred in 1879 with 0.42 inches. The wettest April day occurred on April 27, 1975, when 3.91 inches of precipitation fell. Normally, there are 3 days with thunderstorms.
- The normal April snowfall is 2.9 inches. The snowiest April occurred in 2018 with 19 inches of snow. The snowiest April day occurred on April 9, 1973, when 10.3 inches of snow fell.
Rochester, MN
March 2023 was Colder and Much Wetter than Normal in Rochester, MN
Temperatures - Warmer than Normal
-
The average temperature at Rochester International Airport was 29°F. This was 2.7°F colder than the 1991-2020 normal of 31.7°F. This was the coldest March since 2019 (25.9°F).
-
The average high temperature was 36.3°F. This was 3.6°F colder than 1991-2020 normal of 39.9°F. Coldest since 2019 (33.9°F).
-
The average low temperature was 21.7°F. This was 1.7°F colder than 1991-2020 normal of 23.4°F. Coldest since 2019 (17.9°F).
|
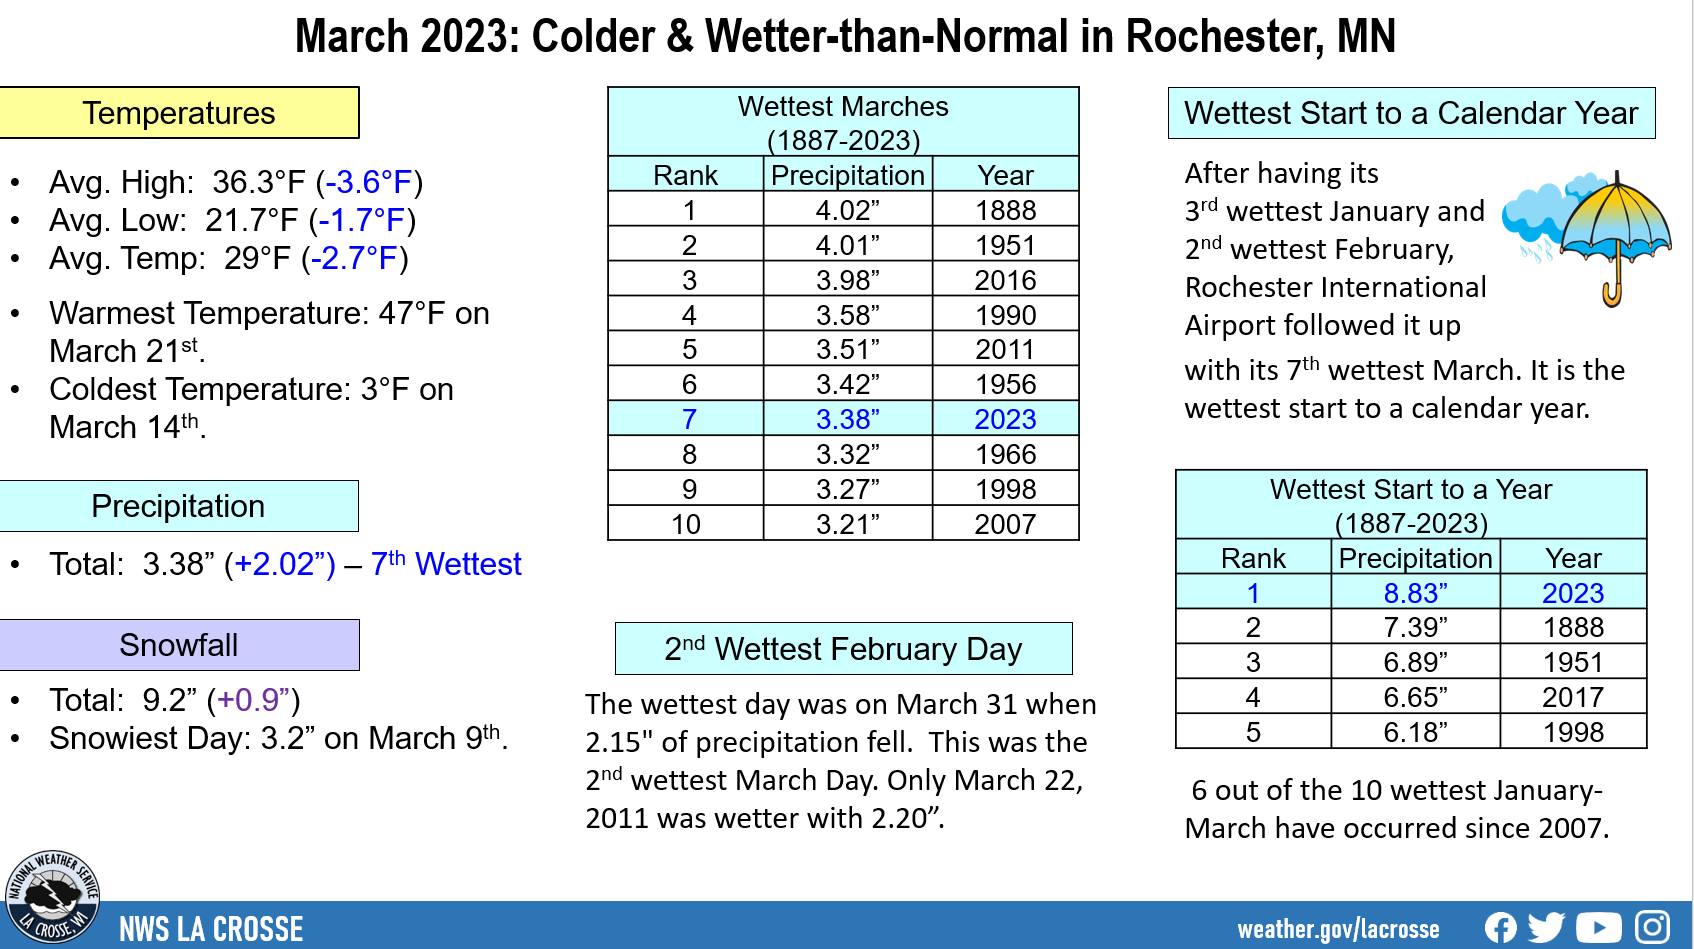 |
- The warmest temperature was 47°F on March 21.
- The coldest high temperature was 21°F on March 17.
- The warmest low temperature was 32°F on March 6 and March 31.
- The coldest temperature was 3°F on March 14.
Precipitation - 7th Wettest
- A total of 3.38 inches of precipitation fell. This was 1.36 inches wetter than the 1991-2020 normal of 2.02 inches. This was the 7th wettest March. It was the wettest March since 2016 (3.98 inches - 3rd wettest). The following are the 10 wettest Marches in Rochester, MN.
Wettest Marches
in Rochester MN
1886-2023
Rank Precipitation Year
---- ------------- ----
1 4.02 inches 1888
2 4.01 inches 1951
3 3.98 inches 2016
4 3.58 inches 1990
5 3.51 inches 2011
6 3.42 inches 1956
7 3.38 inches 2023
8 3.32 inches 1966
9 3.27 inches 1998
10 3.21 inches 2007
- The January 1 through March 31 precipitation total is 8.33 inches. This is the wettest start to a year. The previous record was 7.39 inches in 1888. This year to date is 4.30 inches wetter than the 1991-2022 normal of 4.03 inches. 6 out of the 10 wettest starts of a year have occurred since 2007. Below are the 10 wettest starts to a year in Rochester, MN.
Wettest January-March
in Rochester MN
1886-2023
Rank Precipitation Year
---- ------------- ----
1 8.33 inches 2023
2 7.39 inches 1888
3 6.89 inches 1951
4 6.65 inches 2017
5 6.18 inches 1998
6 5.67 inches 2019
7 5.39 inches 2007
8 5.38 inches 2016
9 5.22 inches 2011
10 5.06 inches 1966
- This was the 5th consecutive month to be wetter than normal. All 5 of these months had over 2 inches of precipitation.
- The wettest day was 2.15 inches on March 31. This was well over half (63.6%) of the monthly precipitation. This was the 2nd wettest March day. Only March 22, 2011, was wetter with 2.20 inches. Below are the 5 wettest March days in Rochester, MN.
Wettest March Calendar Days
in Rochester, MN
1886-2023
Rank Precipitation Date
---- ------------- ----
1 2.20 inches 3/22/2011
2 2.15 inches 3/31/2023
3 1.90 inches 3/14/1918
4 1.81 inches 3/31/1993
5 1.68 inches 3/27/1956
Snowfall...Above Normal
- A total of 9.2 inches of snow fell. This was 0.6 inches snowier than the 1991-2020 normal of 8.6 inches. This was the snowiest March since 2016 (14.9 inches).
- The snowiest day was 3.2 inches on March 9.
Snow Depth...Below Average
- The average snow depth was 2.4 inches. This was 0.9 inches below the 1940-2023 long-term average of 3.3 inches.
- The greatest snow depth was 7 inches on March 12-14..
...Records...
- Daily Precipitation...
- Wettest March 31 - 2.15 inches - previous record 1.81 inches in 1993
- Year-to-Date...
- Wettest January-March - 8.33 inches - previous record 7.39 inches in 1888
...Looking ahead to April...
- The normal high temperature in Rochester starts off at 48°F on April 1st and warms to 62°F by the end of the month. The normal low temperature starts off at 30°F on the 1st and warms to 41°F by the end of the month. The warmest April temperature on record is 92°F on April 24, 2009, and the coldest is 5°F on April 6, 1982.
- The normal mean temperature for April is 45.2°F. Rochester’s warmest April occurred in 1915 with an average temperature of 54.5°F, and its coldest April occurred in 2018 with an average temperature of 34.5°F.
- The normal April precipitation is 3.52 inches. The wettest April occurred in 2001 with 7.30 inches of precipitation and the driest occurred in 1946 with 0.46 inches. The wettest April day occurred on April 23, 1990, when 3.81 inches of precipitation fell. Normally, there are 3 days with thunderstorms.
- The normal April snowfall is 3.3 inches. The snowiest April occurred in 2018 with 17 inches of snow. The snowiest April day occurred on April 20, 1893, when 14 inches of snow fell.


 Weather Story
 Weather Map
 Local Radar