| Temperatures | Precipitation | ||||||
| Month | High | Low | Average | Departure | Total | Departure | Snow |
| January | 23.3 | 2.3 | 12.8 | -6.1 | 0.61 | -0.64 | 9.5 |
| February | 29.1 | 7.5 | 18.3 | -5.0 | 0.34 | -0.85 | 3.9 |
| March | 43.6 | 26.7 | 35.2 | -0.6 | 1.81 | -0.23 | 0.3 |
| April | 53.4 | 35.5 | 44.5 | -4.5 | 3.27 | -0.48 | 1.0 |
| May | 72.6 | 52.2 | 62.4 | +1.4 | 4.20 | -0.13 | T |
| June | 82.3 | 61.4 | 71.9 | +0.9 | 5.15 | +0.07 | ... |
| July | 85.3 | 64.6 | 75.0 | 0.0 | 3.90 | -0.33 | ... |
| August | 82.5 | 62.9 | 72.7 | -0.1 | 3.50 | -0.40 | ... |
| September | 75.8 | 54.6 | 65.2 | +0.4 | 1.66 | -1.97 | ... |
| October | 62.7 | 39.6 | 51.1 | -0.6 | 1.04 | -1.45 | T |
| November | 46.5 | 28.9 | 37.7 | +0.1 | 2.06 | +0.21 | 3.2 |
| December | 28.8 | 14.1 | 21.5 | -3.5 | 2.38 | +0.80 | 17.0 |
| TOTALS: | 57.2 | 37.6 | 47.4 | -1.4 | 29.92 | -5.31 | *** |
Records
Temperature...
Highs:
Lows:
Highest Lows:
Lowest Highs:
Monthly:
Seasonal:
Yearly:
Precipitation...
One-day pcpn:
One-day snowfall:
Monthly pcpn:
Monthly snowfall:
Seasonal precipitation:
Yearly precipitation:
|
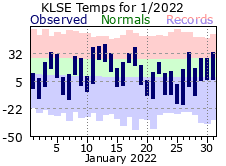
January got 2022 off to a cold start, but temperatures would fluctuate from mild to cold every few days. Highs warmed to 40 degrees plus twice while holding in the single digits 4 times. Lows did bottom out below -10 five times which is the average for La Crosse’s period of record. On the whole, it was a cold month with the average temp finishing around 6 degrees below normal. January was also a dry month coming in with only 50% of the monthly normal. There were only 2 days with over 1/10 of an inch of liquid equivalent precipitation and none above 2/10”. Snowfall for January was also below normal, but the 9.5” total was only about 2.5” under what is expected. There were 9 days with measurable snow (average is 8) with 4 over 1”. |
 |
|
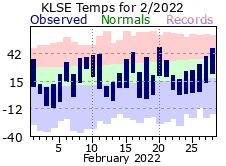
More cold and dry conditions for February with the average temperature 5 degrees below normal and precipitation almost 1” under its normal. Like January, there was a fair amount of fluctuation in day-to-day temps with 6 days warming to 40 degrees or greater while another 6 held in the teens to single digits for highs. There were 7 days with measurable precipitation in February, but none of them recorded more than 1/10” - relatively rare for the month (has only been done 11 other times). Snowfall was limited – no surprise – with only 40% (3.9”) of the February normal falling. There were 6 days with measurable snow with only 2 recording more than 1” (but both staying below 2”). |
 |
|
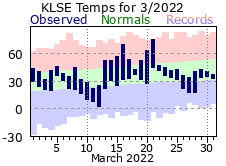
March was more in line with its monthly normal for both temperature and precipitation, finishing just a hair below for both. Temperatures would get quite chilly into the 2nd week of the month with highs only in the 20s for the 10th through the 12th. Mid month brought a brief warm up with a couple days warming to 70 degrees or greater (16th and 21st). The 16th was well ahead of the usual first 70 degree day in a year for La Crosse (April 8th) and marked it as the 10th earliest on record. It was a relatively dry first half of the month with only 2 days recording measurable precipitation. There would be 7 more such days from the 18th through month’s end with the 22nd and 23rd (0.87”) accounting for 50% of the March total. The only measurable snow came at the very end of the month with 0.3” on the 31st. This was well below the normal March snowfall of 7.3” and tied it for the 8th least snowiest March on record. |
 |
|
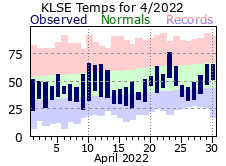
April continued the cool trend for the start of 2022 rounding out 4 ½ degrees below its normal. Highs didn’t climb out of the 50s 12 times (average is 8) while lows didn’t warm above freezing on an equal number of days. Further, there was only one day that managed to warm into the 70s (the 23rd), well below the average of 5. While April also received below normal precipitation, there were 13 days when measurable amounts fell (average is 11). The precipitation was also spread out with 6 days marking the longest stretch between measurable precipitation. Of the 13, six of those recorded over ¼”. Interestingly, April had 3 days with measurable snow, amounting to an inch – more than what occurred in March on both accounts.
|
 |
|
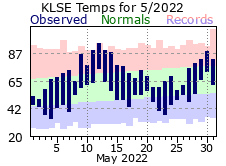
May managed to buck the cold trend of the previous 4 months averaging almost 1 ½ degrees above its normal. However, it was a month filled with warm and cold fluctuations: 15 days where temps were above normal, 15 below and 1 right on the normal. Highs warmed past 80 degrees 8 times, reaching into the 90s 3 times. – tied for 9th most in a May. While the first 80 degree day of 2022 was over a week later than average, the high of 90 degrees on the 11th was almost a month sooner than average. Precipitation for May was right around its normal and spread out through the month. There were 15 days with measurable precipitation (average is 12) with 2 days recording over an inch.
|
 |
|
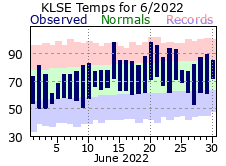
June also finished a bit above normal (around 1 degree), but experienced a wide variety of outcomes…from as cold as 61 for a high on the 4th to a steamy 98 on the 14th and 20th. The 98 degree days were the hottest for 2022. It was a cool start to June with below normal temperatures for the first 9 days. Temperatures warmed after that, generally hovering at or a few degrees above the normal. Rainfall for the month was in line with its normal with measurable precipitation falling on 11 days, 5 of those recording ¼” or greater. |
 |
|
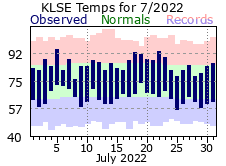
July was right on its normal for temperature with most days hovering within a few degrees of their daily normals. There were only 3 days when highs did not reach 80 degrees– well below the average of 7 such days for a July. While rainfall for the month was a bit below normal, 12 days recorded measurable rain – 2 above the average of 10. That said, over 60% of the July total came on the 15th and 23rd with over an inch falling both days. The strongest wind gust of 2022 came on the 23rd of July when thunderstorms drove 81 mph northwest winds through La Crosse. |
 |
|
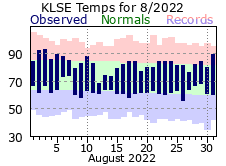
Like July, August finished at its normal for temperatures and just a bit under for precipitation. And in the same vein of July, the daily temperatures wavered only a few degrees either side of the normal. Highs didn’t reach 80 degrees on 7 days, well below the average of 12, with only 2 days climbing into the 90s (average is 4 days). Measurable rain fell on 10 days, which is the average for August, with 5 of those recording at least ¼ of an inch. |
 |
|
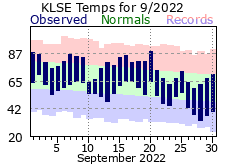
For the 3rd consecutive month, the average temperature was within a few tenths of a degree (or right on) of its respective normal. Unlike the previous two months, September had more swings in the daily temperatures as it transitioned from warmer summer temps to cooler fall ones. Highs topped 80 degrees on 14 days, well above the average of 7, but also failed to reach 70 degrees on 9 days. September even flirted with freezing with a low of 33 degrees on the 28th. Monthly rainfall was almost 2 inches under its normal. There were 9 days with measurable rain, but only 3 with 1/10” or greater (average is 3 such days). Of those, 1.32” fell on the 10th and 24th, accounting for 80% of the September total. |
 |
|
While October continued the trend of rounding out close to its normal, the fall month gave La Crosse a roller coaster ride of ups and downs when it came to daily highs and lows. For instance, a high of 48 degrees on the 18th would warm to 81 degrees on the 22nd. Highs climbed above 70 degrees 10 times (average is 7) but couldn’t reach 50 degrees on 5 days. Further, low temperatures could not warm out of the 20s and 30s on 20 days. The first freeze of the fall season came on the 18th (morning low of 27) – about a week later than average. October was a very dry month with only 3 days of measurable precipitation – well below the average of 9 and tied it for second for the least number of such days in an October. There were 3 stretches of at least a week between measurable rainfall. Further, the bulk of the October total came on one day – with 0.95” (out of 1.04” for the month) falling on the 24th. |
 |
|
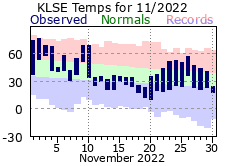
November got off to a very mild start with above normal temperatures on 9 of the first 10 days. Highs were in the 60s on 4 of those, climbing into the 70s twice. The average temperature over that period was 52.5 degrees, marking it as the 3rd warmest start (of that length) in a November for La Crosse. Temperatures tumbled after that, with a 12 day stretch of below normal temperatures. Highs were mostly in the 30s over this period with a very chilly 10 degrees for a low on the 20th. The rest of the month hovered closer to its normal and in the end, all the big swings in temperature muted themselves out with the average for the month finishing nearly spot on its normal. Precipitation for November finished close to its normal too, but was heavily influenced by a couple days of rain on the 4th and 5th. The 1.57” over those 2 days accounted for over 75% of the month’s total. In addition, there was a long dry stretch for the latter half of the month with nary a flurry from the 20th through 28th. There were 5 days with measurable snowfall for the month, a couple more than average and mostly around ½” for each of those. |
 |
|
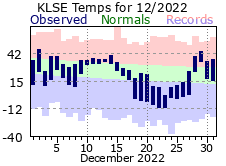
December ended 2022 as it began, on a chilly note, highlighted by a very cold 10 day stretch from the 18th through the 27th. Low temps were subzero on 8 of those days, with a high of only 1 on the 23rd. Precipitation was above normal for December, but mostly combined to the latter half of the month. Of the 13 days with measurable precipitation, 12 of those came after the 12th. Snowfall was plentiful, highlighted at mid month with measurable snows falling on all but one of the days from the 14th through 22nd (just a trace fell on the 18th). The 17” total for December was around 6 inches above normal. |
 |
|
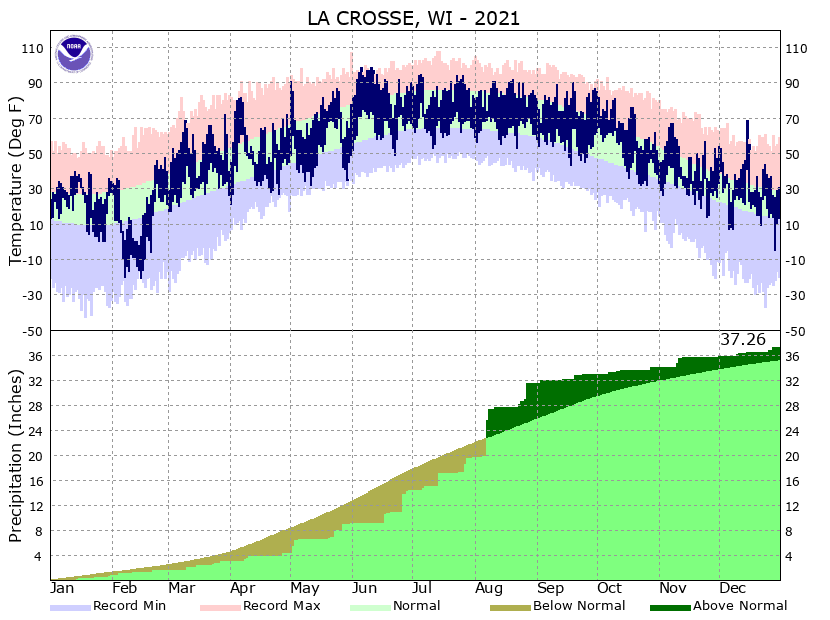
Temperatures for 2022 were on the cooler side, mostly thanks to a cold start and then very cold end to the year. After April, monthly temperatures held closer to their normals through November. However, most of those months experienced broad fluctuations between their warmest and coldest temperatures, over 50 degrees in some cases. These wide variances averaged each other “out”, pushing temps toward their normal, masking the true nature of how variable temperatures really were. There were 32 days with zero or colder temperatures, above the average of 24. The number of 90 degree days were right on the average (15) but 80 degree or warmer days topped out at 93 – well above the average of 73 and 13th most in a year for La Crosse. It was a dry 2022 in La Crosse, finishing under 30 inches for the first time since 2012. Still, there were 118 days with measurable precipitation, near the average. However, less than 1/10” fell on 61 of those days – over 50%. So when there was precipitation, it tended to not be much. Snowfall for the 2021-22 season (July-June) was only 30.5”, lowest since the 2011-12 winter and well under the normal of 46.3”” |
 |
| Highest temperature for 2022 | 98 on June 14th and 20th |
| Lowest temperature for 2022 | -18 on January 26th |
| Highest one-day precipitation | 2.09" on June 13th |
| Highest one-day snowfall | 5.0" on December 9th |
| Number of days with highs at or above 90 degrees | 15 |
| Number of days with highs at or below 32 degrees | 62 |
| Number of days with zero or below temperatures | 32 |
| Peak wind gust | 81 mph from NW on July 23rd |
| Number of days with measurable precipitation | 120 |
| Percentage of days with measurable precipitation | 33% |
| Number of days with above normal temperatures | 162 |
| Percentage of days with above normal temperatures | 44% |

