| Temperatures | Precipitation | ||||||
| Month | High | Low | Average | Departure | Total | Departure | Snow |
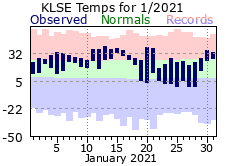
| January | 30.3 | 16.5 | 23.4 | +6.0 | 0.89 | -0.23 | 9.0 |
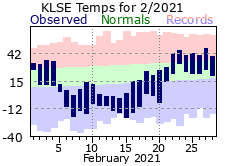
| February | 22.3 | 3.3 | 12.8 | -9.7 | 0.73 | =0. | 11.9 |
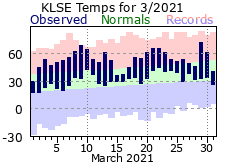
| March | 53.3 | 31.2 | 42.2 | +7.7 | 1.51 | -0.53 | 4.0 |
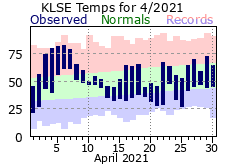
| April | 60.4 | 40.2 | 50.3 | +1.7 | 1.32 | -2.02 | T |
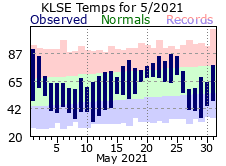
| May | 71.8 | 49.8 | 60.8 | -0.2 | 4.74 | +0.41 | 0.0 |
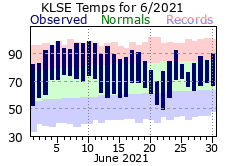
| June | 88.2 | 64.9 | 76.6 | +5.6 | 5.30 | +0.22 | ... |
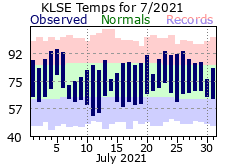
| July | 85.6 | 65.2 | 75.4 | +0.4 | 5.21 | +0.98 | ... |
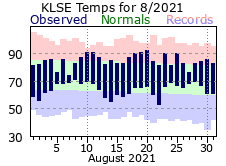
| August | 84.6 | 63.9 | 74.3 | +1.5 | 11.78 | +7.88 | ... |
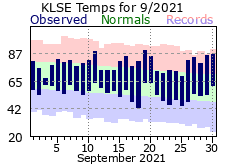
| September | 79.1 | 55.3 | 67.2 | +2.4 | 1.43 | -2.20 | ... |
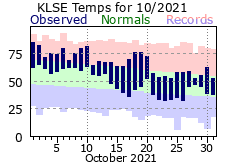
| October | 66.8 | 48.5 | 57.6 | +5.9 | 1.05 | -1.44 | 0.0 |
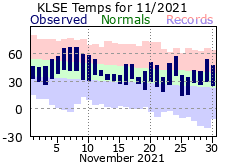
| November | 47.6 | 29.7 | 38.7 | +1.1 | 1.58 | -0.27 | 0.8 |
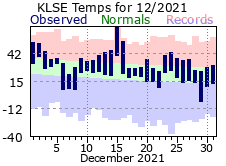
| December | 37.3 | 20.1 | 28.7 | +3.6 | 1.72 | +0.23 | 15.0 |
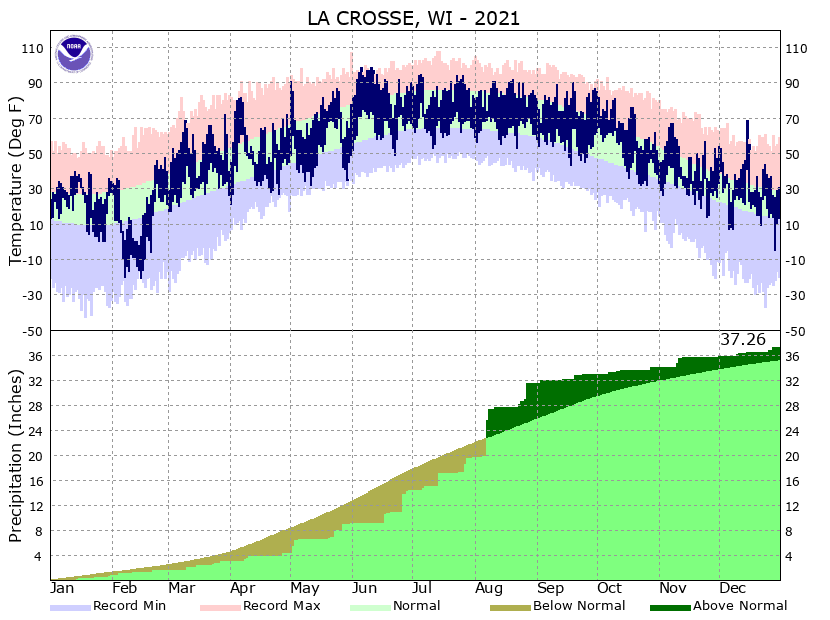
| TOTALS: | 60.6 | 40.7 | 50.7 | +1.8 | 37.26 | +2.03 | *** |
Records
Temperature...
Highs:
Lows:
Highest Lows:
Lowest Highs:
Monthly:
Seasonal:
Yearly:
Precipitation...
One-day pcpn:
One-day snowfall:
Monthly pcpn:
Monthly snowfall:
Seasonal precipitation:
Yearly precipitation:
|
January got 2021 started off on a mild note with above normal temperatures through the first 18 days. That mild stretch of days was the 6th warmest start on record (1st through the 18th) for January in La Crosse, tied with previous years. Temps took a tumble after that with below normal temperatures on 7 out of the next 10 days. The last few days would rebound to the mild conditions that the month started on. Low temperatures fell to zero on 3 days, but never dropped below. That has only occurred 5 other times in January, with the most recent back in 2006. On average there are 10 days with subzero temps in La Crosse. Precipitation was close to the normal for January, with snow coming in a few inches below. There wasn’t any measurable snow for almost the first 2 weeks of the new year, with 3 inches finally falling on the 14th. After that, there would be periodic snowfalls with daily amounts holding under 2 inches. |
 |
|
The mild end of January persisted into February until a winter storm plowed through the region on the 4th. After that, temperatures took a significant dive with arctic air funneling southward and then holding across the Upper Mississippi River Valley through mid month. Below normal temperatures were recorded from the 5th through 21st. It was so cold that highs never warmed above zero from the 12th through the 14th. Below zero lows occurred on 13 days, more than double the average of 6. Further, lows bottomed out from -10 and colder on 9 days, tied for 5th most in a February. The thermostat would be cranked up for the last week of February with temps topping out in the 40s and lows mostly in the 20s – closer to the normal highs for that time of year. On the whole, February finished around 10 degrees below normal, with that moderating mild finish providing just enough warmth to keep it out of the top 10 coldest (finished 19th). Snowfall for the month was a couple inches above normal, with the bulk of that coming on 2 days (5.8” on the 4th and 4.4” on the 21st). There were only 3 other days with measurable snow. |
 |
|
The mild end to February would persist for most of March, with only 4 days of below normal temperatures. The first 60 degree day of the year came on the 8th, a couple weeks early compared to the average. Temps would warm to 60 or more on 10 days in March, well above the average of 3 and tying it for 6th most in a March. This spate of warm days also produced the first 70 degree day of 2021 with 72 on the 29th. Despite averaging over 7 ½ degrees above normal, there was significant fluctuation in temps with highs ranging from 29 on the 1st to that 72 degree day. All said, March would finish as the 7th warmest on record in La Crosse. Precipitation for March was around ½ inch below normal with snowfall also finishing a few inches below the normal. In fact, there were only 2 days with measurable snow and one accounted for nearly the entire month’s total (3.9” of the 4” March total fell on the 15th). That snowfall on the 15th would be the last measurable snow for the 2020-21 season, a few weeks earlier than the average (April 4th). |
 |
|
April saw its share of ups and downs when it came to temperatures, with a high of 54 on the first quickly reaching 80 on the 4th. This 80 degree temperature was almost a month earlier than normal and 12th earliest 80 day on record for La Crosse. Highs would warm to 70 degrees or greater 7 times, but couldn’t crack 50 degrees on 6 days. Despite the swings in temperatures, April would finish a bit above normal. Precipitation was fairly sparse with measurable precipitation on only 7 days (average is 11). The 8th through 10th recorded around ¼” each day, with another ½” coming on 27th. It was generally dry otherwise. There were a few flurries on the 14th, otherwise April was snow free.
|
 |
|
May was another month with wide fluctuations in temperature, which should be expected for a spring transitional month. Summer lovers were likely overjoyed with the 91 degree day to kick off the month. That is over 5 weeks sooner than the average first 90 degree day and 11th fastest in a year for La Crosse. That taste of summer would be short-lived as highs would tumble back into the 50s and 60s after that. Temperatures would still manage to push past 80 degrees on 5 days for the month. On the whole, all the fluctuations averaged out right at the May normal. Rainfall was also close to what is expected in May, but went it fell, it was feast or famine. Out of the 12 days with measurable precipitation, 4 of those recorded around 1”. The other 8 days were generally around 1/10” or less. The spring months of March, April and May averaged 51.1 degrees for temperature, marking it as the 8th warmest spring on record for La Crosse.
|
 |
|
June was a very warm month, hot by some standards. High temperatures reached or exceeded 90 14 times, tied for second most in a June and blew away the average of 3. In fact, it was just one under what occurs on average over an entire year. There was a streak of 9 consecutive days where highs exceed 90, twice peaking at 99 degrees (5th and 10th). The average temp during this period was 96.0 degrees and was one of the hottest stretches on record in La Crosse. Interestingly, during most of the streak humidity was relatively low, which resulted in heat indices not much higher than the temperature. In addition, low temps for the month only dropped into the 70s on 10 days – a record for June. Overall, the monthly average of 76.6 made it the all-time warmest June on record for La Crosse. With the warmth came dry conditions. The first measurable rain didn’t fall until the 17th, although almost 1 ½” fell that day. After that there 7 more days with measurable rain, with 2.77” on the 26th accounting for half of the monthly total. Despite the dry start, the wet end to the month allowed June to finish right around its normal. |
 |
|
Temperatures were fairly typical for July with daily averages generally staying within a few degrees of the normal. Highs topped 90 degrees 8 times, but also settled in the 70s on 6 days. The month finished almost 1” inch above its normal for rainfall with measurable rain falling on 11 days. However, 3 of those days accounted for 85% of the 5.21” monthly total (14th, 27th, and 28th). |
 |
|
Summer warmth continued in August with temperatures, again, holding within a few degrees of the daily normal. The month would finish 1 ½ degrees above normal with 7 more days topping 90 or greater. It was a very wet month with measurable rain on 12 days, 4 or which accounted for ½” or more. For most months and most years, the 2.52” on the 27th would be the highlight. However, La Crosse experienced a deluge of record proportions as 7.36” fell over the 7th and 8th. This set a record for most precipitation in a 2 day period while the 5.59” on the 7th established a new one-day record rainfall for La Crosse. The final tally at month’s end was 11.78”, making it the 2nd wettest August and the 3rd wettest month out of any month for La Crosse. The summer months of June, July and August was the 2nd warmest on record for La Crosse at 75.4 degrees. The 29 days of 90 degrees or warmer were the 8th most for a summer. Total rainfall of 22.29”made it the wettest summer on record. In addition, there were 8 days of 1” or more of rainfall – tying it with a few other years for the most in a summer. Further, the 4 days of 2” or more were the most in any summer for La Crosse. |
 |
|
September was warm by its standards, averaging almost 2 ½ degrees above normal. There were 15 days of 80 degree highs or warmer (tied for 5th most in a September) while also recording the last 90 degree day of the year on the 19th. This is approximately 3 weeks later than the average. Mother Nature would provide some relief from the wet summer with a dry September. Measurable rain fell on only 4 days, tying it for the 2nd least in a September and well below the average of 10. Those 4 days did manage to accumulate almost 1 ½” or rainfall. On the whole, the month would finish 2.20” below its normal. |
 |
|
Mild fall weather settled in for the first 3 weeks of October with above normal temperatures through the 20th. This 20 day stretch to start October averaged 63.6 degrees and was the 2nd warmest of its kind on record for La Crosse. Temperatures would drop back to more seasonable levels on the 21st, holding for the rest of the month. Highs reached or exceeded 80 5 times with the last 80 degree day (81) of 2021 coming on the 10th. Despite the warmth, La Crosse did manage to cool to freezing on the morning of the 26th for the first freeze of the fall season. Overall, the average temp for the month of 57.6 degrees was almost 6 degrees above normal and made it the 5th warmest October on record. The dry fall continued with barely an inch falling for October. The meager total was spread out across 10 days with less than 1/10” of an inch falling on 6 of those. |
 |
|
November continued the mild and dry fall conditions, although a bit closer to normal compared to the other 2 months. Average temperatures for the month were around a degree above normal, with a 3 day streak of highs in the mid 60s (6th-8th) helping with that. Precipitation in November only finished around ¼” below its normal, but the 1.58” total came on 5 consecutive days at mid month (10th through the 14th). The first snow of the young winter season fell on the 13th with 0.7”, right around the average in La Crosse Overall, the fall months of September, October and November averaged 54.5 degrees and made it the 5th warmest fall on record for La Crosse. It was also the 3rd consecutive season to mark a top 10 record for warmth (spring, summer did it too). Fall rainfall only eked out a bit above 4 inches, not a top 10 record but did finish in the top 20 for dryness. |
 |
|
December continued the streak of warm months that started in the summer, rounding out around 3 ½ degrees above normal. The highlight was a 69 degree day on the 15th which not only set a daily record, but also the all-time record for any day in December. This day also saw a rare round of severe weather for December, along with widespread strong winds. In fact, the strongest wind of 2021 occurred on the 16th as the responsible storm system was exiting, hitting 68 mph from the southwest. There were 6 days with measurable snow recording 15.0”, a few inches above a typical December. Much of that came from two storms, one that spread across the 10th and 11th (5.3”) and another on the 28th (another 5.3”). Mid month was fairly quiet for snow, only recording a few days with flurries from the 12th through the 25th. |
 |
|
2021 will be remembered as a very warm year for La Crosse. Its 50.7 degree average made it the 5th warmest on record and only the 8th time average temps have exceeded 50 degrees. High temperatures warmed to 90 or greater on 31 days (11th most in a year), marked by that very warm June. 2021 might have been even warmer if not for the chilly February. The year also finished around 2” above normal for precipitation. However, measurable precipitation only occurred on 99 days which is 12th least in a year (average is 116 such days). But when it rained, 2021 brought a lot of it. There were 10 days with an inch or more (average is 7) and 4 where 2” or greater fell (tied for most in a year). The highlight here was drenching in August with the wettest day and 2-day rainfall on record. |
 |
| Highest temperature for 2021 | 99 on June 5th and 10th |
| Lowest temperature for 2021 | -21 on February 15th |
| Highest one-day precipitation | 5.59" on August 7th |
| Highest one-day snowfall | 5.8" on February 4th |
| Number of days with highs at or above 90 degrees | 31 (11th most) |
| Number of days with highs at or below 32 degrees | 49 |
| Number of days with zero or below temperatures | 17 |
| Peak wind gust | 68 mph from SW on Dec 16th |
| Number of days with measurable precipitation | 99 (12th least) |
| Percentage of days with measurable precipitation | 27% |
| Number of days with above normal temperatures | 224 |
| Percentage of days with above normal temperatures | 61% |


 Weather Story
 Weather Map
 Local Radar