| Temperatures | Precipitation | ||||||
| Month | High | Low | Average | Departure | Total | Departure | Snow |
| January | 23.9 | 7.2 | 15.6 | -1.8 | 1.31 | +0.19 | 15.1 |
| February | 25.5 | 6.5 | 16.0 | -6.5 | 3.02 | +1.97 | 31.1 |
| March | 40.4 | 20.1 | 30.2 | -4.3 | 1.81 | -0.23 | 5.9 |
| April | 58.2 | 38.7 | 48.5 | -0.1 | 3.17 | -0.17 | 6.2 |
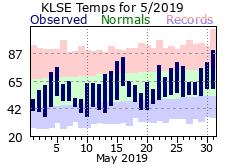
| May | 67.6 | 47.9 | 57.7 | -2.0 | 6.03 | +2.51 | 0.0 |
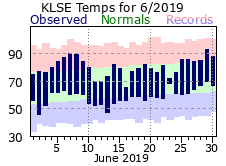
| June | 80.2 | 58.7 | 69.4 | +0.2 | 5.33 | +0.99 | ... |
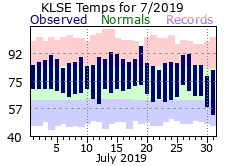
| July | 87.3 | 66.9 | 77.1 | +3.4 | 6.55 | +2.29 | ... |
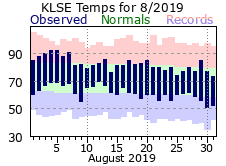
| August | 82.3 | 61.5 | 71.9 | +0.5 | 1.66 | -2.63 | ... |
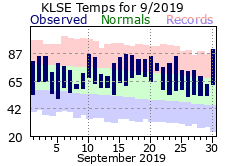
| September | 78.2 | 60.0 | 69.1 | +6.3 | 6.77 | +3.21 | ... |
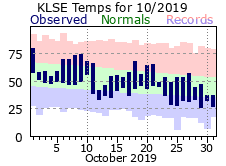
| October | 57.1 | 40.9 | 49.0 | -1.2 | 4.85 | +2.68 | T |
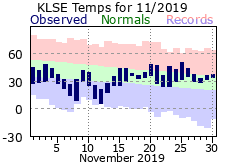
| November | 38.4 | 26.4 | 32.4 | -3.5 | 2.74 | +0.73 | 6.5 |
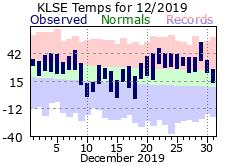
| December | 34.9 | 19.6 | 27.2 | +5.6 | 1.43 | +0.07 | 5.0 |
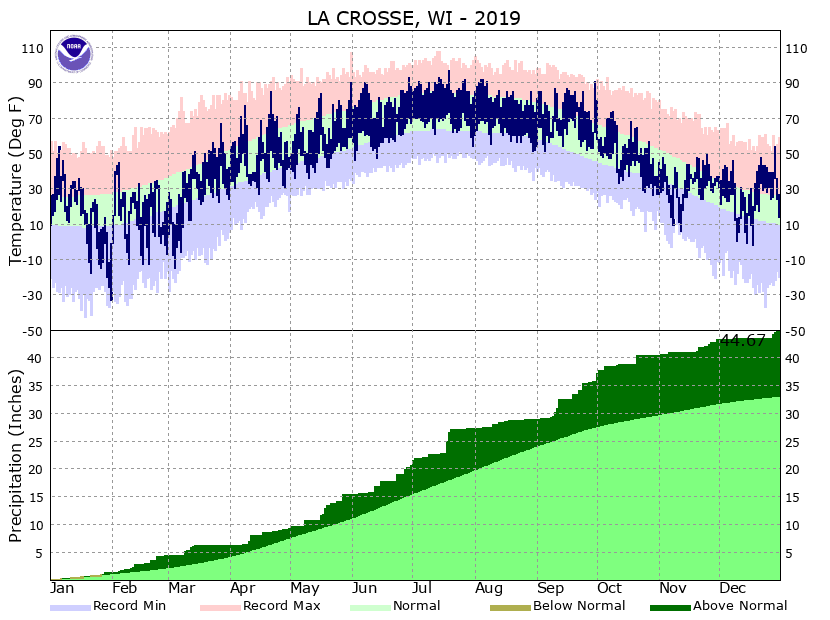
| TOTALS: | 56.2 | 37.9 | 47.0 | -0.4 | 44.67 | +11.67 | *** |
Records
Temperature...
Highs:
Lows:
Highest Lows:
Lowest Highs:
Monthly:
Seasonal:
Yearly:
Precipitation...
One-day pcpn:
One-day snowfall:
Monthly pcpn:
Monthly snowfall:
Seasonal precipitation:
Yearly precipitation:
|
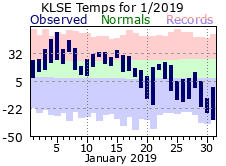
January kicked off 2019 on a very mild note with above normal temperatures on 15 of the first 17 days. Highs even broke the 50 degree mark (54 on the 5th) – a rare occurrence for January. The second half of the month would see a return of cold air, with a significant arctic outbreak at month’s end. Highs only managed to warm out of the single digits once after the 24th, while temperatures never made it above zero from the night of the 29th into the morning of February 1st. The frigid -33 low on the morning of the 31st not only set a record for that day but was also the 13th coldest temperature on record for La Crosse. The mild start offset the very cold end to the month as January finished just a couple degrees below its normal. Precipitation was right around normal, although there wasn’t any measurable snow through the first 2 weeks of the month. After the 16th, there were 10 days with measurable snow, with the bulk of the month’s 15.1” total coming from a winter storm on the 27th-28th (8.7”). |
 |
|
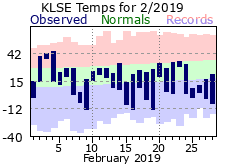
February would bring a short break from the cold starting on the 2nd with 3 consecutive days with highs in the 40s. Temperatures took another tumble after that, averaging below normal on 18 of the remaining 24 days. The average temperature for the month of 16 degrees was 6 ½ degrees below normal. It was a wet February. Measurable precipitation fell on 14 days, well over the average of 8 and tied for 4th most in a February. Snow came often and was plentiful. There was an inch or more on 8 days (a record for February), with 3 inches or more on 4 of those (also a February record). The monthly total of 31.1” just barely beat out 1959’s 31.0” for the snowiest February on record – which also placed it as the 7th snowiest month for La Crosse. |
 |
|
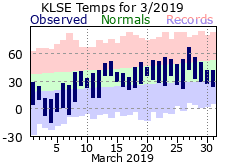
The February cold continued through the first week of March. The average temperature for the first 7 days was only 8.9 degrees which made it the 3rd coldest first week for a March. Temperatures would moderate after that, mostly holding at or above normal. Still, the cold start left the average temperature for the entire month over 4 degrees below normal. Precipitation for the month was right around normal, but all of that fell within the first half of March. After the 14th, no measurable precipitation fell in La Crosse. Snowfall was about an inch below normal, with 3 days accounting for all of the monthly total. |
 |
|
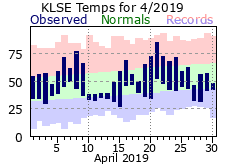
April was fairly typical for a spring month with cold and mild stretches. For instance, highs were in the 60s and 70s for the 6th through the 9th, but then didn’t reach 40 on the 10th through the 13th. Overall, highs were in the 30s and 40s on 8 days (normal) and in the 70s and 80s for 6 days (1 day above normal). The last freeze of the spring came on the 28th (low of 31 degrees), right around when that usually occurs. Precipitation was normal for April, but mostly came in small amounts here and there. Measurable precipitation fell on 15 days, tied for 9th most in an April, but less than ¼ of an inch fell on 12 of those. The last snowfall for the 2018-19 would fall on the 27th with 0.3” – well past the average of April 4th for the last snowfall in a season and tied for 12 latest in La Crosse.
Snowfall for the 2018-19 season (July through June) was 64.3 inches, 12th highest on record for La Crosse. |
 |
|
May continued the cold start to 2019 averaging 2 degrees below its normal. That said, there were no significant cold stretches, or warm for that matter. Temperatures were below normal on 18 days but still managed to reach 80 degrees or warmer on 5 days, even climbing to 90 on the 31st. It was a wet month, with the rainfall having a hand in keeping May on the cool-side. There were 13 days with measurable precipitation with generally no more than a few days in between rainfall. Over an inch fell on 4 of those days – a record for the month (tied with 1908).
|
 |
|
June was right around its normal for temperatures, but if you were looking for summer-warmth, you had to wait until month’s end. After a brief warm up with highs in the 80s to around 90 for the 4th through 10th, they took a tumble for much of the rest of the month. Highs were in the 70s for 11 of the next 14 days (with a cool high of only 65 on the 16th). Summer did show up for the end of the month though with mid 80s to lower 90s. June was wet overall, finishing around an inch above its normal. There was measurable rainfall on 10 days, which is actually below what occurs in an average June (12 days), but when it did measure, the rain fell in chunks. Around 1/3rd of an inch or greater fell on 7 of those 10 days, well above the average of 4 for a June. |
 |
|
The summer warmth that settled in at the end of June would continue for much of July. Highs were 85 or greater on 25 of the 31 days - 5th most in a July. Temperatures made it into the 90s 8 times (near normal) with the warmest day of 2019 coming on the 19th (97 degrees). Not to be outdone, low temperatures were 70 degrees or warmer on 11 days – well above the average of 5 and tied for 10th most for a July. It would stay wet though with monthly rainfall around 2 ¼ inches above normal. A bulk of that rain came over the 18th through 20th with 4.23” falling during that 3-day span. A thunderstorm would bring the peak wind of 2019 for La Crosse - a northwest gust at 52 mph on the 20th. |
 |
|
August would kick off with a week’s worth of warmth, but temperatures would then cool down to hover right around the August normals for the rest of the month. On the whole, the monthly average was close to a typical August for La Crosse. August would also dry out after the soggy start to the summer that June and July brought. There were only 7 days with measurable precipitation (average is 10) with none of those days accumulating more than ½ inch. The monthly total of 1.66 inches was over 2 ½ inches below normal. |
 |
|
September got the traditional fall months off to a warm and wet start. Temperatures climbed to 80 degrees or greater 14 times, with the last 90 degree day of 2019 coming on the 30th (91). Highs didn’t reach 70 on only 4 days, tied for 5th least for a September in La Crosse. In addition, low temperatures never cooled into the 40s for only the 3rd time on record (2016 and 1884 are the other years). Overall, the average temperature of 69.1 degrees was over 6 degrees above normal and made it the 2nd warmest September on record. The warmth was also more reminiscent of what one would expect for the start of summer, not the start of fall. Rain returned in earnest in September. Measurable rains fell on half of the days (tied for 10th most in a September) with 6 of those recording at least ½ inch (tied for 6th most). There were 6 consecutive days with measurable rains from the 8th through 13th with generally no more than a few dry days between wet ones. |
 |
|
The warmth of September would be left in the rearview mirror as the calendar flipped to October. After a pleasant 80 degree day on the 1st, highs would struggle to warm out of the 50s the rest of the month. Temperatures never saw 60 on 21 days (tied for 11th most in an October and well ahead of the 15 day average) and couldn’t even warm to 50 on 8 days. That said, the first freeze of the fall would come on the 24th, about 2 weeks later than average. October would finish around 1 degree below normal. While the warmth didn’t follow, the wetness of September did. Almost 5 inches (4.85”) of rain fell in October, making it the 9th wettest on record. The bulk of that fell on just 2 days with the 1st and 21st accumulating 3.20” or 66% of the monthly total. The end of the month did bring a break from the soggy conditions with no measurable rains after the 22nd. The first snow flurries of the season would fall on the 11th.
|
 |
|
November kept the cold trend going, more so for the first half of the month. Through the 15th the average temperature was only 28.9 degrees, tied for the second coldest 1st half to a November on record. Highs couldn’t warm out of the 20s and 30s on 17 days for the entire month (average is 12) with the first single digit low of the new winter season on the 8th (9 degrees – well ahead of the average of Nov 30th). The second half of November saw the return of more seasonable to mild temperatures with only one colder than normal day after the 15th. Like the previous two fall months, November continued the wet trend although not nearly as soggy as September and October. Measurable precipitation fell on half the days, tied for 5th most in a November. Amounts were light most days, recording less than 1/10 of an inch on 9 of those. The first accumulating snow for the 2019-2020 snowfall season came on the 6th. While this was within a few days of when measurable snows usually fall in La Crosse, the 4 ½ inch total was the 4th most for a first measurable snow on record. For the fall months (Sep-Nov) over 14 inches of precipitation fell with the 14.36” total making it the 5th wettest on record for La Crosse, |
 |
|
December would end 2019 on mild note with 22 out of the 31 days above normal. The latter half was particularly mild with temperatures averaging 32.9 degrees from the 19th through the 31st – the 8th warmest for a December at La Crosse. Despite finishing right around its normal for precipitation, it was a fairly dry month. There were only 4 days with measurable precipitation through the 27th, with 2 days of rain on the 28th and 29th then accounting for about 70% of the monthly total. Snowfall suffered as a result of the lack of wet days and mild conditions. There were only 5 days with measurable snow in La Crosse with only 2 of those accounting for more than an inch. |
 |
|
2019 will be remembered as one of the soggiest on record for La Crosse with the 44.67” yearly totally making it the 3rd wettest all time. While there was only one day with over 2 inches of precipitation, there were 30 days when ½ inch or more fell (tied for 3rd most in a year) with 13 of those recording an 1 or more (4th all time). It was also a very snowy start to 2019 with 58.3” falling over the first 4 months (4th highest total to start a year). Temperatures were right around the yearly normal but marked by a cold start and a warmer middle part of the year. |
 |
| Highest temperature for 2019 | 97 on July 19th |
| Lowest temperature for 2019 | -33 on January 31st |
| Highest one-day precipitation | 2.05" on July 18th |
| Highest one-day snowfall | 9.0" on February 12th |
| Number of days with highs at or above 90 degrees | 16 |
| Number of days with highs at or below 32 degrees | 66 |
| Number of days with zero or below temperatures | 28 |
| Peak wind gust | 52 mph from the NW on July 20th |
| Number of days with measurable precipitation | 134 |
| Percentage of days with measurable precipitation | 37% |
| Number of days with above normal temperatures | 186 |
| Percentage of days with above normal temperatures | 51% |

