| Temperatures | Precipitation | ||||||
| Month | High | Low | Average | Departure | Total | Departure | Snow |
| January | 29.0 | 10.6 | 19.8 | +2.4 | 1.09 | -0.03 | 6.5 |
| February | 28.5 | 12.2 | 20.3 | -2.2 | 1.31 | +0.26 | 15.0 |
| March | 34.9 | 17.6 | 26.2 | -8.3 | 2.12 | +0.08 | 15.6 |
| April | 51.1 | 34.0 | 42.6 | -6.0 | 5.92 | +2.58 | 4.2 |
| May | 69.1 | 49.2 | 59.1 | -0.6 | 8.49 | +4.97 | 0.8 |
| June | 77.1 | 59.6 | 68.3 | -0.8 | 5.82 | +1.48 | ... |
| July | 85.0 | 63.5 | 74.2 | +0.5 | 1.36 | -2.90 | T |
| August | 84.1 | 62.1 | 73.1 | +1.7 | 1.04 | -3.25 | ... |
| September | 78.1 | 55.8 | 67.0 | +4.2 | 1.61 | -1.95 | ... |
| October | 60.8 | 40.7 | 50.8 | +0.6 | 3.84 | +1.67 | T |
| November | 43.5 | 26.7 | 35.1 | -0.8 | 1.77 | -0.24 | 1.0 |
| December | 23.9 | 7.3 | 15.6 | -6.0 | 1.52 | +0.16 | 12.7 |
| TOTALS: | 55.4 | 36.6 | 46.0 | -1.4 | 35.89 | +2.83 | *** |
Records
Temperature...
Highs:
Lows:
Highest Lows:
Lowest Highs:
Monthly:
Seasonal:
Yearly:
Precipitation...
One-day pcpn:
One-day snowfall:
Monthly pcpn:
Monthly snowfall:
Seasonal precipitation:
Yearly precipitation:
|
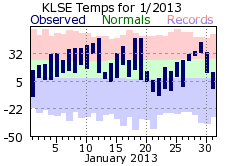
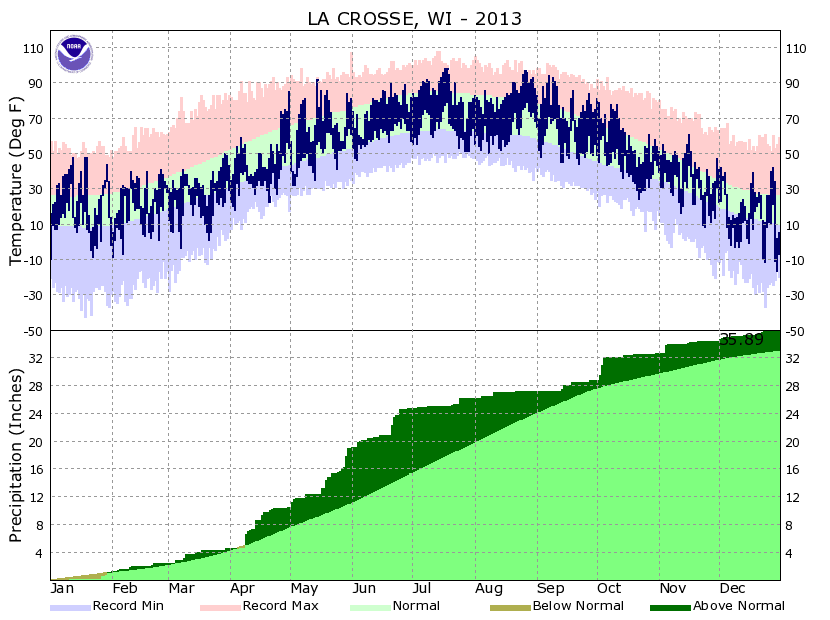
January got 2013 off to a cold start with a chilly -10 degrees greeting early morning risers. Temperatures would end up a couple degrees above normal for the month, but there were a lot of up’s and down’s. Highs reached 40 or greater 7 times, but failed to make it out of the teens 8 times (with single digit highs on the 21st and 22nd). It was a dry start to 2013 as less than ¼ of inch of precipitation fell through the 26th – only amounting to 1 inch of snow. Almost an inch of precipitation fell after that, with the bulk of January’s snow coming on the 30th (4.9 inches). Precipitation ended up right around the normal.
|
 |
| Cold air greeted February with temperatures not reaching 20 degrees until the 5th of the month. Temperatures would vary until the end of the month, but averages would wind up below the February normals - close to how January finished. Temperatures only reached 40 or greater on 3 days, while 16 days failed to break the freezing mark. The wet end of January persisted into February as measureable precipitation fell on the first 5 days, with around an inch or more of snow falling each of those days. At least a trace of precipitation would then fall through the 14th. There wasn’t much of a break from precipitation for the second half of February with 5 more days of measurable precipitation and 7.4 inches of snowfall. The 15.1 inch total for February nearly doubled its normal and is one of the 20 snowiest Februaries on record. | 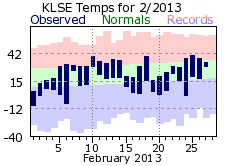 |
| Any thoughts of spring as the calendar turned to March were quickly squashed with below normal temperatures for the first 8 days and a below zero low on the 7th. There were only 3 days above normal with 13 days where temperatures couldn’t warm above freezing. March finished over 8 degrees below normal and was the 15th coldest on record at 26.2 degrees. Temperatures felt like winter, and so did the precipitation. Measurable snow fell on 7 of the first 18 days. The 15.6 total made it the 19th snowiest March on record for La Crosse. The biggest one-day snowfall for the 2012-13 came in March, with 7.7 inches on 5th. The second half of the month was dry though as only 2 days received measureable precipitation. | 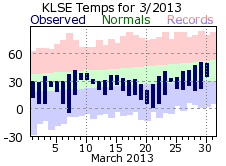 |
|
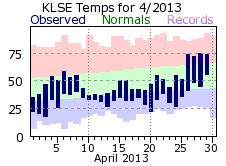
Winter coats, hats and mittens were still needed in April. Freezing temperatures occurred on 13 days while highs never made it out of the 40s on 14 days (well above the April normal of 8 days). The 42.6 average monthly temperature tied it for the 10th coldest April on record. Adding insult to injury, measurable snow fell on 6 days, one short of the record of 7 for an April. However, most of the daily amounts were small – less than an inch. The 4.2 inch monthly total tied it for the 17th snowiest April on record for La Crosse. Winter didn’t hold reign for the whole month. Warmer temperatures made an appearance for the last 5 days, cracking 80 on the 30th. Also, rainfall was fairly significant. Measurable precipitation fell on 17 of the 30 days, well above the average of 11 and just one day off the record of 18 (2011 and 1893). The total liquid precipitation for the month was 5.92 inches, making it the 9th wettest April on record. The highest one-day total for 2013 also occurred this month – 1.83 inches on the 9th.
|
 |
|
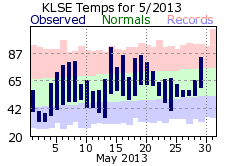
While April was wet by any standard, it paled compared to the deluge that fell in May. Measurable rain dropped on La Crosse 18 of the 31 days, 13 of those coming consecutively (19th through the 31st). One-half inch or more of rain fell on 7 days in May, with 3 days exceeding an inch. The 8.49 inch total made it the 3rd wettest May on record. There was even some measureable snow on the 2nd with 0.8 inches. The rain impacted farmers by water logging fields and delaying planting. Some early seeders lost crops, requiring replanting. Temperatures jumped around, cooler on the rainy days, warmer on the few rain-free. Highs ranged from a chilly 38 on the 3rd to a summery 92 on the 14th. Temperatures couldn’t break 60 on 7 days, but made 80 or greater 9 times. The monthly average was about ½ degree below normal, not hinting at the wild day-to-day swings that occurred.
The spring months of March-April-May totaled 16.53 inches of precipitation, making it the 2nd wettest spring on record for La Crosse (nearly doubling the 8.36 inch spring normal). The spring accounted for 50% of the yearly normal.
|
 |
|
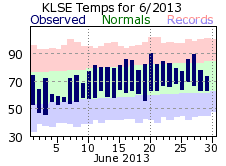
Rain jackets continued to be a necessity in June. More than half the days recorded measurable rain with the monthly total rounding out around 1 ½ inches above normal. The first 10 days of the month were quite cool, with the 5th and 6th not even reaching 60 degrees. Summer temperatures finally showed up for good around mid-month, although there was only one day that warmed to the 90 degree mark (the 20th).
|
 |
|
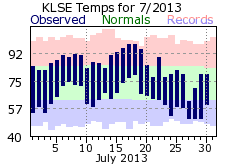
The faucet would finally be shut off in July, and as the following months would eventually attest to, once it was shut off, it wouldn’t turn back on. Measurable rain fell on only 7 days in La Crosse, with only one of those amounting to more than ¼ of an inch. The meager 1.36 total was closer to an average December or January than a typical July. It was the 9th driest July on record. Still, the month brought a much needed break from the rainfall, and gave the region some time to dry out. Temperatures were more summer-like with one hot stretch of note. There were 6 consecutive days with 90 or greater high temperatures (14th through 19th) with the high for the year of 98 coming on the 17th and 18th. Heat advisories were in effect during this time to account for the dangerous heat. There was a brief cool down at month’s end. Highs only reached 62 on the 27th, closer to the normal low. It was also the 2nd coldest high temperature for July on record, just missing the chilly 61 degree high of July 3rd, 1932.
|
 |
|
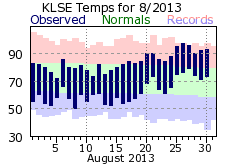
August was much like July – exceedingly dry, a bit above normal, and had a week of high heat. There were only 4 days with measurable rainfall, well below the normal of 10. Worse, over half the meager monthly total of 1.04 inches fell on one day – 0.63 inches on the 11th. It was the 8th driest July on record. From the 12th through the 31st only 0.11 inches of rain fell in La Crosse, and that came on the 22nd. Temperatures were a bit below normal for the first half of the month, but warmed up for the second half, including a 6 day stretch of 90 degree highs.
The July-August rainfall total of 2.40 inches was 2nd driest July-August on record for La Crosse.
|
 |
|
The dry trend continued into September with only 5 days of measurable precipitation – most of which fell during the middle part of the month. The month started off with 13 days of essentially arid conditions, recording trace amounts on 3 of those days. September would finish almost 2 inches below normal. The dry July through September stretch was the 3rd driest for this time period at La Crosse - only 4.01 inches. On the whole, it was a relatively warm month, finishing around 4 degrees above the September normal. Temperatures did jump around though. There were 4 days where highs reached or exceeded 90 degrees, but 4 days where highs could not crack 70.
|
 |
|
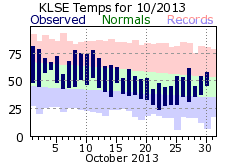
The first half of October was mild with highs in the 70s on 10 of the first 12 days. It would cool down after that, with a chilly stretch from 21st through the 24th where highs held in the 40s and lows were below freezing. On the whole, October rounded out right around its normal. Precipitation finally re-introduced itself to La Crosse as over 3 inches of rain fell during the first week. There would be 8 more days with measurable rainfall, although those would only amount to an additional 0.59 inches. The 3.84 inch October total was over 1 ½ inches above normal. The first snowfall of the season would come as a few flurries on the 21st.
|
 |
| November was close to its normal for temperature and precipitation. No big warm ups or cool downs, with daily temperatures generally close to the seasonal averages. Temperatures did warm above 60 once (the 16th) while lows dropped into the single digits on the 23rd and 24th. Precipitation was only ¼ inch below its normal and there were 10 days with measurable precipitation. However, well over ½ of the monthly total fell on the 5th – 1.07 inches – with only trace amounts after the 22nd. The first measurable snowfall for the 2013-14 winter season fell on the 11th, but the 1 inch monthly total was a few inches below normal. | 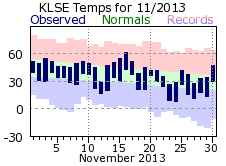 |
|
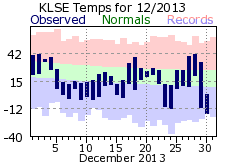
After a fairly seasonal start to the month, bitter cold moved in by the 5th of December, hanging on through the 16th. Single digit lows (above and below zero) were common during this period, with highs mostly in the teens – closer to the normal lows rather than highs. The cold trend would persist for the rest of the month, with 4 days of -10 of colder lows and only single digit highs for the 30th and 31st. Precipitation fell on about half the days of December (16 out of 31), with 13 of those recording measurable snowfall. The 12.7 inch snow total was a bit above normal, but there was not a day with more than 3 inches. Generally, when the snow fell, it came in 2 inch or less increments.
|
 |
|
2013 will be remembered for its extreme wet and dry periods. Spring brought days of rain, finishing as the second wettest spring on record for La Crosse. It wasn’t all rain though, as the bulk of the 2012-13 snowfall fell in the late winter-early spring months. Almost 36 inches of snow fell from February through May - 8th most for this time period, and close to the normal for an entire season (43.3”). Precipitation became a distant memory as the calendar moved into mid-summer and early fall. The July-September period was over 8 inches below normal, and was the 3rd driest for this time period. So, despite 2013 finishing above normal for precipitation, the number doesn't tell the whole story. Looking at the year in halves, through June 24.75 inches fell – 2nd wettest start to any year in La Crosse. From July through December, only 11.14 inches fell – 15th driest end to a year for La Crosse.
|
 |
| Highest temperature for 2013 | 98 on July 17th and 18th |
| Lowest temperature for 2013 | -17 on December 30th |
| Highest one-day precipitation | 1.83 inches on April 9th |
| Highest one-day snowfall | 7.7 inches on March 7th |
| Number of days with highs at or above 90 degrees | 25 |
| Number of days with highs at or below 32 degrees | 74 |
| Number of days with zero or below temperatures | 21 |
| Peak wind gust | 51 mph from the W on January 19th |
| Number of days with measurable precipitation | 140 |
| Percentage of days with measurable precipitation | 38% |
| Number of days with above normal temperatures | 170 |
| Percentage of days with above normal temperatures | 46% |


 Weather Story
 Weather Map
 Local Radar