| Temperatures | Precipitation | ||||||
| Month | High | Low | Average | Departure | Total | Departure | Snow |
| January | 21.9 | 7.7 | 14.8 | -1.1 | 1.46 | +0.27 | 5.0 |
| February | 29.1 | 10.4 | 19.8 | -2.8 | 0.79 | -0.20 | 9.5 |
| March | 51.7 | 29.2 | 40.5 | +5.9 | 0.71 | -1.29 | 0.0 |
| April | 66.2 | 42.9 | 54.5 | +6.1 | 2.18 | -1.20 | 0.0 |
| May | 72.4 | 49.6 | 61.0 | +0.4 | 3.37 | -0.01 | 0.0 |
| June | 79.0 | 60.1 | 69.5 | -0.1 | 9.01 | +5.01 | ... |
| July | 84.8 | 66.2 | 75.5 | +1.5 | 6.08 | +1.83 | ... |
| August | 85.6 | 66.1 | 75.8 | +4.2 | 5.84 | +1.56 | ... |
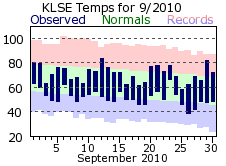
| September | 71.0 | 51.4 | 61.2 | -1.5 | 7.03 | +3.63 | ... |
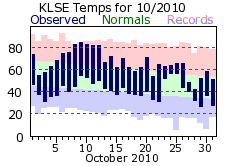
| October | 65.8 | 41.4 | 53.6 | +3.0 | 2.08 | -0.08 | ... |
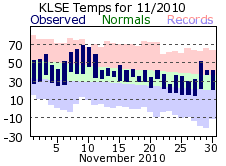
| November | 45.5 | 28.8 | 37.2 | +1.7 | 1.93 | -0.17 | T |
| December | 24.6 | 8.9 | 16.7 | -5.1 | 2.40 | +1.17 | 32.3 |
| TOTALS: | 58.1 | 38.6 | 48.3 | +0.8 | 42.88 | +10.52 | *** |
Records
Temperature...
Highs:
Lows:
Highest Lows:
Lowest Highs:
Monthly:
Seasonal:
Yearly:
Precipitation...
One-day pcpn:
One-day snowfall:
Monthly pcpn:
Monthly snowfall:
Seasonal precipitation:
Yearly precipitation:
| January kicked 2010 off on a cold note as low temperatures dropped to, or below 0, for the first 10 days. Temperatures warmed for mid month, but cool readings returned by month’s end. Nearly 1 ½ inches of precipitation fell in January, close to the monthly normal. However, much of that fell as rain with over an inch falling on the 23rd and 24th when temperatures stayed above the freezing mark. Snowfall for the month was only 5 inches, well below the 12.9 inch normal. There were only 4 days with measurable snow fall, and most of that fell on the 7th with 3.6 inches. January is normally La Crosse’s snowiest month of the year. | 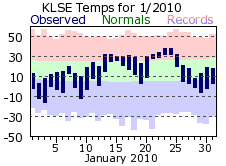 |
|
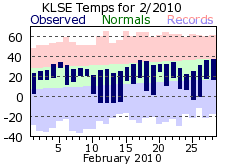
High temperatures in February were relatively consistent and close to normal while low temperatures were more variable. Lows in the teens to 20s kept conditions mild for the start of February. Lows would then fluctuate between below zero readings to mid teens for the rest of the month. Snow was more common in February compared to January with measurable snow falling on 9 days. The 9 ½ inch monthly total was a bit above normal, and much of the snow fell in the first half of the month. Amounts were spread out during this time, with 5 days recording an inch or more. The last measureable snow for the 2009-10 snow season would fall on the 20th, well ahead of the usual occurrence which is the first week of April.
|
 |
|
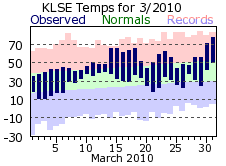
March of 2010 holds the distinction of being the first March on record without any snowfall. Nary a flurry flew during the month that normally receives over 7 inches of snow. As the lack of snow attests to, March was a dry month, with less than three-quarters of an inch of rain falling. Nearly the entire month’s total came on the 10th and 11th with 0.64 inches, 90% of the monthly total. After this brief wet period, it was dry from 12th through the end of the month. March was one of the warmest months of 2010 when compared to its average; nearly 6 degrees above normal. Temperatures exceeded 60 for the 14th through the 18th, with the first 70 degree highs of 2010 then coming on the 30th and 31st.
|
 |
|
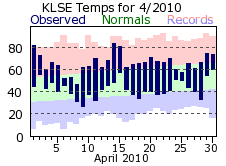
April continued the warm trend of the spring season with 82 degrees on April Fool’s Day. These mild conditions would persist throughout the month as only 4 days recorded temperatures below normal. However, temperatures did bounce around quite a bit as highs were in the 50s, 60s, 70s and 80s at various times during the month. Ultimately, the monthly average of 54.5 degrees made it the 3rd warmest April on record for La Crosse (tied with 1941). Precipitation for April was below normal and nearly the entire 2.18 inch total fell on 4 days. Mid month was particularly dry as only a trace of rain fell from the 7th through the 22nd. The first rumbles of thunder for 2010 came on the 2nd.
|
 |
| On the whole, May was about as average as it could get with temperatures and precipitation right around the monthly normal. That said, there was still a lot of variability in the temperature and rainfall. The start of the month was particularly cool, with below normal temperatures on 13 out of the first 16 days. Highs were only in the 50s for 3 of those days, while a very cool high of 49 occurred on the 8th. However, summer started to exert itself during the second half of the month as highs warmed into the 80s, reaching or exceeding 90 on 4 days. For rainfall, 85% of the monthly total came in the first two weeks. After that, measurable rain occurred on only 4 days for a total just under ½ of an inch. | 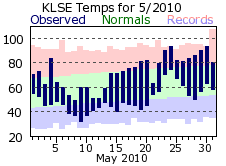 |
|
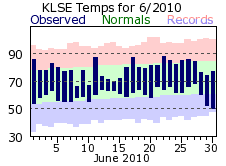
While the spring was somewhat dry, June would get the summer months off to a soggy start. Measurable rain fell on 19 of the 30 days, with 12 of those recording a quarter inch or more of accumulation while three days had over an inch. Typically June experiences 11 days with measurable rain. Rain was so prevalent during the month that the longest dry period was at month’s end when only a trace fell during the last 3 days. The monthly total of 9.01 inches made it the 6th wettest June on record. The ever present rain, and clouds that produce it, helped keep temperatures from warming much. The average temperature was right around the monthly normal, but highs were just as likely to be in the 70s as they were in the 80s. On two days, temperatures couldn’t even warm that much, with highs only making the mid 60s on the 8th and 10th.
|
 |
|
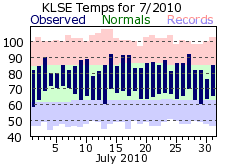
The spicket stayed wide open for July with 12 days of measurable rain adding up to over 6 inches of accumulation. Unlike June where rainfall was spread throughout the month, two-thirds of July’s total was confined to just three days: the 14th, 22nd, and 24th. Temperatures were seasonable with no significant warm-ups or cool downs. The peak wind gust of 2010 came in July with a thunderstorm induced 60 mph gust from the west on the 14th.
|
 |
|
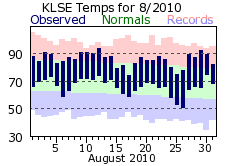
The wet summer persisted in August with nearly another 6 inches of rain. There were only 8 days with measurable precipitation this month, though, and like July the bulk of August’s total was thanks to just a few days. Nearly 90% of the 5.84 inch total fell on the 8th, 13th, and 31st. Month’s end did provide La Crosse an opportunity to dry out as only a trace of rain fell from the 21st through the 30th. Temperatures were at or above the seasonable normal, with the warmest temperature of 2010 coming on 12th with a 94 degree day The summer of 2010 will be remembered as the wettest on record as June, July and August dropped 20.93 inches of rain on La Crosse. This broke the previous record of 20.32 inches set back in 2007. A normal summer can expect 11.60 inches.
|
 |
|
September brought no relief from the rain and its 7.03 inch total made it the second wettest month of 2010 and marked the 4th consecutive month with above normal precipitation. In fact, the total accumulation from June through September accounted for almost 90% of the yearly normal of 32.36 inches for La Crosse. Like the previous two months, much of what fell in September was on account of just a few days, with 80% of the accumulation coming on the 15th, 22nd, and 23rd. While September was a bit below normal for temperature, it was an abrupt downward turn from the summery temperatures of late August. An 89 degree day on August 30th gave way to a cool 63 by September 3rd. Highs in the 60s occurred on 12 days, with a chilly 58 on the 25th.
|
 |
|
Conditions could not have been better for enjoying the fall colors as the first 3 weeks of October were mild, dry, and quiet. High temperatures topped 80 degrees on the 8th through the 12th, only a trace of rain fell through the 22nd, the winds were relatively light and sunshine was ample. The opposite would be true for the last 9 days of the month thanks to a change in the mild and dry weather pattern. It would rain for 4 straight days, with the entire month’s total of 2.08 inches falling on the 23rd through 26th. Temperatures also returned to seasonable levels. However, more significantly was a storm system that roared across the region on the 26th and 27th. A low pressure system tracked out of the Southern Plains, strengthening as it moved across the Upper Mississippi River Valley. While showers and thunderstorms did accompany the storm, it was the winds and the strength of the low pressure that made this storm note worth. This 2-day wind storm brought gusts of 50 to 60 mph to much of the region, with a peak of 59 in La Crosse. The pressure was so low in the storm that it set state records for lowest pressure in Minnesota and Wisconsin. La Crosse also set its record for lowest barometric pressure at 971.4 millibars. |
 |
|
November was more on par with respect to its normal, finishing a bit above normal for temperature and right around normal for precipitation. There was a short warm up near the start of the month with 4 consecutive days with highs over 60 (7th-10th), but there were also 3 days in the latter half of the month where highs did not climb above freezing. After a dry start to the month, rainfall would be fairly spread out from 12th through month’s end. The wettest day was the 13th with almost an inch. Snowfall, however, was hard to come by. There were several days with flurries, but no measurable snow fell. Normally, the first measureable snow of the winter season in La Crosse falls in the second week of November.
|
 |
| Mother Nature would make up for the lack of snow in November, and then some, as several snow storms would impact La Crosse. The 32.3 inch total would make it the 2nd snowiest December on record and the 5th snowiest month. The first accumulating snows of the season would fall on the 3rd and 4th with 7.1 inches. Within a week, a more significant storm would drop over a foot of snow on the 10th and 11th (15.1 inches). The 13.9 inch total on the 4th tied it for the 4th snowiest day on record for La Crosse. Snow would keep coming, with 4 more inches on the 20th and another 3.9 on Christmas Eve and Christmas Day. A warm up toward the end of the month would eat into the 21 inch snow pack, cutting it in half. It was a cold end to 2010 as December averaged around 5 degrees below normal. Most of that cold came in the first half of the month with the coldest day of 2010 on the 14th (-17 degrees). | 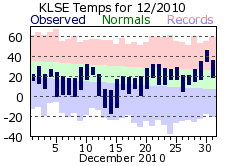 |
| 2010 will be remembered for its precipitation, both for its very wet and dry periods. While the 42.88 inches made it the 3rd wettest year on the record, it did not start out that way. The first 5 months of 2010 were 2 ½ inches below normal, with the first snowless March on record for La Crosse. The rain came in June though, and copious amounts would continue to fall through September. The 27.96 inches was the wettest June through September stretch on record. After a brief break from the above normal precipitation in November and October, December brought record snow by the shovel full. | 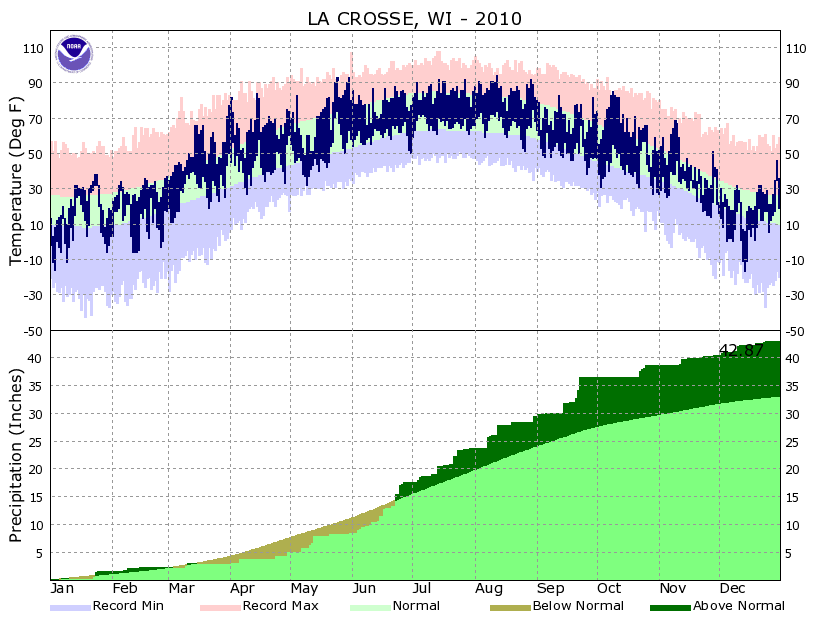 |
| Highest temperature for 2010 | 94 on August 12th |
| Lowest temperature for 2010 | -17 on December 14th |
| Highest one-day precipitation | 2.39 inches on September 23rd |
| Highest one-day snowfall | 13.9 inches on December 11th |
| Number of days with highs at or above 90 degrees | 15 |
| Number of days with highs at or below 32 degrees | 81 |
| Number of days with zero or below temperatures | 23 |
| Peak wind gust | 60 mph from the west on July 14th |
| Number of days with measurable precipitation | 113 |
| Percentage of days with measurable precipitation | 31% |
| Number of days with above normal temperatures | 206 |
| Percentage of days with above normal temperatures | 56% |


 Weather Story
 Weather Map
 Local Radar