|
July 2023 Temperatures in the Upper Mississippi River Valley
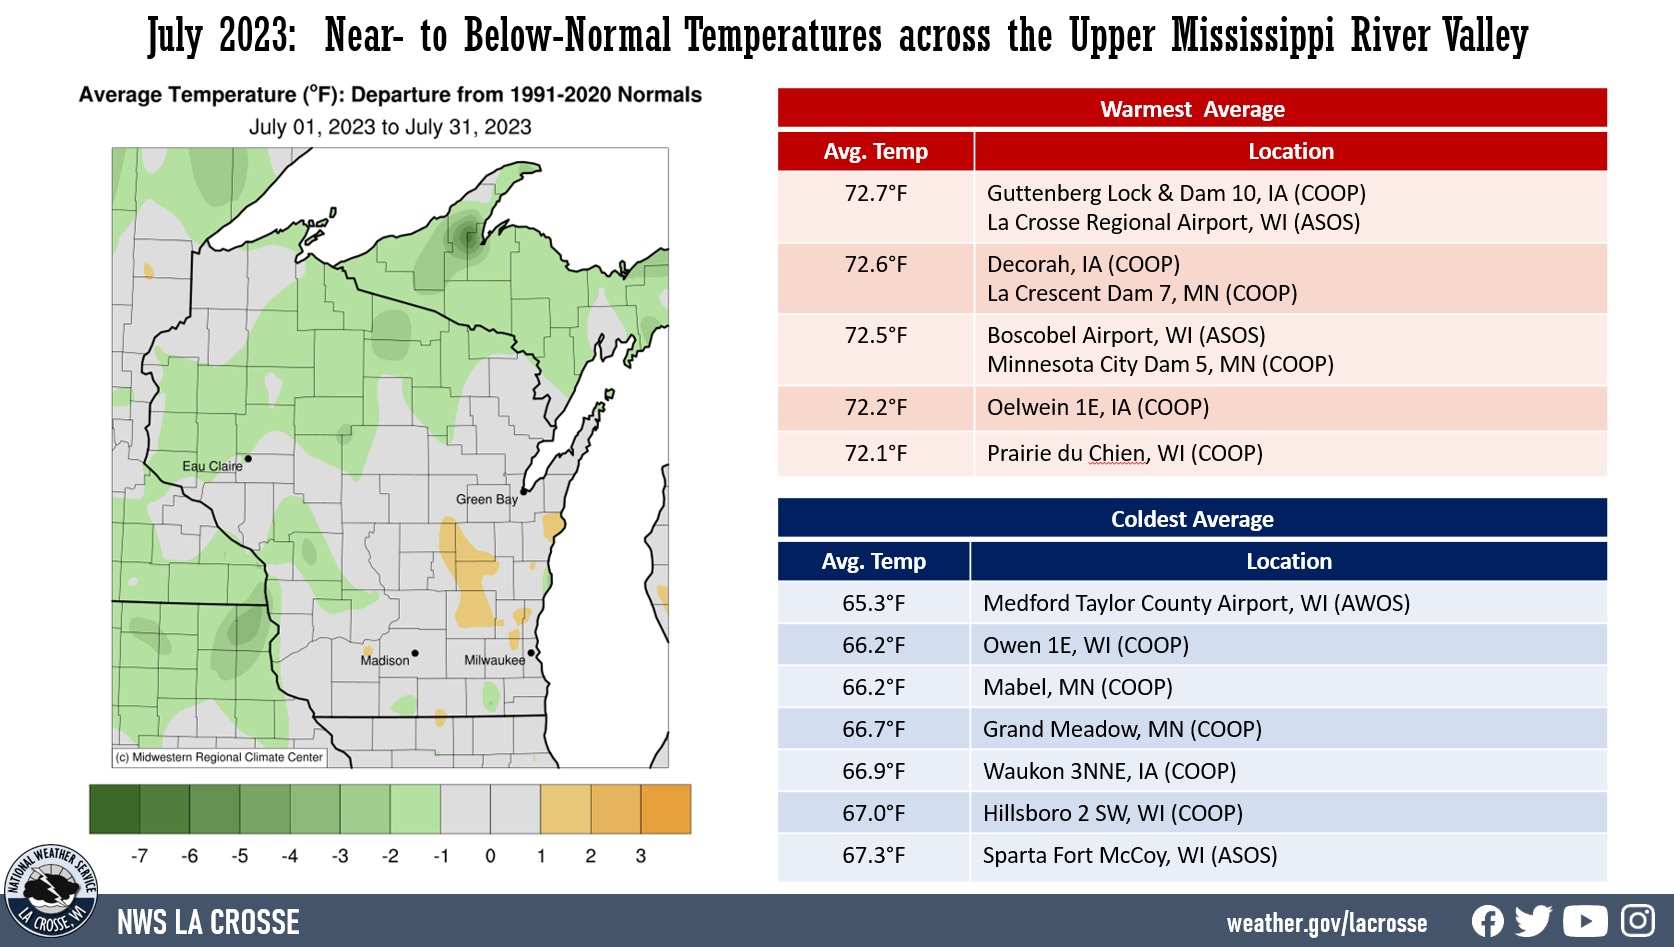
- During July 2023, average temperatures ranged from 65.3°F at Medford Taylor County Airport, WI (AWOS) to 72.7°F at Guttenberg Lock & Dam 10, IA, (COOP) and La Crosse Regional Airport (ASOS) in the Upper Mississippi River Valley.
- Temperature anomalies ranged from near normal to 3°F colder than normal.
- The warmest temperature was 94°F at Black River Falls, WI (RAWS); Boscobel, WI (ASOS); La Crosse Regional Airport, WI (ASOS); Prairie du Chien, WI (COOP); Sparta Fort McCoy, WI (ASOS); Sparta, WI (COOP); and Winona Dam 5A, MN (COOP) on July 27. Meanwhile, the coldest temperature was 39°F at Sparta Fort McCoy, WI (ASOS) on July 7 and Waukon 3 NNE, IA on July 26.
|
 |
|
July 2023 Rainfall in the Upper Mississippi River Valley
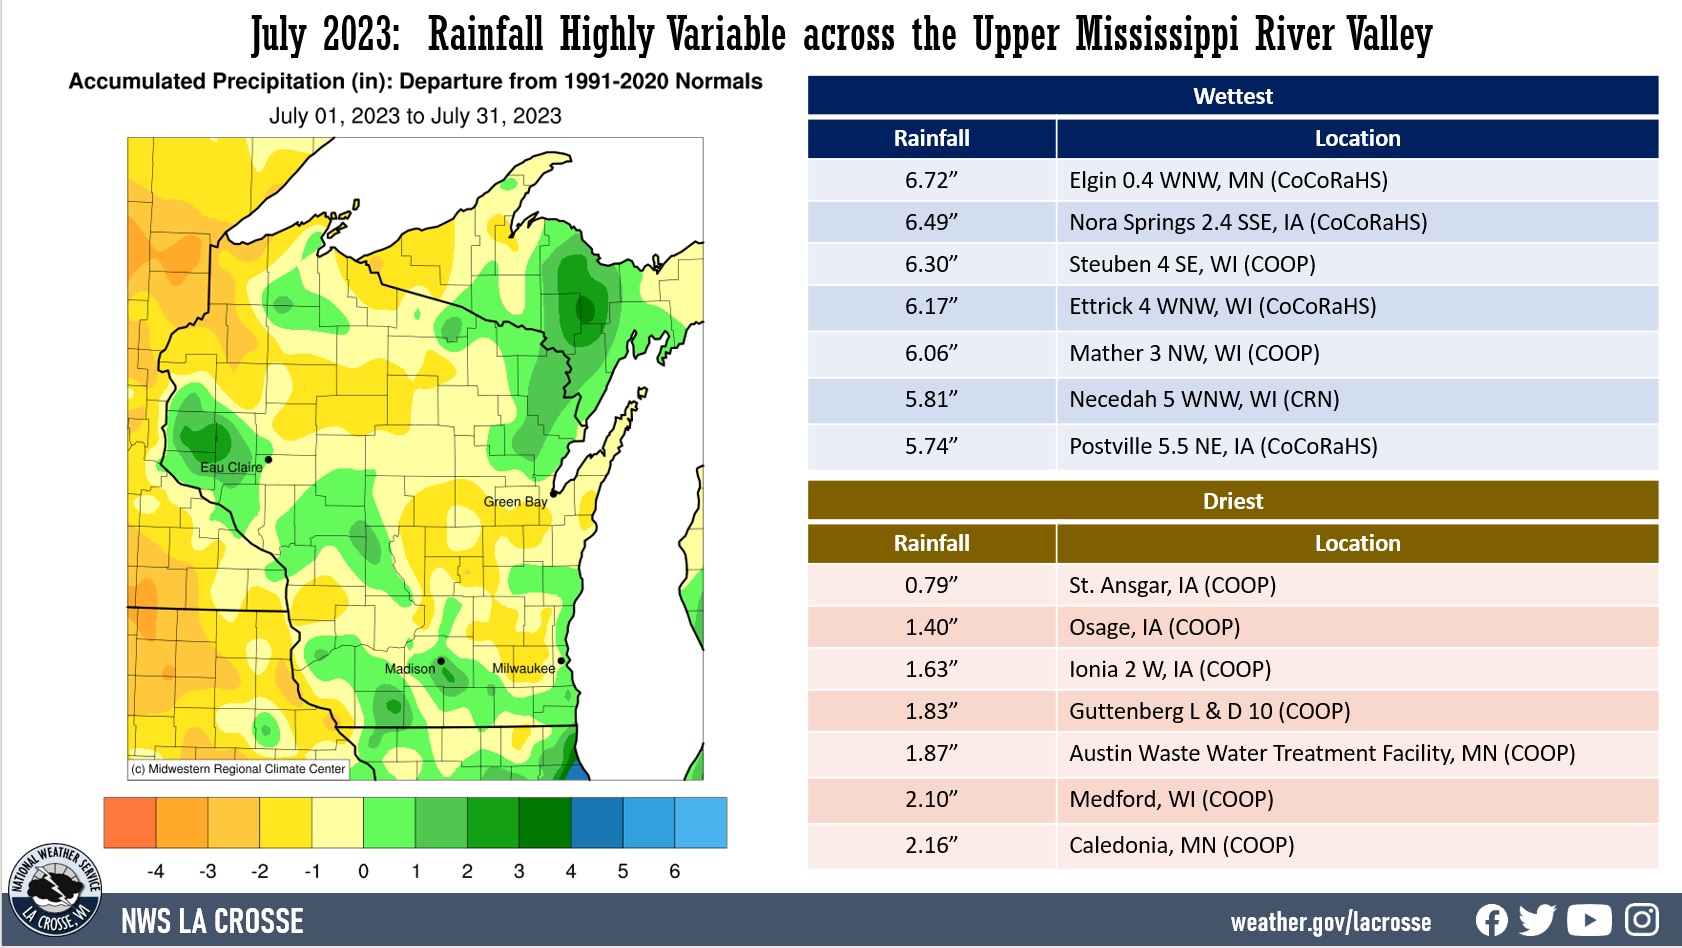
- Rainfall was highly variable during July 2023 ranging from 0.79" at St. Ansgar, IA (COOP) to 6.72" at Elgin 0.4 WNW, MN (CoCoRaHS).
- Rainfall anomalies ranged from 4" drier than normal to 2" wetter than normal.
- The highest one-day precipitation was 3.68" at Postville 5.5 NE, IA (CoCoRaHS) from July 12-13.
- After a relatively quiet first half of a year with just 20 convective warnings (18 severe thunderstorm warnings and 2 flash flood warnings), there were 38 severe thunderstorm warnings in July. The long-term average (1986-2023) for July is 29 severe weather warnings (22 severe thunderstorm warnings, 3 tornado warnings, and 4 flash flood warnings).
|
 |
Below are the July climate summaries for La Crosse, WI, and Rochester, MN.
La Crosse, WI
July 2023 was Colder and Slightly Wetter than Normal in La Crosse, WI
...July 2023 Highlights...
Temperatures...Colder-than-Normal
- The average temperature at La Crosse Regional Airport was 72.7°F. This was 2.3°F colder than the 1991-2020 normal of 75°F. This was only the second month of 2023 to run colder than normal. The other month was March (2.1°F colder than normal). This was the coldest July since 2015 (72.7°F).
- Colder-than-normal July temperatures are fairly typical during developing El Niños. 12 out of 15 El Niños (80%) saw colder-than-normal temperatures in July. The average July temperature during these El Niños was the same as this July.
- Another factor that helped keep our temperatures colder than normal was the drought. This resulted in drier-than-normal dew points which in turn resulted in colder nights.
|
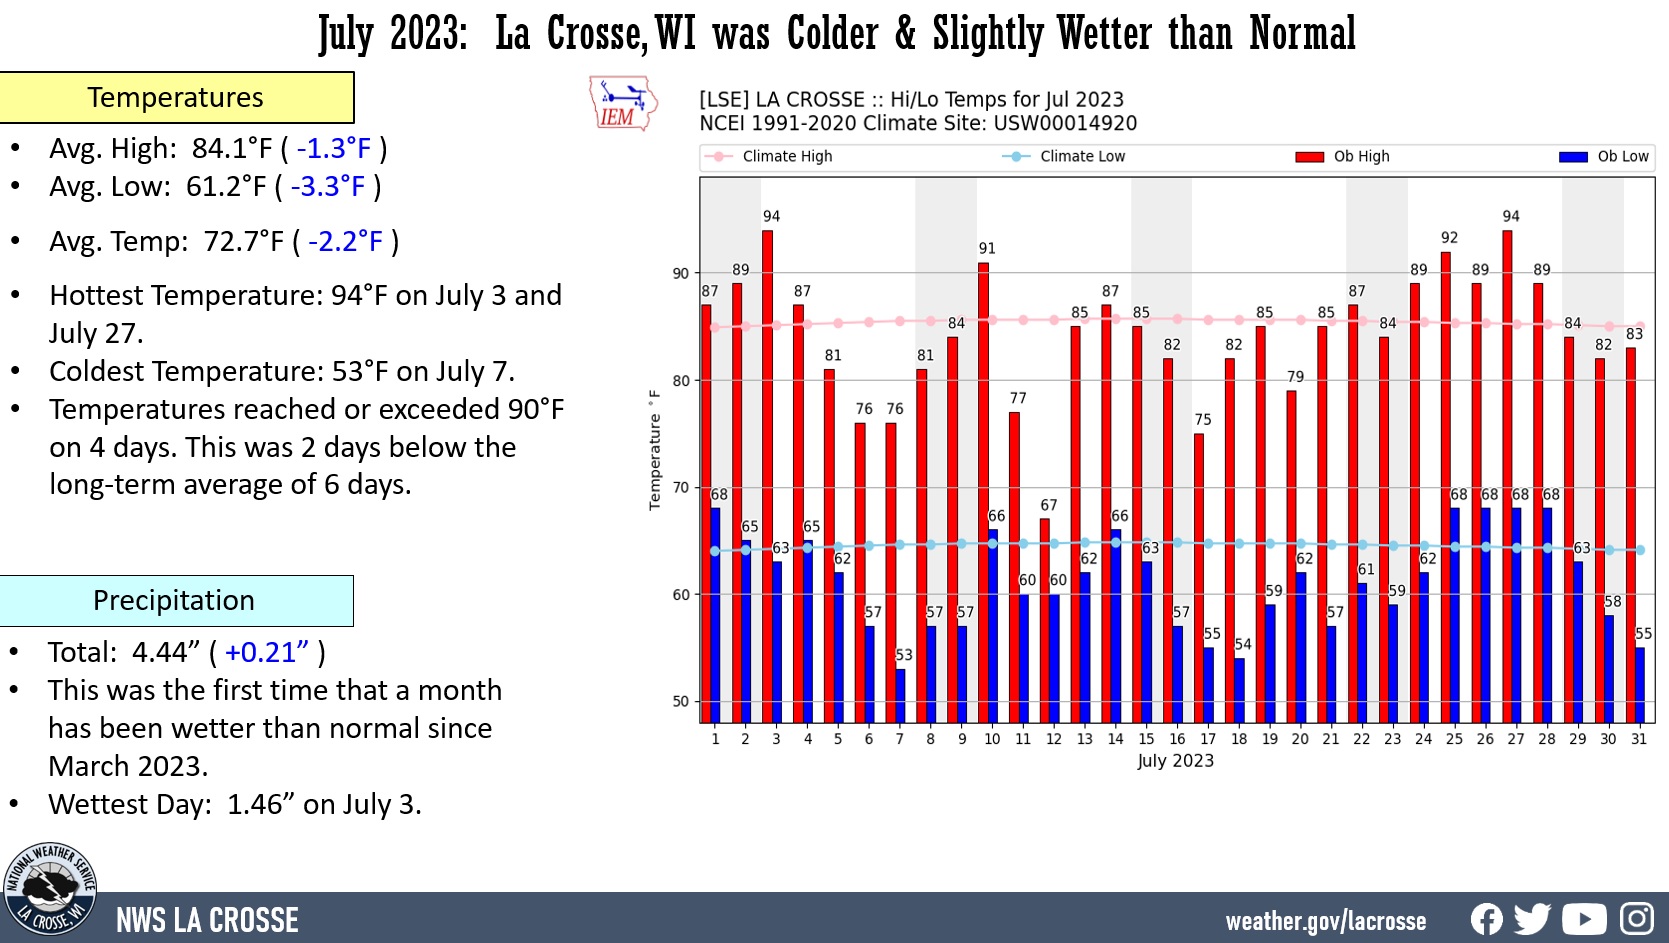 |
- The average high temperature was 84.1°F. This was 1.3°F cooler than the 1991-2020 normal of 85.4°F. Coolest since 2015 (82.9°F).
- The average low temperature was 61.2°F. This was 3.3°F colder than the 1991-2020 normal of 64.5°F. Coldest since 2014 (60.9°F).
- The warmest high temperature was 94°F on July 3 and July 27.
- The coldest high temperature was 67°F on July 12. This was the second coldest high temperature for this date. Only 1975 was colder with a high temperature of 65°F. There has not been a record cold high or cold low since February 15, 2021. While there has not been a cold record during this time period, there have been 31 warm records (17 record highs and 14 warm lows).
- The warmest low temperature was 68°F on July 1, and from July 25 through July 28. There has not been a low temperature warmer than 68°F during 2023. There has never been a year that has not had a least one 70°F or warmer low temperature. There have only been 7 years that have gone this late in the year without one. The last time was in 2008 (August 22). The latest date was September 5 in 1897.
- The coldest low temperature was 53°F on July 7.
- Temperatures reached or exceeded 90°F on 4 days. This was 2 days below the long-term average of 6 days.
Rainfall...Slightly Wetter than Normal
- A total of 4.44" of rain fell at La Crosse Regional Airport. This was 0.21" wetter than the 1991-2020 normal of 4.23". This was the first time that a month has been wetter than normal since March 2023. 4 out of the 7 months this year have been wetter than normal.
- During July, La Crosse County was in moderate (D2) to severe (D3) drought. The worst drought was in the southeast corner of the county.
- The wettest day was July 3 when 1.46" of rain fell.
- Measurable rain fell on 14 days (45.2%) and a trace of rain fell on another 3 days (9.7%).
Severe weather that affected La Crosse County
- On the evening of July 3, strong winds up to 50 mph blew down some trees on the edge of Lake Neshonoc in West Salem. These winds were associated with a gust front that raced south ahead of a line of storms. The strong winds (40-50 mph) lasted up to 20 minutes behind this gust front. It was very dry prior to these storms, so dirt was picked up by these winds. Finally, spray and 2 to 3 feet waves were generated on the south shore of this lake.
- On July 10, a severe thunderstorm blew a large tree limb down along U.S. Highway 53.
- During the early evening of July 28, severe thunderstorms moved southeast from the Twin Cities. They produced very large hail (2-4" diameter) from Holmen to Bangor in La Crosse County. The largest was in the West Salem area. In addition to the hail, wind gusts up to 65 mph caused extensive damage to trees and powerlines. A Kwik Trip sign was blown down between Holmen and Onalaska. Some were without power in West Salem for nearly 24 hours.
...Records...
...Looking ahead to August...
- The normal high temperature in La Crosse starts off at 85°F on August 1st and falls to 81°F by the end of the month. The normal low temperature starts off at 64°F on the 1st and falls to 60°F by the end of the month. The normal mean temperature for the month is 72.8°F. La Crosse’s hottest August occurred in 1947 with an average temperature of 78.3°F, and their coldest August occurred in both 1927 and 1915 with an average temperature of 64.8°F.
- For August, the hottest temperature ever recorded was 105°F on August 1, 1988, and the coldest temperature was 35°F on August 30, 1915. There are typically 4 days with temperatures at or above 90°F.
- The average precipitation for August is 3.90". The wettest August occurred in 2007 when 13.75" of rain fell and the driest occurred in 1894 when 0.35" of rain fell. The wettest August day was 4.05" on August 18, 2007. Normally, there are 6 days with thunderstorms.
- Valley fog is quite prevalent in the area. On average, this fog reduces the visibility to a quarter-mile or less at the airport on 3 days.
Rochester, MN
July 2023 was Cooler and Drier than Normal in Rochester, MN
...July 2023 Highlights...
Temperatures...Cooler than Normal
- The average temperature at Rochester International Airport was 69.4°F. This was 1.1°F cooler than the 1991-2020 normal of 70.5°F. This was the coldest July since 2014 (67.6°F).
- Colder-than-normal July temperatures are not that unusual during developing El Niños. 9 out of 15 El Niños (60%) saw colder-than-normal temperatures in July. The average July temperature during these El Niños is 69.9°F.
- Another factor that helped keep our temperatures colder than normal was the drought. This resulted in drier-than-normal dew points which in turn resulted in colder nights.
|
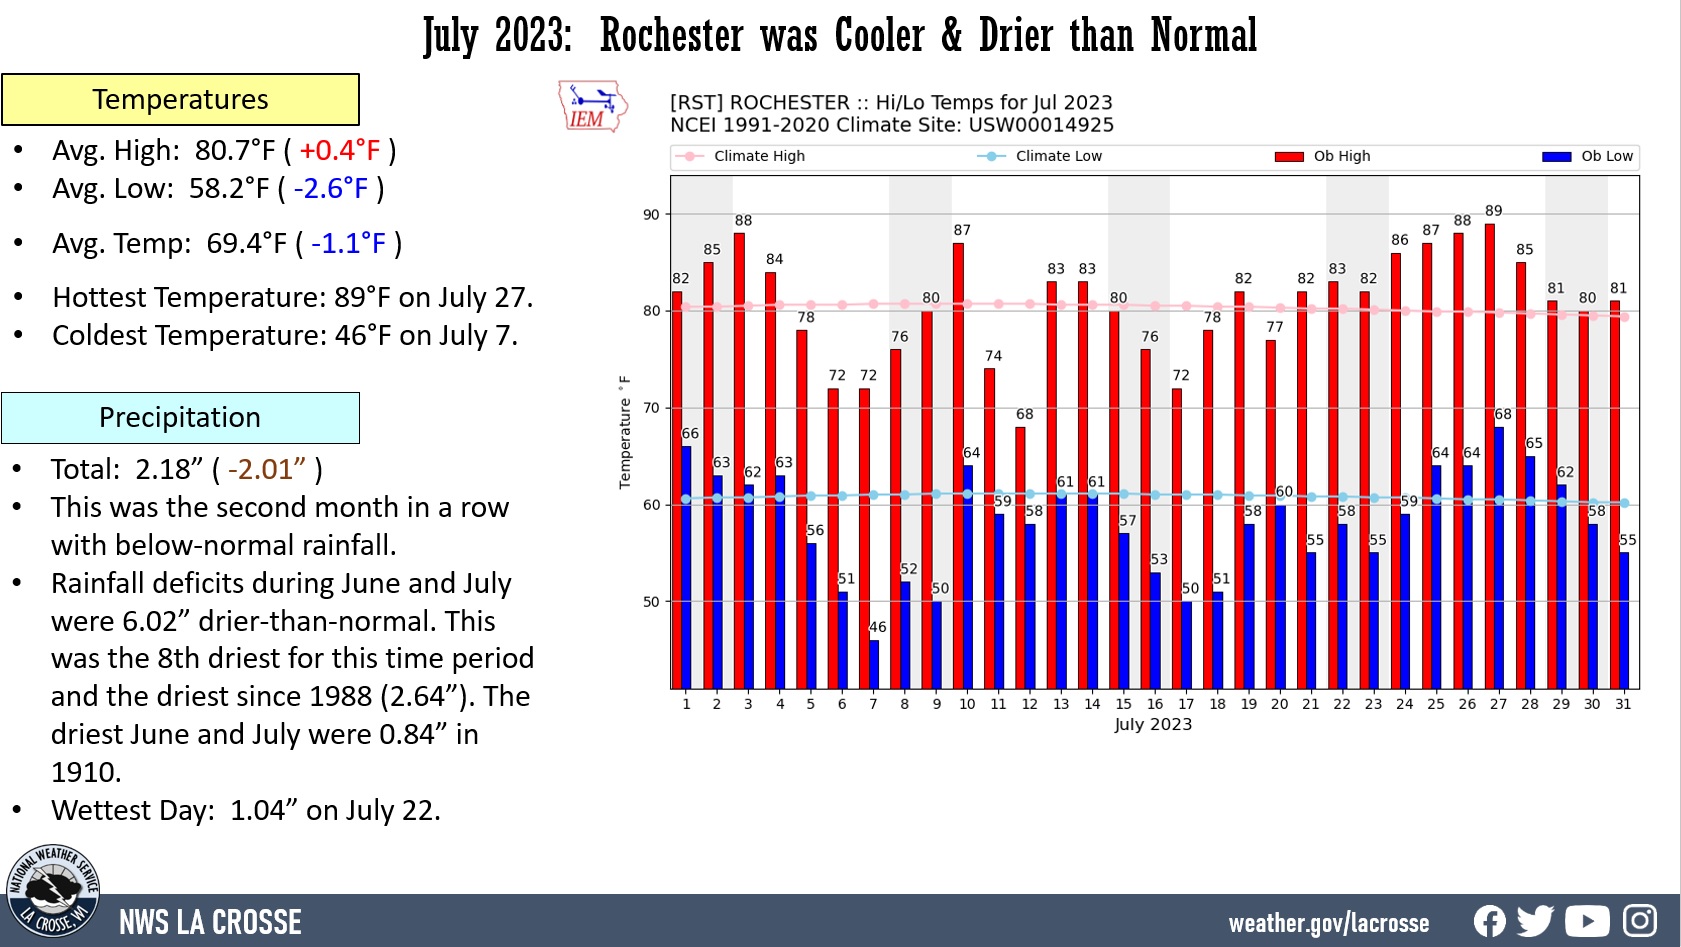 |
- The average high temperature was 80.7°F. This was 0.4°F warmer than the 1991-2020 normal of 80.3°F.
- The average low temperature was 58.2°F. This was 2.6°F cooler than 1991-2020 normal of 60.8°F. This was the coldest since 2014.
- The warmest high temperature was 89°F on July 27.
- The coldest high temperature was 68°F on July 12. This was the second coldest high temperature for this date. Only 1913 was colder with a high temperature of 66°F.
- The warmest low temperature was 68°F on July 27.
- The coldest low temperature was 46°F on July 7.
Rainfall...Drier than Normal
- A total of 2.18" of rain fell at Rochester International Airport. This was 2.01" drier than the 1991-2020 normal of 4.19". This was the second month in a row with below-normal rainfall. Rainfall deficits during June and July were 6.02 inches drier-than-normal. This was the 8th driest for this time period and the driest since 1988 (2.64"). The driest June and July were 0.84" in 1910.
- During July, the drought in Olmsted County intensified from severe (D2) to extreme (D3). With the U.S. Drought Monitor designation of extreme (D3) drought in Rochester and Olmsted County on July 18, this was the first time it was D3 since January 27, 2004.
- The wettest day was July 22 when 1.04" of rain fell.
- Measurable rain fell on 5 days (16.1%) and a trace of rain fell on another 9 days (29%).
Severe weather that affected Olmsted County...
- On July 22, there were 3 severe thunderstorm warnings issued for Olmsted County. These storms produced quarter-to-ping-pong ball hail. Quarter-size hail (1 inch in diameter) was reported near Chester, Oronoco, and Byron. Meanwhile, ping pong ball size hail (1.5 inches in diameter) was reported in the Oronoco area. These were the first severe thunderstorm warnings for 2023. Looking back at the data through 1986, this was the second latest date for their first Severe Thunderstorm Warning in a year. The latest date was August 26 in 1996.
- On July 26, 60 mph winds were reported at Rochester International Airport.
...Records...
...Looking ahead to August...
- The normal high temperature in Rochester falls from 79°F on August 1st to 76°F by the end of the month. The normal low temperature falls from 60°F on the 1st to 56°F by the end of the month. The normal mean temperature for the month is 68.2°F. Rochester’s hottest August occurred in 1947 with an average temperature of 77°F, and their coldest August occurred in 1992 with an average of 63.1°F.
- For August, the hottest temperature ever recorded was 100°F on August 3, 1930, August 15, 1936, August 4, 1947, August 23, 1948, and August 24, 1948, and the coldest temperature was 32°F on August 30, 1915. Normally, there is only 1 day with temperatures at or above 90°F.
- The average precipitation for August is 4.12". The wettest August occurred in 2007 when 14.07" of rain fell and the driest occurred in 1941 when 0.31" of rain fell. The wettest August day was 5.16" on August 18, 2007. Normally, there are 6 days with thunderstorms.

