Upper Mississippi River Climate Summary for Febuary 2025:
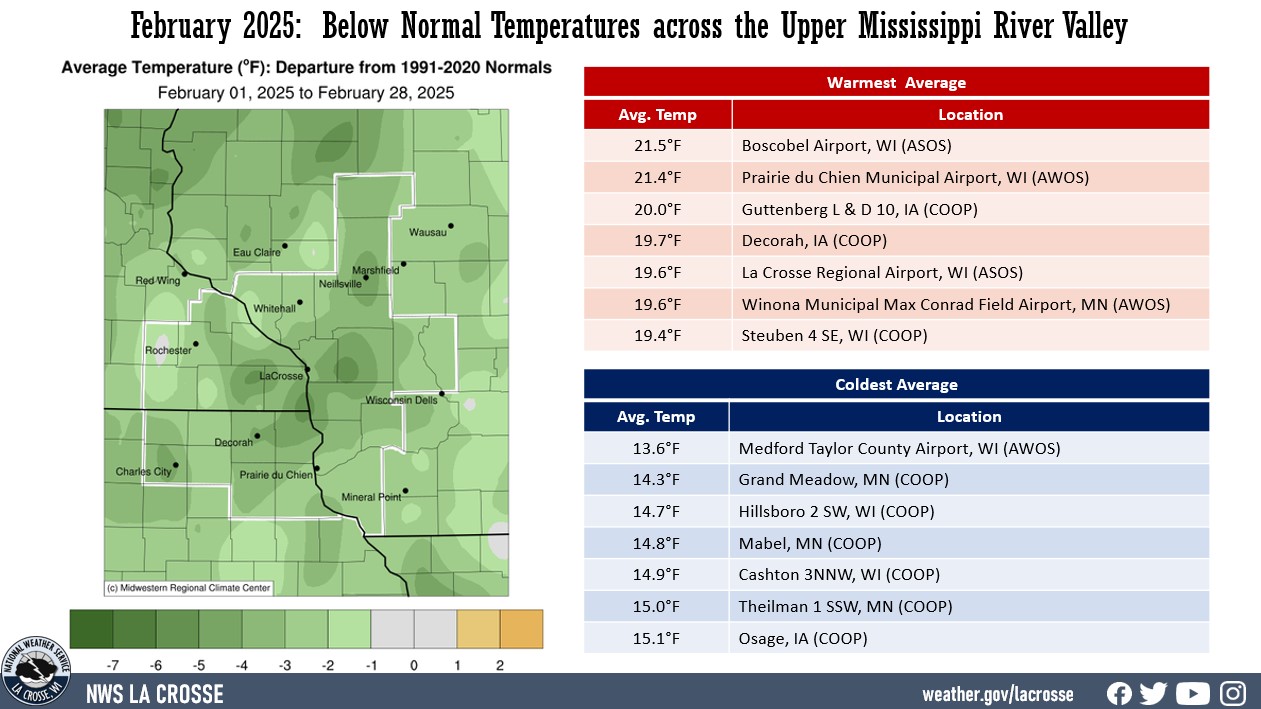
Temperatures - Colder than Normal
- During February 2025, average temperatures ranged from 12.7°F near Neillsville, WI (COOP) to 21.5°F at Boscobel Airport, WI (ASOS).
- Temperature anomalies ranged from 2°F to 6°F colder-than-normal.
- There was a 84°F difference between the warmest and coldest temperatures in the Upper Mississippi River Valley.
- The warmest temperature was 56°F at La Crosse Regional Airport (ASOS) and Sparta Fort McCoy Airport (ASOS) on February 24. Meanwhile, the coldest temperature was -28°F at Black River Falls (RAWS) on February 18.
|
 |
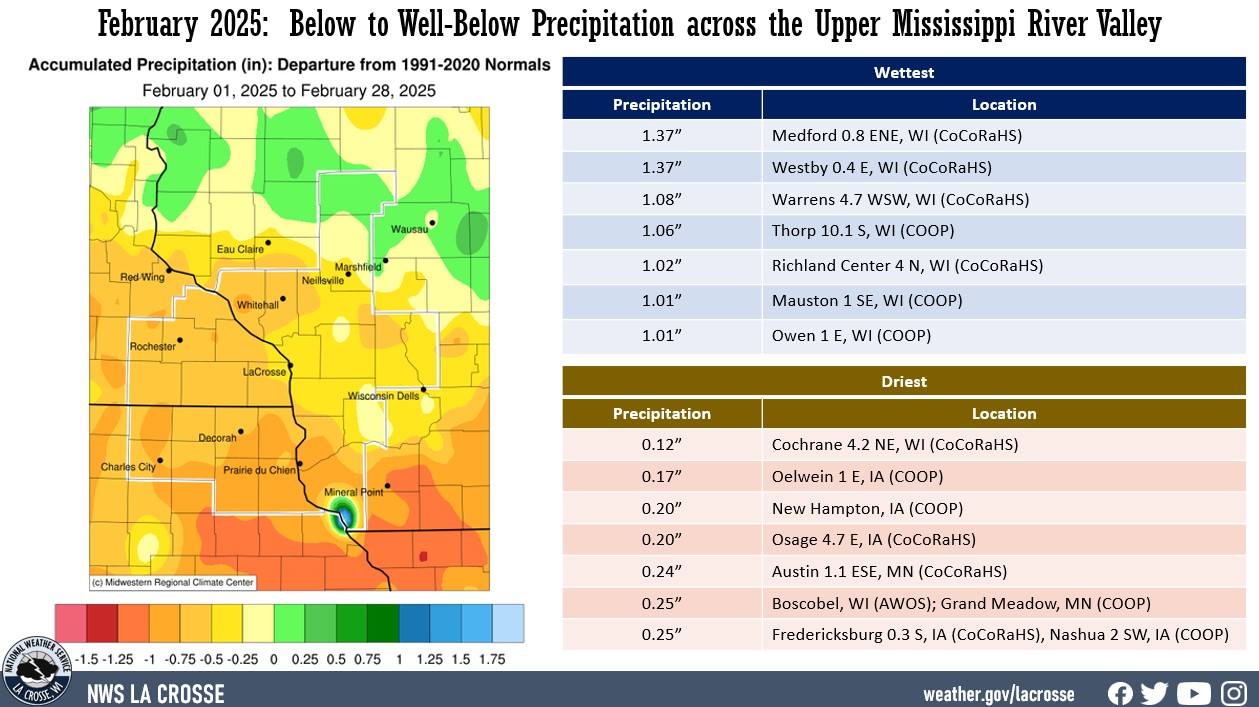
Precipitation - Below to Well-Below Normal
- Precipitation totals varied from 0.12" near Cochrane, WI (CoCoRaHS) to 1.37" near Medford and Westby.
- Precipitation anomalies ranged from 1.25" drier than normal to 0.25" wetter than normal.
- The highest one-day precipitation was 0.51" near Westby (CoCoRaHS) from February 25 to February 26.
|
 |
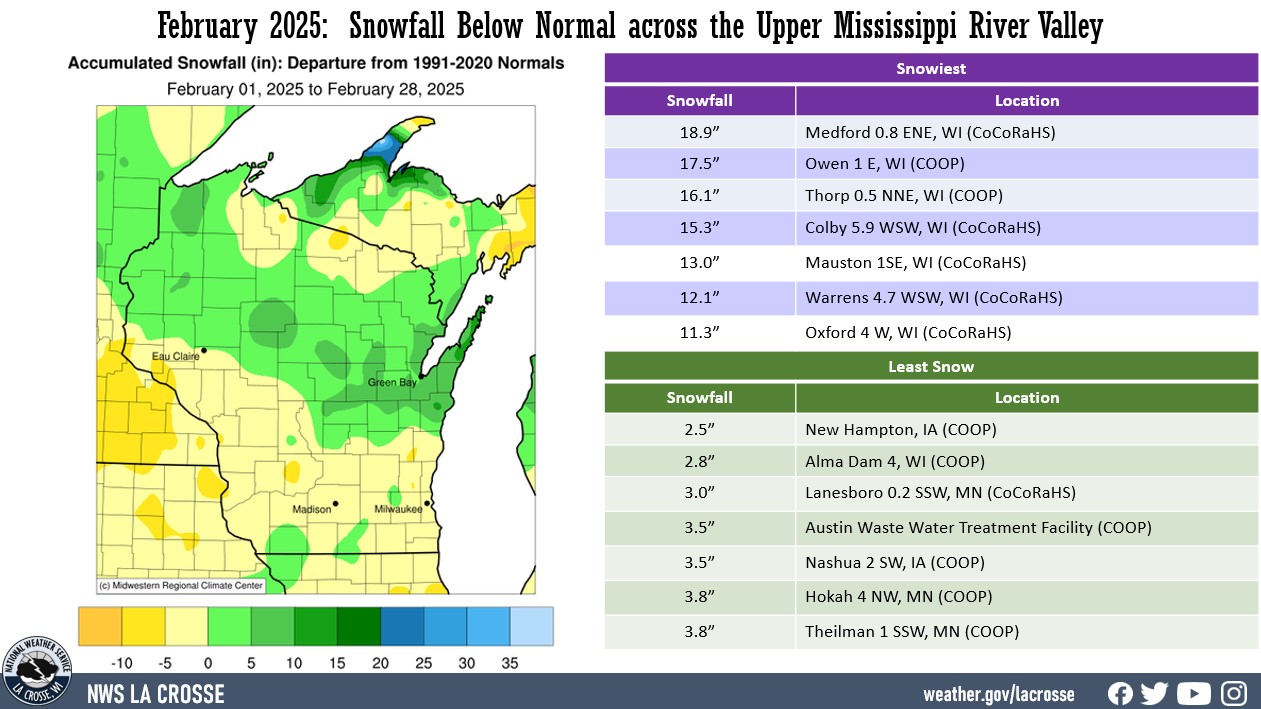
| Snowfall - Less than Normal |
- Snowfall totals varied from 2.5" at New Hampton, IA (COOP) to 18.9" near Medford, WI (CoCoRaHS).
- Snowfall anomalies ranged from 15" below normal to 10" above normal.
- The highest one-day snowfall was 9" near Owen, WI (COOP) from February 8 to February 9.
|
 |
Below are the Febuary 2025 climate summaries for La Crosse, WI, and Rochester, MN.
La Crosse, WI
February 2025 was Colder and Drier than Normal in La Crosse WI
...February 2025 Highlights...
Temperatures - Colder than Normal
- During February 2025, the average temperature at La Crosse Regional Airport was 19.6°F. This was 3.7°F colder than the 1991-2020 normal of 23.3°F. This was the largest cold anomaly in a month since April 2022 (4.5°F degrees below normal).
- 6 out of last 10 Februarys were colder than normal.
- The average high temperature was 28.8°F. This was 3.7°F colder than the 1991-2020 normal of 32.5°F. This was the coldest since 2021 (22.3°F). 5 out of last 10 Februarys were colder than normal.
- The average low temperature was 10.5°F. This was 3.7°F colder than the 1991-2020 normal of 14.2°F. This was the coldest since 2022 (7.5°F). 6 out of last 10 Februarys were colder than normal.
- The warmest high temperature was 56°F on February 24 and the coldest temperature was -18°F on February 18.
|
 |
The temperature fell below 0°F on 7 days. The long-term average (1873-2025) is 6 days. This was the most since 2021 (13 days). The most was 20 days in 1936.
Precipitation - Drier than Normal
- A total of 0.69" of precipitation fell.
- This was 0.50" below the 1991-2020 normal of 1.19".
- The wettest day was on February 14 with 0.20" of precipitation.
- Precipitation fell on 16 days (57.1%). Measurable precipitation fell on 10 days (35.7%) and trace amounts fell on another 6 days (21.4%).
Snowfall - Below Normal
- A total of 7" of snow was measured by our official snow observer near La Crosse Regional Airport.
- This was 2.7" below the 1991-2020 normal of 9.7".
- The snowiest day was on February 12 and February 14 when 2.2" of snow fell.
- Snow fell on 12 days (42.9%). Measurable snow fell on 7 days (25%) and trace amounts fell on another 5 days (17.9%).
Snow Depth - Below Average
- The average snow depth was 2.3".
- This was 2.8" below the long-term (1912-2025) average of 5.1".
- The greatest snow depth was 5" from February 15 through February 21.
- Measurable snow was on the ground 17 days (60.7%), no snow on ground 10 days (35.7%), and a trace of snow on the ground 1 day (3.6%).
...Records...
...Looking ahead to March...
The normal high temperature in La Crosse warms from 38°F on March 1st to 53°F by the end of the month. The normal low temperature warms from 20°F on the 1st and to 32°F by the end of the month. The warmest March temperature on record is 84°F on March 29, 1986; and the coldest is -28°F on March 1, 1962.
The normal mean temperature for March is 35.8°F. La Crosse’s warmest March occurred in 2012 with an average temperature of 50.4°F, and their coldest March occurred in 1899 with an average temperature of 21.3°F.
The normal March precipitation is 2.04". The wettest March occurred in 1876 with 4.23" of precipitation and the driest occurred in 1910 with just 0.03". The wettest March day occurred on March 27, 1880, when 2.01" of precipitation fell. Normally, there is 1 day with thunderstorms.
The normal March snowfall is 7.3" (4th snowiest month). The snowiest March occurred in 1959 with 33.5" of snow and the least snow was no snow in 2010. The snowiest March day occurred on March 13, 1997, when 14.3" of snow fell.
Rochester, MN
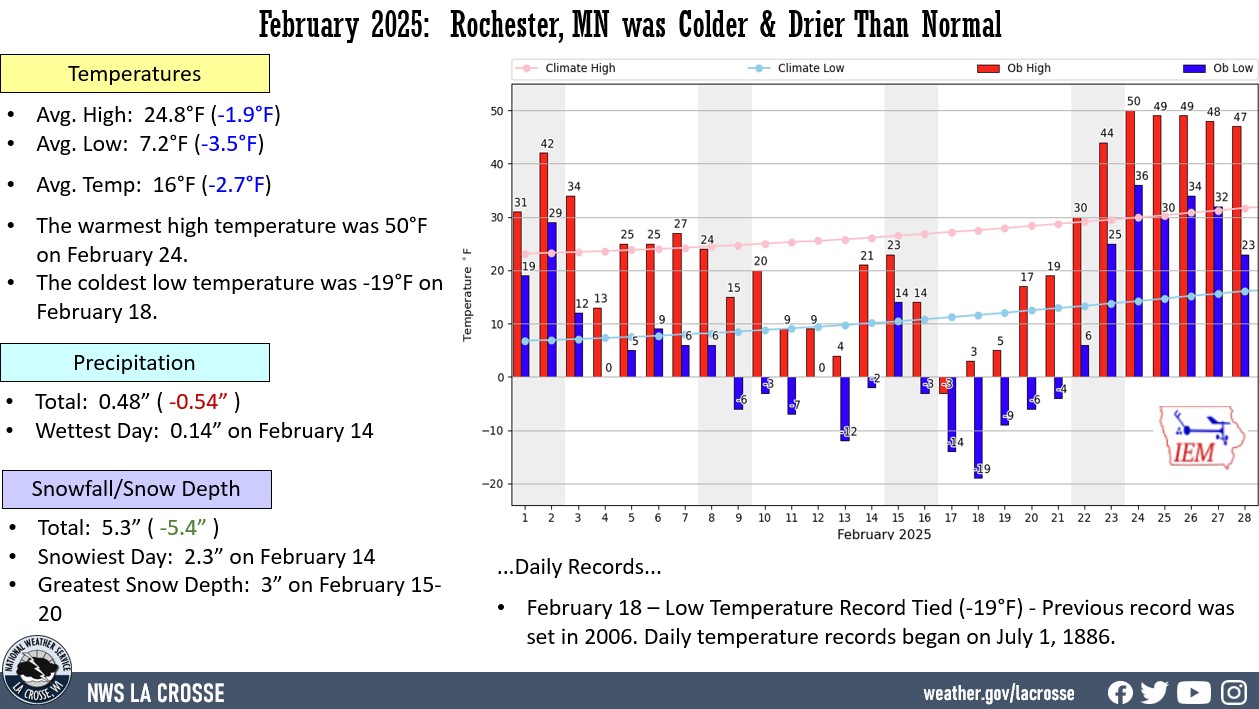
February 2025 was Colder and Drier than Normal in Rochester MN
...Febuary 2025 Highlights...
Temperatures - Colder than Normal
- During February 2025, the average temperature at Rochester International Airport was 16°F. This was 2.7°F colder than the 1991-2020 normal of 18.7°F. This was the largest cold anomaly in a month since March 2023 (also 2.7°F degrees below normal).
- This was the coldest February since 2022 (13.9°F). 6 out of last 10 Februarys were colder than normal.
- The average high temperature was 24.8°F. This was 1.9°F colder than the 1991-2020 normal of 26.7°F. This was the coldest since 2022 (24.2°F). 6 out of last 10 Februarys were colder than normal.
- The average low temperature was 7.2°F. This was 3.5°F colder than the 1991-2020 normal of 10.7°F. This was the coldest since 2022 (3.6°F). 6 out of last 10 Februarys were colder than normal.
- The warmest high temperature was 50°F on February 24 and the coldest temperature was -19°F on February 18.
|
 |
The temperature fell below 0°F on 11 days. The long-term average (1886-2025) is 8 days. This was the most since 2021 (8 days). The most was 23 days in 1936.
Precipitation - Drier than Normal
- A total of 0.48" of precipitation fell.
- This was 0.54" below the 1991-2020 normal of 1.02".
- The wettest day was on February 24 with 0.14" of precipitation.
- Precipitation fell on 14 days (50%). Measurable precipitation fell on 7 days (25%) and trace amounts fell on another 7 days (25%).
Snowfall - Below Normal
- A total of 5.3" of snow was measured by our official snow observer near Rochester International Airport.
- This was 5.4" below the 1991-2020 normal of 10.7".
- The snowiest day was on February 14 when 2.3" of snow fell.
- Snow fell on 8 days (28.6%). Measurable snow fell on 5 days (25%) and trace amounts fell on another 3 days (10.7%).
Snow Depth - Below Average
- The average snow depth was 1.2".
- This was 4.7" below the long-term average (1893-2025) of 5.9".
- The greatest snow depth was 3" from February 15 through February 20.
- Measurable snow was on the ground 15 days (53.6%), no snow on the ground 11 days (39.3%), and a trace of snow on the ground 2 days (7.1%).
...Records...
Daily...
- February 18 - Low temperature record tied (-19°F). Previous record was set in 2006.. Daily temperature records began on July 1, 1886.
...Looking ahead to March...
The normal high temperature in Rochester warms from 32°F on March 1st to 48°F by the end of the month. The normal low temperature warms from 17°F on the 1st to 30°F by the end of the month. The warmest March temperature on record is 82°F on March 24, 1910; and the coldest is -31°F on March 1, 1962.
The normal mean temperature for March is 31.7°F. Rochester’s warmest March occurred in 2012 with an average temperature of 49.1°F, and its coldest March occurred in 1888 with an average temperature of 17.4°F.
The normal March precipitation is 2.02". The wettest March occurred in 1888 with 4.02" of precipitation and the driest occurred in 1910 with just a trace of precipitation. The wettest March day occurred on March 22, 2011, when 2.20" of precipitation fell. Normally, there is 1 day with thunderstorms.
The normal March snowfall is 8.6" (4th snowiest month). The snowiest March occurred in 1951 with 35.1" of snow and the least snow was no snow in 2010. The snowiest March day occurred on March 18, 2005, when 19.8" of snow fell.

