Upper Mississippi River Climate Summary for August 2024:
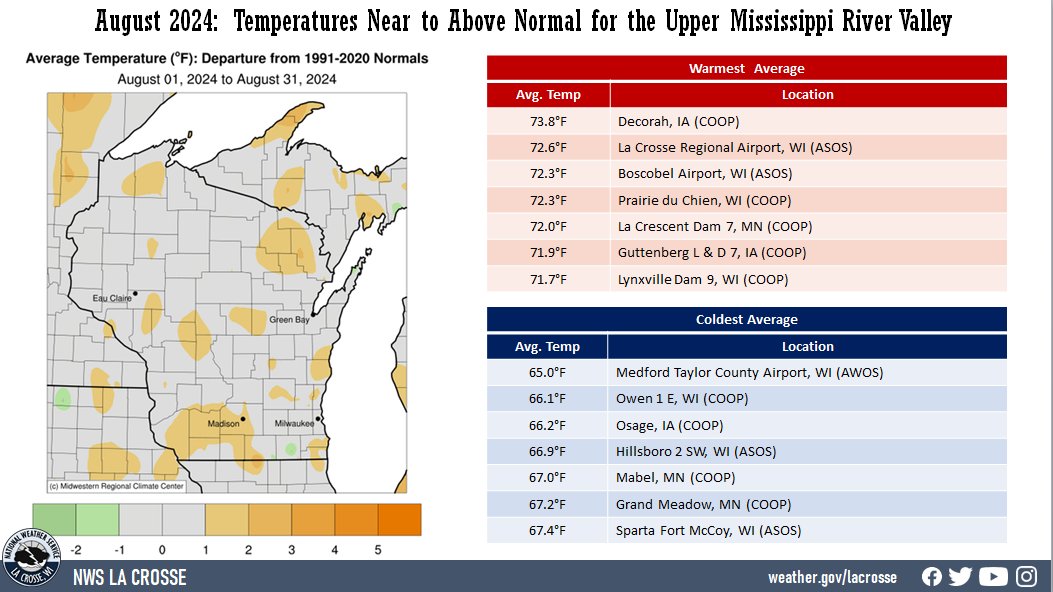
Temperatures - Near Normal
- During August 2024, average temperatures ranged from 65°F at Medford Taylor County Airport (AWOS) to 73.8°F at Decorah, IA (COOP).
- Temperature anomalies were within 2°F of normal. There was a 59°F difference between the warmest and coldest temperatures in the Upper Mississippi River Valley.
- The warmest temperature was 98°F at Decorah, IA (COOP) on August 27. Meanwhile, the coldest temperature was 39°F at Sparta Fort McCoy, WI (ASOS) on August 22.
|
 |
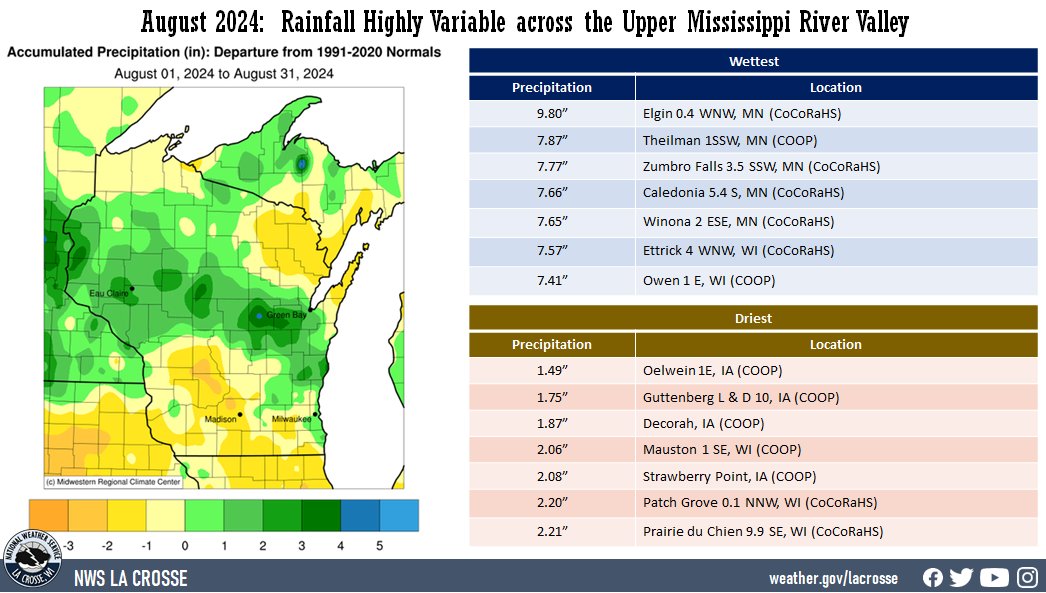
Precipitation - Highly Variable
- Rainfall totals varied from 1.49" near Oelwein, IA (COOP) to 9.80" near Elgin, MN (CoCoRaHS).
- Rainfall anomalies ranged from 3" drier than normal to 3" wetter than normal.
- The highest one-day precipitation was 4.14" near Trempealeau, WI (CoCoRaHS) on August 30. There were unofficial rainfall totals of 6 to 6.5" from southern Winona County (MN) to eastern Jackson County (WI) from August 29-30.
|
 |
Below are the August 2024 climate summaries for La Crosse, WI, and Rochester, MN.
La Crosse, WI
August 2024 was Slightly Cooler and Drier than Normal in La Crosse, WI
...August 2024 Highlights...
Temperatures - Slightly Cooler than Normal
- The average temperature at La Crosse Regional Airport was 72.6°F. This was 0.2°F cooler than the 1981-2020 normal of 72.8°F.
- The average high temperature was 82.7°F. This was 0.5°F cooler than the 1981-2020 normal of 83.2°F.
- The average low temperature was 62.5°F. This was 0.2°F warmer than the 1981-2020 normal of 62.3°F.
- The hottest temperature was 97°F on August 26 and the coolest temperature was 53°F on August 21 and 22.
- The temperature climbed to or exceeded 90°F on 4 days. The normal is 4.2 days.
|
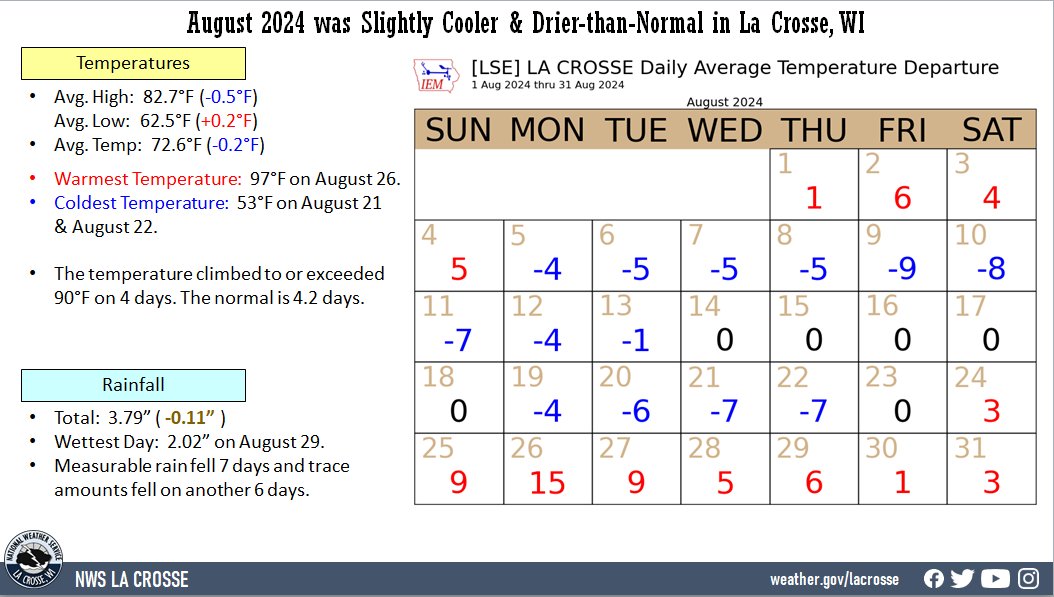 |
Rainfall - Slightly Drier than Normal
- A total of 3.79" of rain fell. This was 0.11" drier than the 1981-2020 normal of 3.90".
- Measurable rain fell on 7 days (22.6%) and trace amounts fell on another 7 days (22.6%).
- The wettest day occurred on August 29 when 2.02" of rain fell. This not only set a daily rainfall record (the previous record of 2.02" in 1876), but it was also the wettest August day since August 27, 2021, when 2.52" of rain fell. It was the wettest calendar day since June 13, 2022 (2.09").
...Daily Records...
- August 26 - Tied Record High - 97°F - Previously Set in 2020
- August 26 - Tied Record Warm Low - 76°F - Previously Set in 1948 and 2013
- August 29 - Rainfall - 2.02" - Previous Record - 1.24" in 1876
...Looking Ahead to September...
- The normal high temperature in La Crosse starts at 81°F on September 1st and falls to 69°F by the end of the month. The normal low temperature starts off at 59°F on the 1st and falls to 48°F by the end of the month. The warmest September temperature on record was 101°F on September 6, 1922, and the coldest was 24°F on September 30, 1899.
- The normal mean temperature for September is 64.8°F. La Crosse’s hottest September occurred in 2015 with an average temperature of 69.3°F, and its coldest September occurred in 1918 with an average temperature of 54.8°F.
- The normal September rainfall is 3.63". The wettest September occurred in 1881 with 10.87" of rain, while the driest September occurred in 1940, with only 0.29" of precipitation. The wettest September day occurred on September 6, 1884, when 5.55" of rain fell. Normally, there are 4 days with thunderstorms.
- While typically no snow falls during September, measurable snow did fall in 1942 (0.2" on September 26).
- Valley fog is quite prevalent in the area. On average, this fog reduces the visibility to a quarter-mile or less at the airport on 3 days.
Rochester, MN
August 2024 was Slightly Wetter and Warmer than Normal at Rochester, MN
...August 2024 Highlights...
Temperatures - Near Normal
- The average temperature at Rochester International Airport was 68.5°F. This was 0.3°F warmer than the 1981-2020 normal of 68.2°F.
- This was the 13th consecutive month which was warmer than normal.
- The average high temperature was 78.4°F. This was 0.4°F warmer than the 1981-2020 normal of 78°F.
- The average low temperature was 58.6°F. This was 0.3°F warmer than the 1981-2020 normal of 58.3°F.
- The hottest temperature was 91°F on August 26 and the coolest temperature was 49°F on August 10.
|
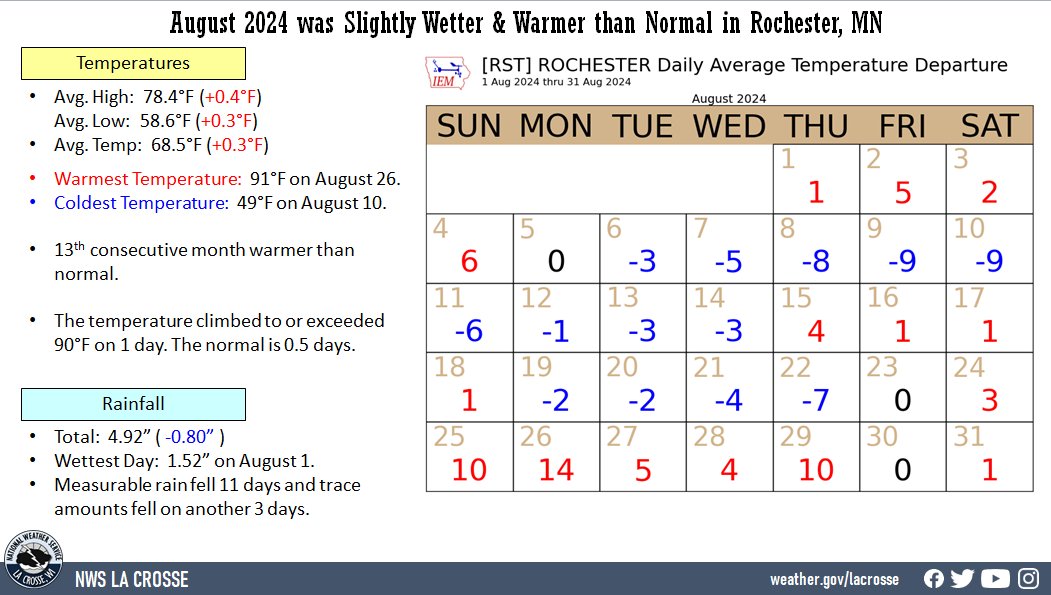 |
Rainfall - Slightly Wetter than Normal
- A total of 4.92" of rain fell. This was 0.80" wetter than the 1981-2020 normal of 4.12".
- Measurable rain fell on 11 days (35.5%) and trace amounts fell on another 3 days (9.7%).
- The wettest day occurred on August 1 when 1.52" of rain fell.
...Daily Records...
- August 5 - Rainfall - 1.22" - Previous Record - 0.67" in 2000
...Looking Ahead to September...
- The normal high temperature in Rochester starts at 76°F on September 1st and falls to 66°F by the end of the month. The normal low temperature starts at 56°F on the 1st and falls to 45°F by the end of the month. The warmest September temperature on record is 100°F on September 6, 1913, and the coldest was 22°F on September 28, 1942.
- The normal mean temperature for September is 61.1°F. Rochester’s hottest September occurred in 1908 with an average temperature of 69.5°F, and its coldest September occurred in 1993 with an average temperature of 53.6°F.
- The normal September rainfall is 3.60 inches. The wettest September was in 1986 with 10.50" of rain, while the driest September occurred in 1953, with only 0.33" of precipitation. The wettest September day occurred on September 12, 1978, when 5.98" of rain fell. Normally, there are 5 days with thunderstorms.
- While typically no snow falls during September, measurable snow did fall in 1942 (0.3" on September 26) and 1961 (0.8" on September 30).

