August 2023 Climate Summary for the Upper Mississippi River Valley
Temperatures:
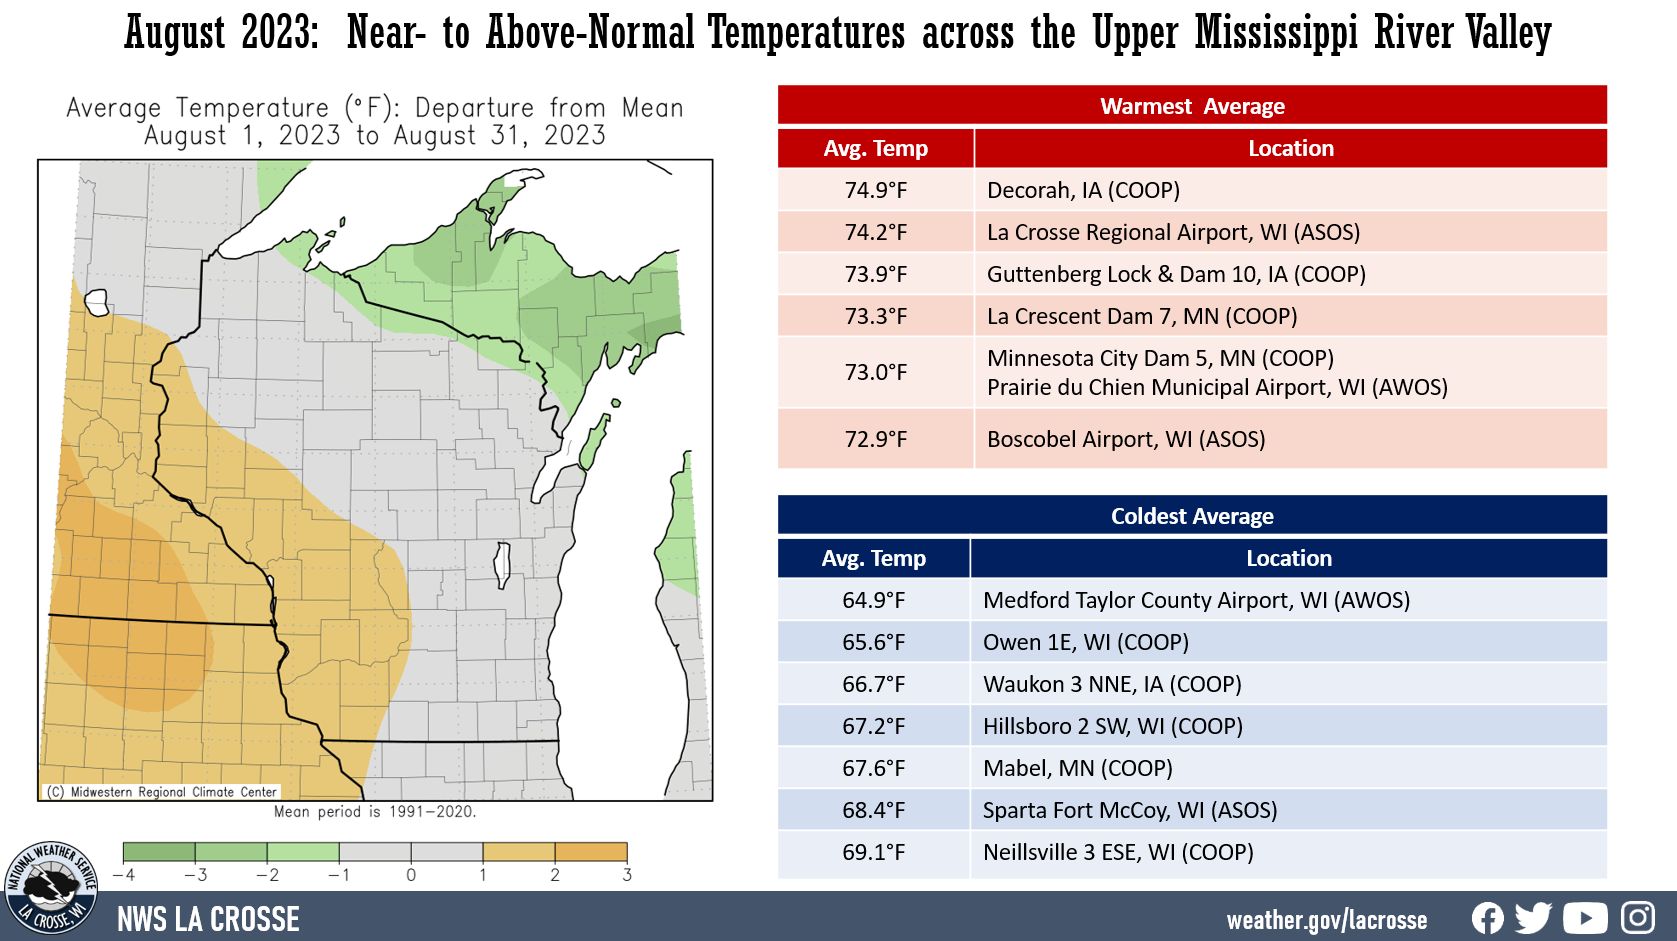
| During August 2023, average temperatures ranged from 64.9°F at Medford Taylor County Airport, WI (AWOS) to 74.9°F at Decorah, IA in the Upper Mississippi River Valley. Temperature anomalies ranged from near normal to 3°F warmer than normal. The hottest temperature was 105°F at Boscobel Airport, WI (COOP) and Decorah, IA (COOP) on August 23. Meanwhile, the coldest temperature was 36°F at Hillsboro 2 SW, WI, and Sparta Fort McCoy, WI (ASOS) on August 31. |
 |
Rainfall:
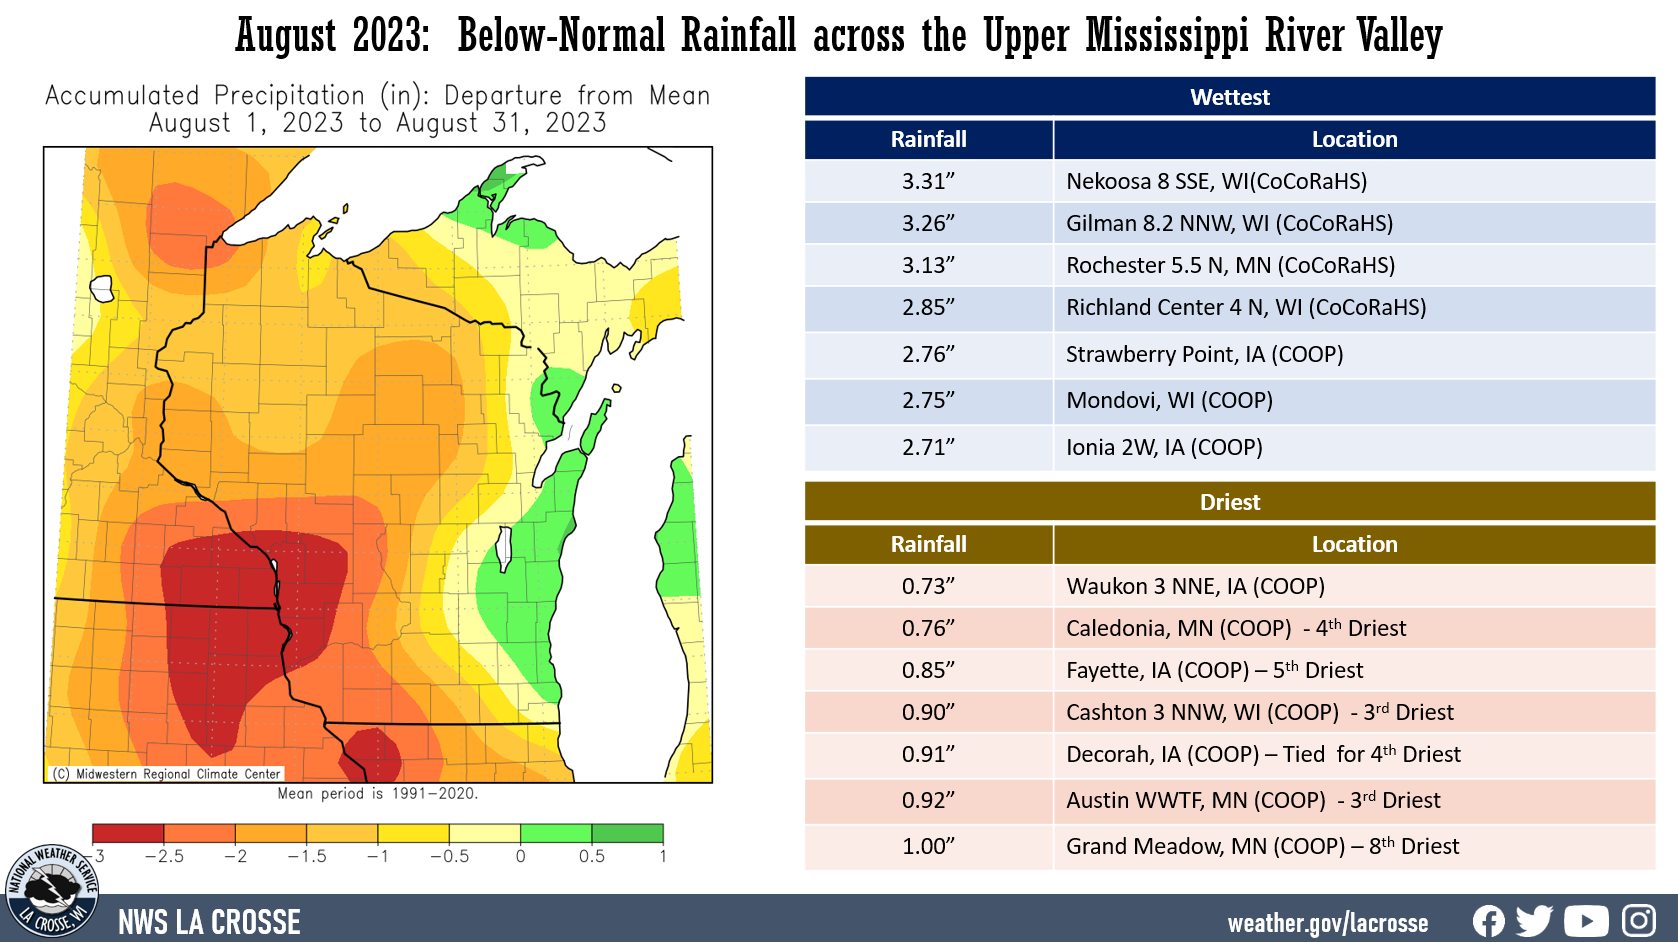
| Rainfall was below normal during August 2023 ranging from 0.73" at Waukon 3 NNE, IA (COOP) to 3.31" at Nekoosa 8 SSE, WI (CoCoRaHS). Rainfall anomalies ranged from 1" to 3" drier than normal. The highest one-day precipitation was 2.40" at Rochester 5.5 N, IA (CoCoRaHS) from August 4-5. |
 |
Moderate (D1) to extreme (D3) drought continued across the Upper Mississippi River Valley. Extreme (D3) drought expanded from 15.7% at the beginning of the month to 56.6% during late August. This latest value is the greatest percentage of extreme (D3) drought for the La Crosse HSA. The previous record was 53.1% on December 9, 2003. The USDM started in January 2000.
There were 17 convective warnings (16 severe thunderstorm warnings and 1 tornado warning) in August. The long-term average (1986-2023) for August is 18 severe weather warnings (14 severe thunderstorm warnings, 1 tornado warning, and 2 flash flood warnings).
Below are the August 2023 climate summaries for La Crosse, WI, and Rochester, MN.
La Crosse, WI
August 2023 was the 16th Driest and Tied for the 13th Warmest in La Crosse, WI
...August 2023 Highlights...
Temperatures - Tied for the 13th warmest August
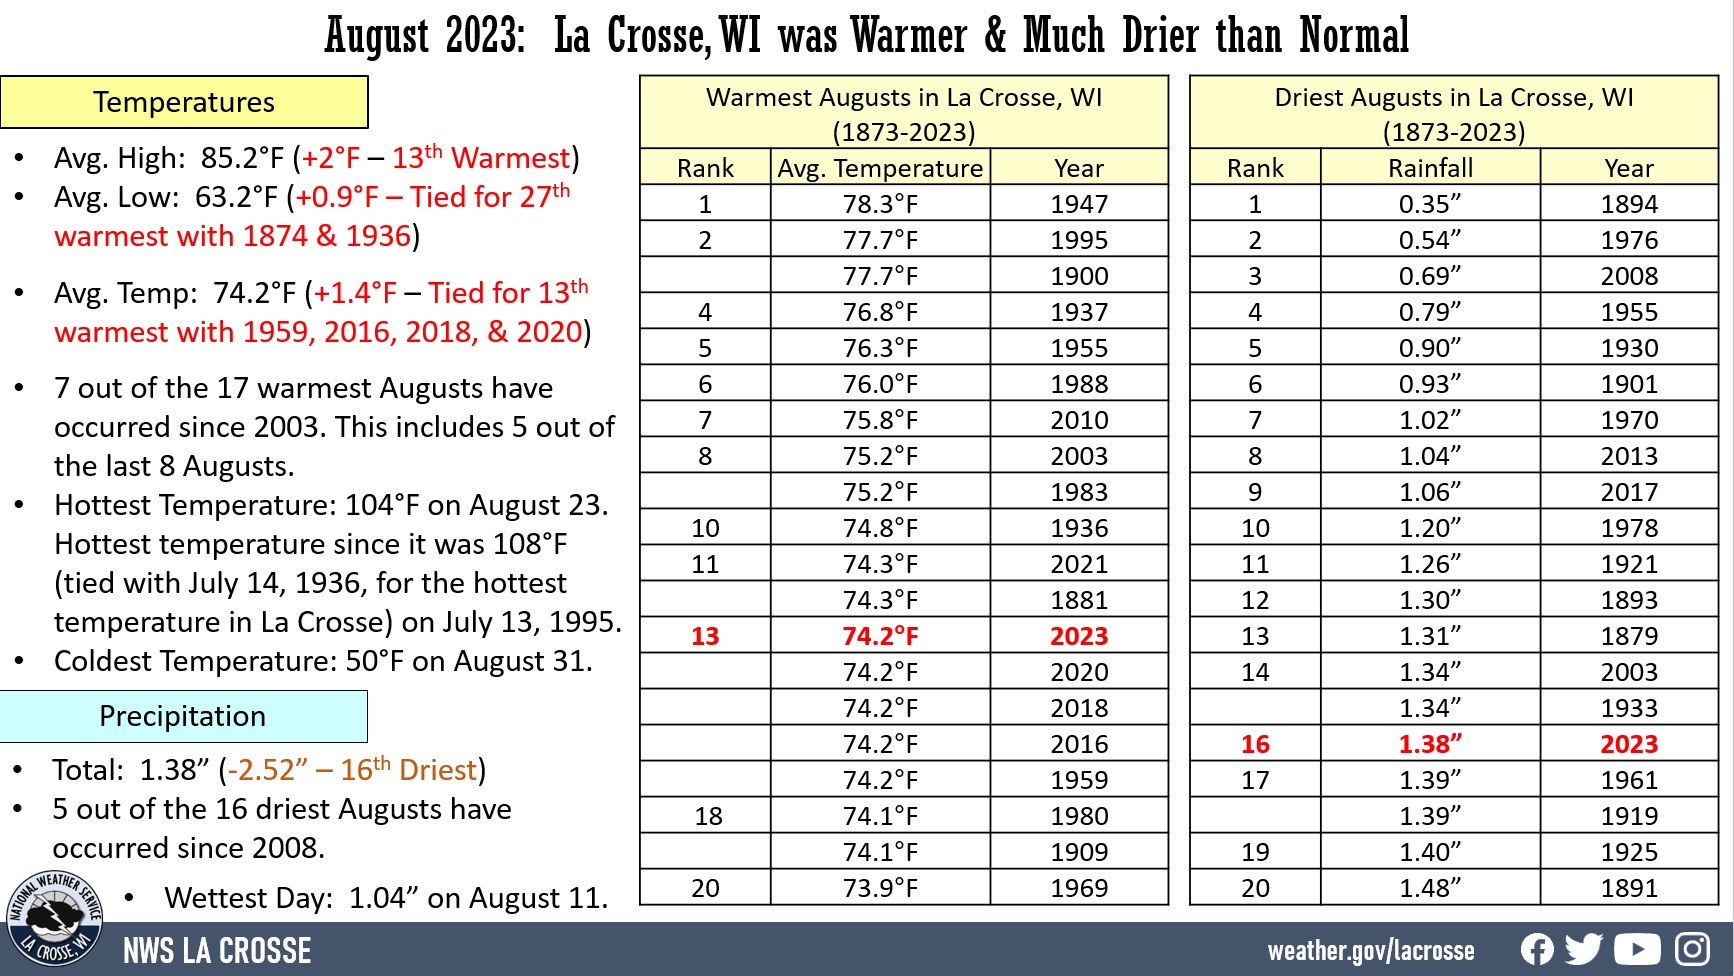
- The average temperature at La Crosse Regional Airport was 74.2°F. This was 1.4°F warmer than the 1991-2020 normal of 72.8°F. This was tied for the 13th warmest August with 1959, 2016, 2018, and 2020. The hottest August was 78.3°F in 1947. Below are the 20 warmest Augusts in La Crosse, WI.
|
 |
20 Warmest Augusts
in La Crosse, WI
1873-2023
Rank Avg. Temp Year
---- --------- ----
1 78.3°F 1947
2 77.7°F 1995
77.7°F 1900
4 76.8°F 1937
5 76.3°F 1955
6 76.0°F 1988
7 75.8°F 2010
8 75.2°F 2003
75.2°F 1983
10 74.8°F 1936
11 74.3°F 2021
74.3°F 1881
13 74.2°F 2023
74.2°F 2020
74.2°F 2018
74.2°F 2016
74.2°F 1959
18 74.1°F 1980
74.1°F 1909
20 73.9°F 1969
- 7 out of the 17 warmest Augusts have occurred since 2003. This includes 5 out of the last 8 Augusts.
- The average high temperature was 85.2°F. This was 2°F warmer than the 1991-2020 normal of 83.2°F. This was the 13th warmest. The hottest was 87.9°F in 1900.
- The average low temperature was 63.2°F. This was 0.9°F warmer than the 1991-2020 normal of 62.3°F. This was tied with 1874 and 1936 for the 27th warmest.
- The hottest temperature was 104°F on August 23. This was the 2nd hottest August temperature. Only August 1, 1988, was hotter with a high temperature of 105°F. This was the first 100°F or hotter temperature since July 17, 2012 (100°F). This was the hottest temperature since it was 108°F (tied with July 14, 1936, for the hottest temperature in La Crosse) on July 13, 1995.
- The coldest high temperature was 68°F on August 14. This was tied with 1883 and 1887 for the 3rd coldest high temperature for this date. Only 1951 (65°F) and 1929 (66°F) were colder.
- The warmest low temperature was 79°F on August 23. This tied August 24, 1948; August 2, 1964; August 1, 1988; August 16-17, 1988; August 7, 2011; and August 27, 2013 for the warmest August low temperature.
- The coldest low temperature was 50°F on August 31.
- On August 23, the average temperature was 91.5°F. This was the second hottest August daily temperature. Only August 1, 1988, was hotter with an average temperature of 92°F. This was tied with July 14, 1936, for the 5th hottest average temperature for any month. Only July 13, 1995 (94.5°F); July 21, 1901 (92.5°F); July 4, 2012 (92°F), and August 1, 1988 (92°F) were hotter for any month.
- There were 8 days with temperatures of 90°F or hotter. The long-term average (1873-2023) is 4 days.
Rainfall - 16th Driest
- A total of 1.38 inches of rain fell at La Crosse Regional Airport. This was 2.52 inches drier than the 1991-2020 normal of 3.90 inches (4th wettest month). This was the 16th driest August and the driest since 2017 (1.06 inches). Below are the 20 driest Augusts in La Crosse, WI.
20 Driest Augusts
in La Crosse, WI
1873-2023
Rank Rainfall Year
---- -------- ----
1 0.35 inches 1894
2 0.54 inches 1976
3 0.69 inches 2008
4 0.79 inches 1955
5 0.90 inches 1930
6 0.93 inches 1901
7 1.02 inches 1970
8 1.04 inches 2013
9 1.06 inches 2017
10 1.20 inches 1978
11 1.26 inches 1921
12 1.30 inches 1893
13 1.31 inches 1879
14 1.34 inches 2003
1.34 inches 1933
16 1.38 inches 2023
17 1.39 inches 1961
1.39 inches 1919
19 1.40 inches 1925
20 1.48 inches 1891
- 5 out of the 16 driest Augusts have occurred since 2008.
- The wettest day occurred on August 11 when 1.04 inches of rain fell.
...Records...
Daily Records...
- August 23 - High Temperature 104°F. Previous Record 101°F in 1948.
- August 23 - Warmest Low Temperature 79°F. Previous Record 78°F in 1948.
- August 23 - Warmest Daily Average Temperature 91.5°F. Previous Record 89.5°F in 1948.
Monthly Record...
- August 23 - Tied Warmest August Low Temperature 79°F. This tied August 24, 1948; August 2, 1964; August 1, 1988; August 16-17, 1988; August 7, 2011; and August 27, 2013 for the warmest August low temperature.
...Looking Ahead to September...
- The normal high temperature in La Crosse starts off at 81°F on September 1st and falls to 69°F by the end of the month. The normal low temperature starts off at 59°F on the 1st and falls to 48°F by the end of the month. The warmest September temperature on record was 101°F on September 6, 1922, and the coldest was 24°F on September 30, 1899.
- The normal mean temperature for September is 64.8°F. La Crosse’s hottest September occurred in 2015 with an average temperature of 69.3°F, and its coldest September occurred in 1918 with an average temperature of 54.8°F.
- The normal September rainfall is 3.63 inches. The wettest September occurred in 1881 with 10.87 inches of rain, while the driest September occurred in 1940, with only 0.29 inches of precipitation. The wettest September day occurred on September 6, 1884, when 5.55 inches of rain fell. Normally, there are 4 days with thunderstorms.
- While typically no snow falls during September, measurable snow did fall in 1942 (0.2 inches on September 26).
- Valley fog is quite prevalent in the area. On average, this fog reduces the visibility to a quarter-mile or less at the airport on 3 days.
August 2023 was the 12th Driest and Tied for the 21st Warmest in Rochester, MN
...August 2023 Highlights...
Temperatures - Tied for the 21st Warmest
- The average temperature at Rochester International Airport was 70.6°F. This was 2.4°F warmer than the 1991-2020 normal of 68.2°F. This was tied with 1984 for the 21st warmest.
- The average high temperature was 81.1°F. This was 3.1°F warmer than the 1991-2020 normal of 78°F. This was the 30th warmest.
- The average low temperature was 60.1°F. This was 1.8°F warmer than the 1991-2020 normal of 58.3°F. This was the 18th warmest. Tied for the 18th warmest with 1936 and 1980.
|
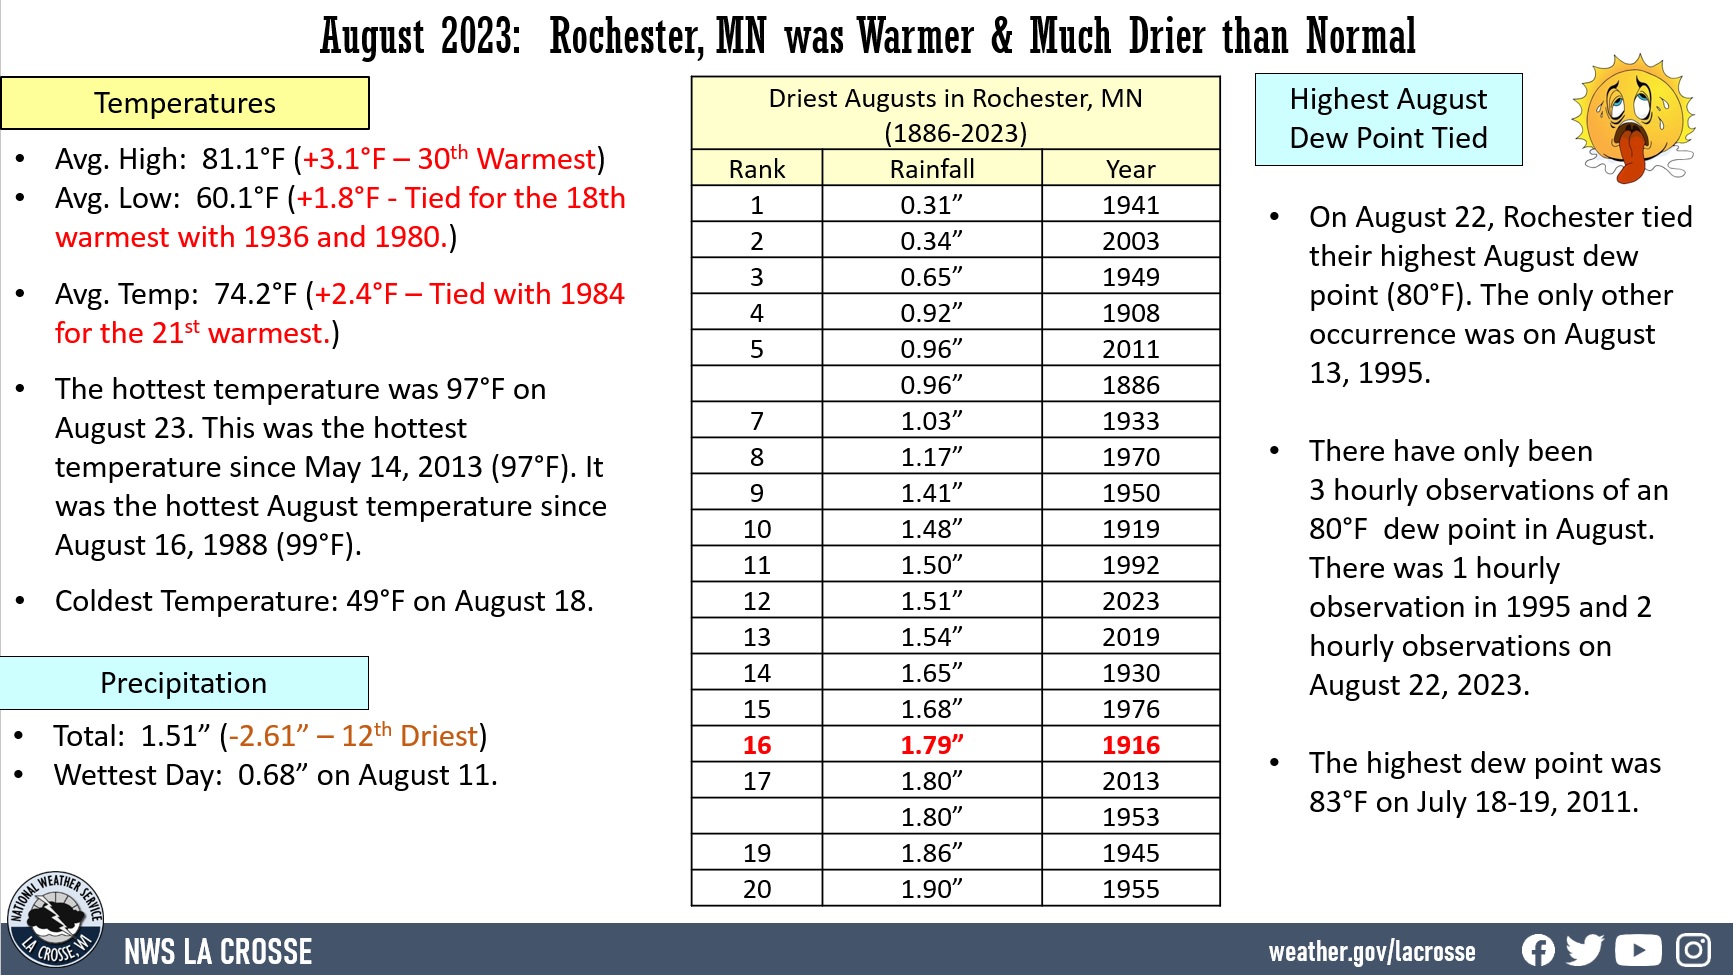 |
- The hottest temperature was 97°F on August 23. This was the hottest temperature since May 14, 2013 (97°F). It was the hottest August temperature since August 16, 1988 (99°F).
- The coldest high temperature was 68°F on August 13. This is the 6th coldest high for this date. Only 1917 (64°F), 1951 (65°F), 1964 (66°F), 1986 (66°F), and 1992 (67°F) were colder.
- The warmest low temperature was 77°F on August 23. This was tied with August 17, 1988, for 3rd warmest August low temperature. Only August 24, 1948, and August 27, 1886, were warmer with a low temperature of 78°F.
- The coldest low temperature was 49°F on August 18.
- There were 2 days with temperatures of 90°F or hotter. The long-term average (1886-2023) is 3 days.
Rainfall - 12th Driest
- A total of 1.51 inches of rain fell at Rochester International Airport. This was 2.61 inches drier than the 1991-2020 normal of 4.12 inches (4th wettest month). This was the 12th driest. Below are the 20 driest Augusts in Rochester, MN.
20 Driest Augusts
in Rochester, MN
1886-2023
Rank Rainfall Year
---- -------- ----
1 0.31 inches 1941
2 0.34 inches 2003
3 0.65 inches 1949
4 0.92 inches 1908
5 0.96 inches 2011
0.96 inches 1886
7 1.03 inches 1933
8 1.17 inches 1970
9 1.41 inches 1950
10 1.48 inches 1919
11 1.50 inches 1992
12 1.51 inches 2023
13 1.54 inches 2019
14 1.65 inches 1930
15 1.68 inches 1976
16 1.79 inches 1916
17 1.80 inches 2013
1.80 inches 1953
19 1.86 inches 1945
20 1.90 inches 1955
- The wettest day occurred on August 11 when 0.68 inches of rain fell.
...Records...
Daily Record...
- August 23 - Warmest Low Temperature 77°F. Previous Record 76°F in 1948.
Monthly Record...
- On August 22, Rochester tied their highest August dew point (80°F). The only other occurrence was on August 13, 1995. There have only been 3 hourly observations of an 80°F dew point in August. There was 1 hourly observation in 1995 and 2 hourly observations on August 22, 2023. The highest dew point was 83°F on July 18-19, 2011.
...Looking Ahead to September...
The normal high temperature in Rochester starts off at 76°F on September 1st and falls to 66°F by the end of the month. The normal low temperature starts off at 56°F on the 1st and falls to 45°F by the end of the month. The warmest September temperature on record was 100°F on September 6, 1913, and the coldest was 22°F on September 28, 1942.
The normal mean temperature for September is 61.1°F. Rochester’s hottest September occurred in 1908 with an average temperature of 69.5°F, and its coldest September occurred in 1993 with an average temperature of 53.6°F.
The normal September rainfall is 3.60 inches. The wettest September was in 1986 with 10.50 inches of rain, while the driest September occurred in 1953, with only 0.33 inches of precipitation. The wettest September day occurred on September 12, 1978, when 5.98 inches of rain fell. Normally, there are 5 days with thunderstorms.
While typically no snow falls during September, measurable snow did fall in 1942 (0.3 inches on September 26) and 1961 (0.8 inches on September 30).


 Weather Story
 Weather Map
 Local Radar