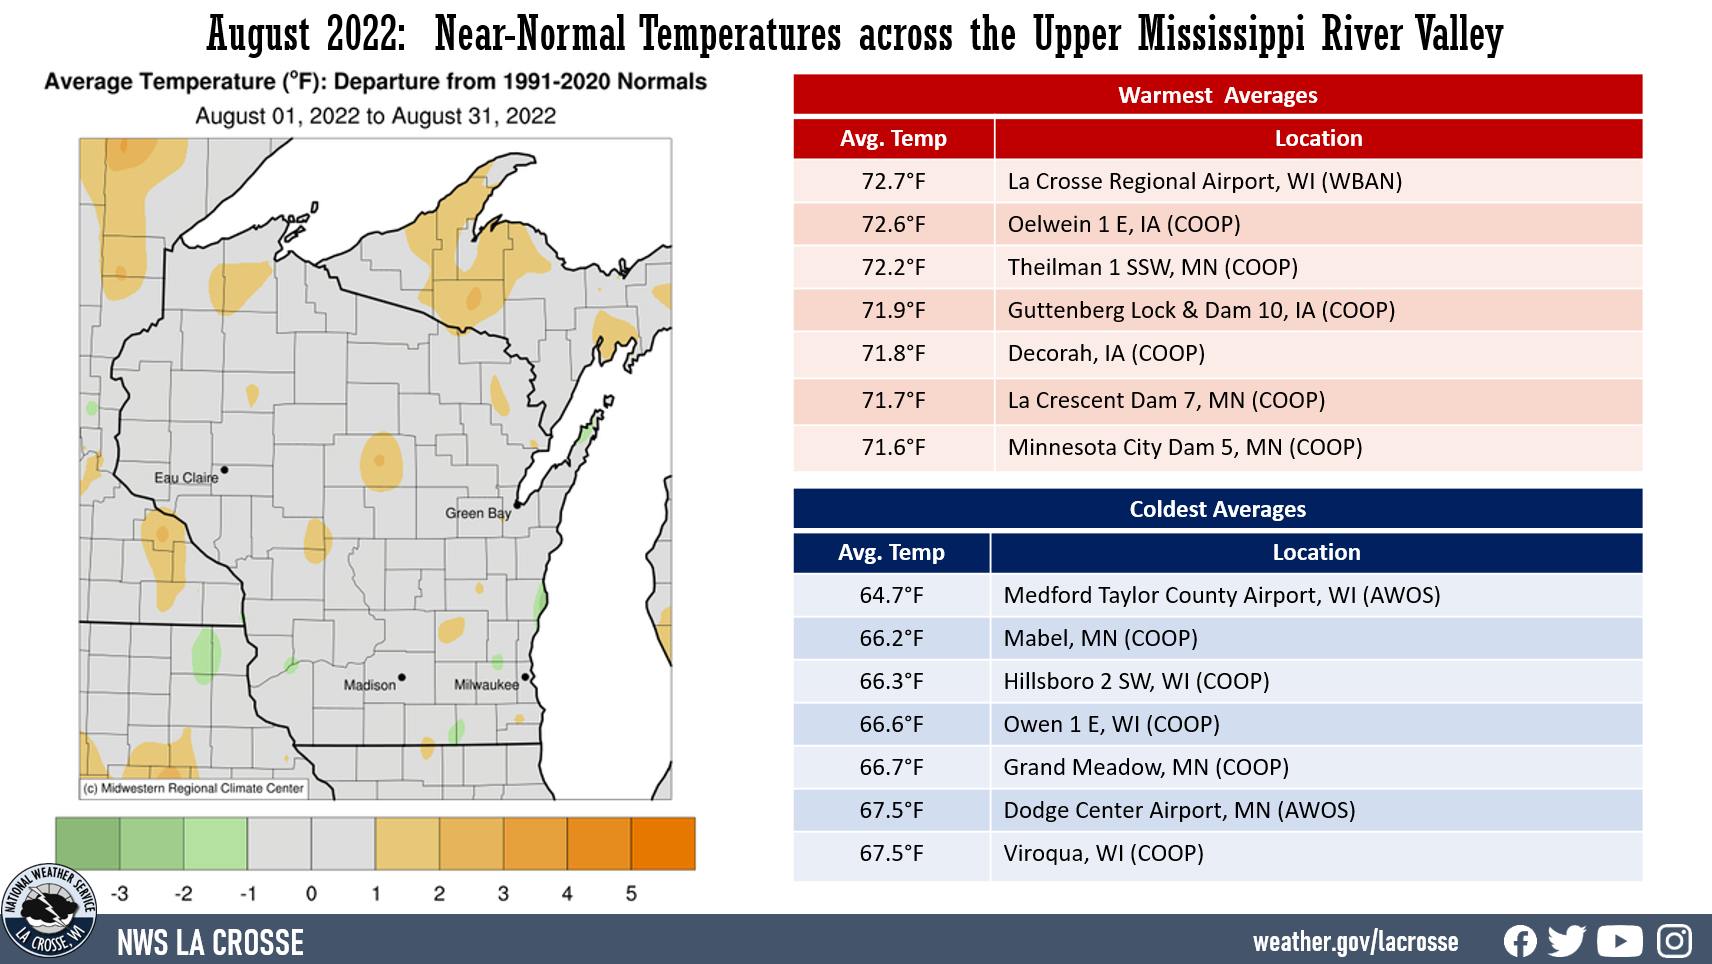
| During August 2022, temperatures averaged near-normal across the Upper Mississippi River Valley. Monthly average temperatures ranged from 64.7°F at Medford Taylor County Airport, WI (AWOS) to 72.7°F at La Crosse Regional Airport, WI (ASOS). The hottest temperature was 94°F near Theilman, MN (COOP) on August 4 and the coldest temperature was 44°F near Mather. WI on August 17. |
 |
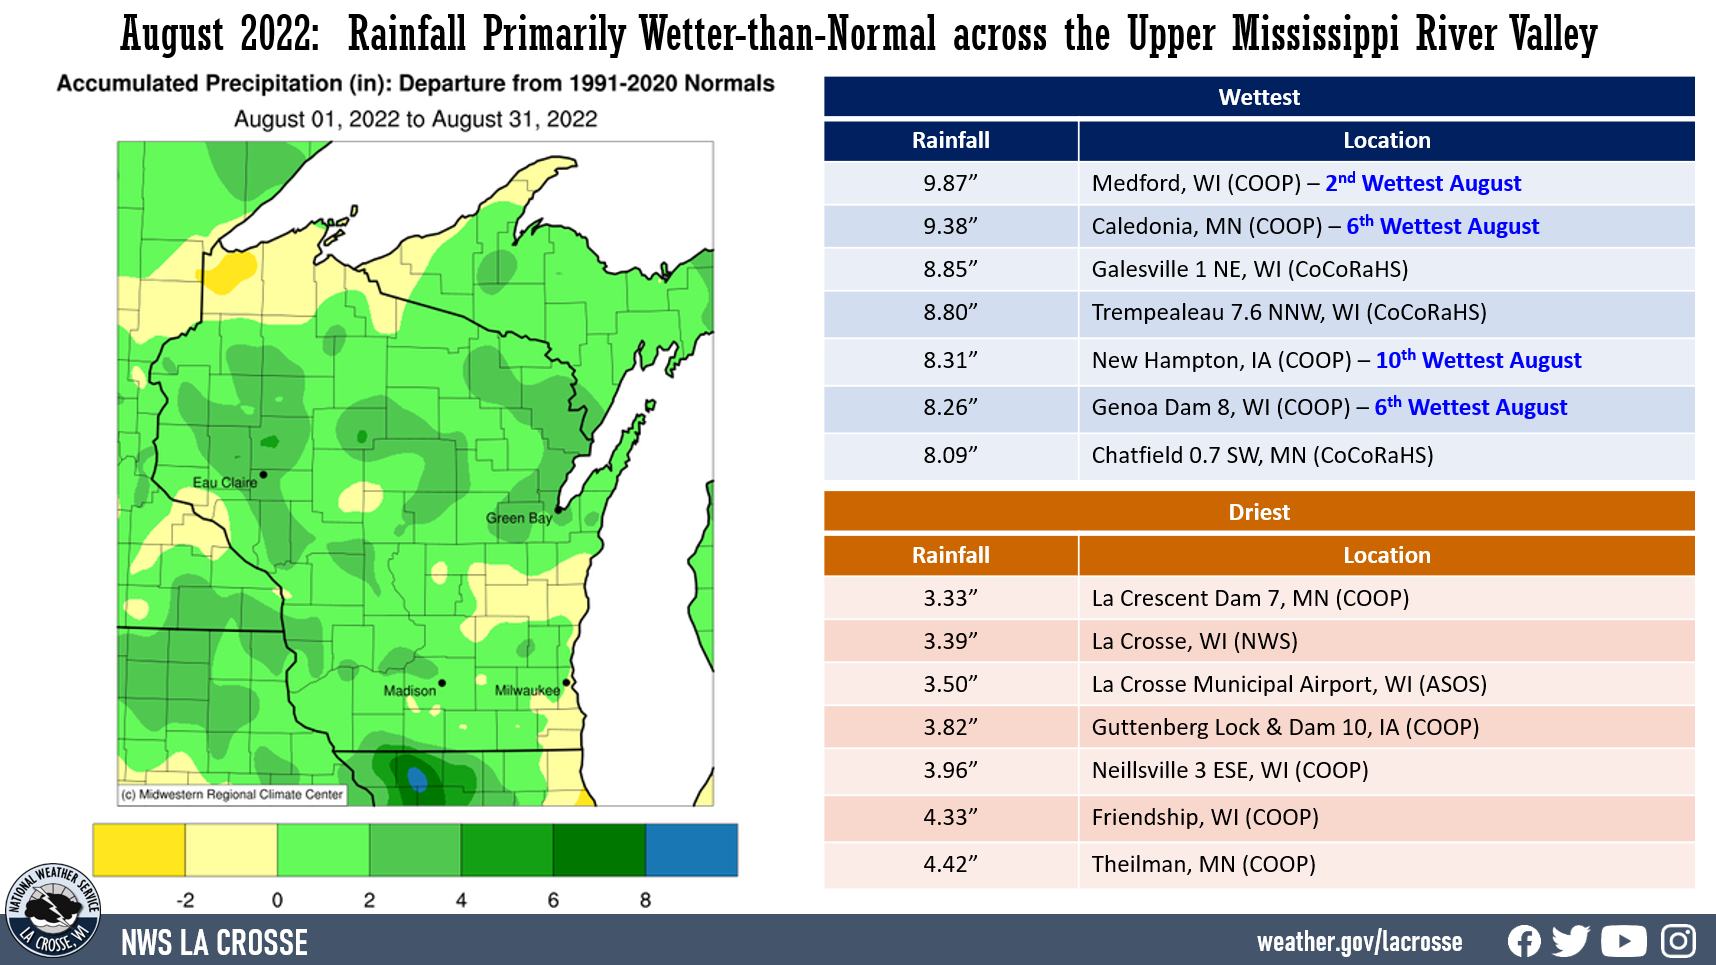
It was primarily wetter-than-normal across The Upper Mississippi River Valley. Rain totals ranged from 3.33” at La Crescent Dam (COOP) to 9.87” at Medford, WI (COOP). The greatest 1-day rainfall was 4.02" near Black River Falls, WI (CoCoRaHS). This rain fell from 7 AM on August 27 to 7 AM on August 28.
Rainfall anomalies ranged from 2” drier-than-normal to 4” wetter-than-normal across the Upper Mississippi River Valley. Medford, WI had their 2nd wettest August (9.87”). Only 1941 was wetter with 10.74". Both Caledonia, MN (9.38” – their wettest August was 18.96" in 2007) and Genoa Dam 8, WI (8.26” – their wettest August was 19.80" in 2007) had their 6th wettest August. Finally, New Hampton, IA had their 10th wettest August (8.31” – their wettest August was 18.60" in 2021). No areas were among their 10 driest. |
 |
It was a relatively quiet severe weather month. There were 5 severe thunderstorm warnings. The long-term average is 14. This tied 2002 and 2009 for the 9th least in August. The least in August was 0 in 1986, 1987, 1988, and 2017. There was 1 flash flood warning. The long-term average is 2. During the evening of August 2 and early morning hours of August 3, severe thunderstorms moved southeast across Taylor and Clark counties in north-central Wisconsin. Around 3 AM, these storms snapped and uprooted trees, produced roof damage, and flipped a camper in Thorp. During the late afternoon of August 19, quarter-size hail fell in Oelwein, IA. During the evening of August 27, severe storms moved across Dodge County in southeast Minnesota; and in Allamakee, Chickasaw, Fayette, and Winneshiek counties in northeast Iowa. These storms blew down some trees onto roads near Jackson Junction and Decorah, IA (Winneshiek County). Power poles were broken near Oronoco, MN (Olmsted County).
Below are the August 2022 climate summaries for La Crosse, WI, and Rochester, MN.
La Crosse, WI
August 2022 - Slightly Cooler and Drier than Normal in La Crosse, WI
...August 2022 Highlights...
Temperatures...Near Normal
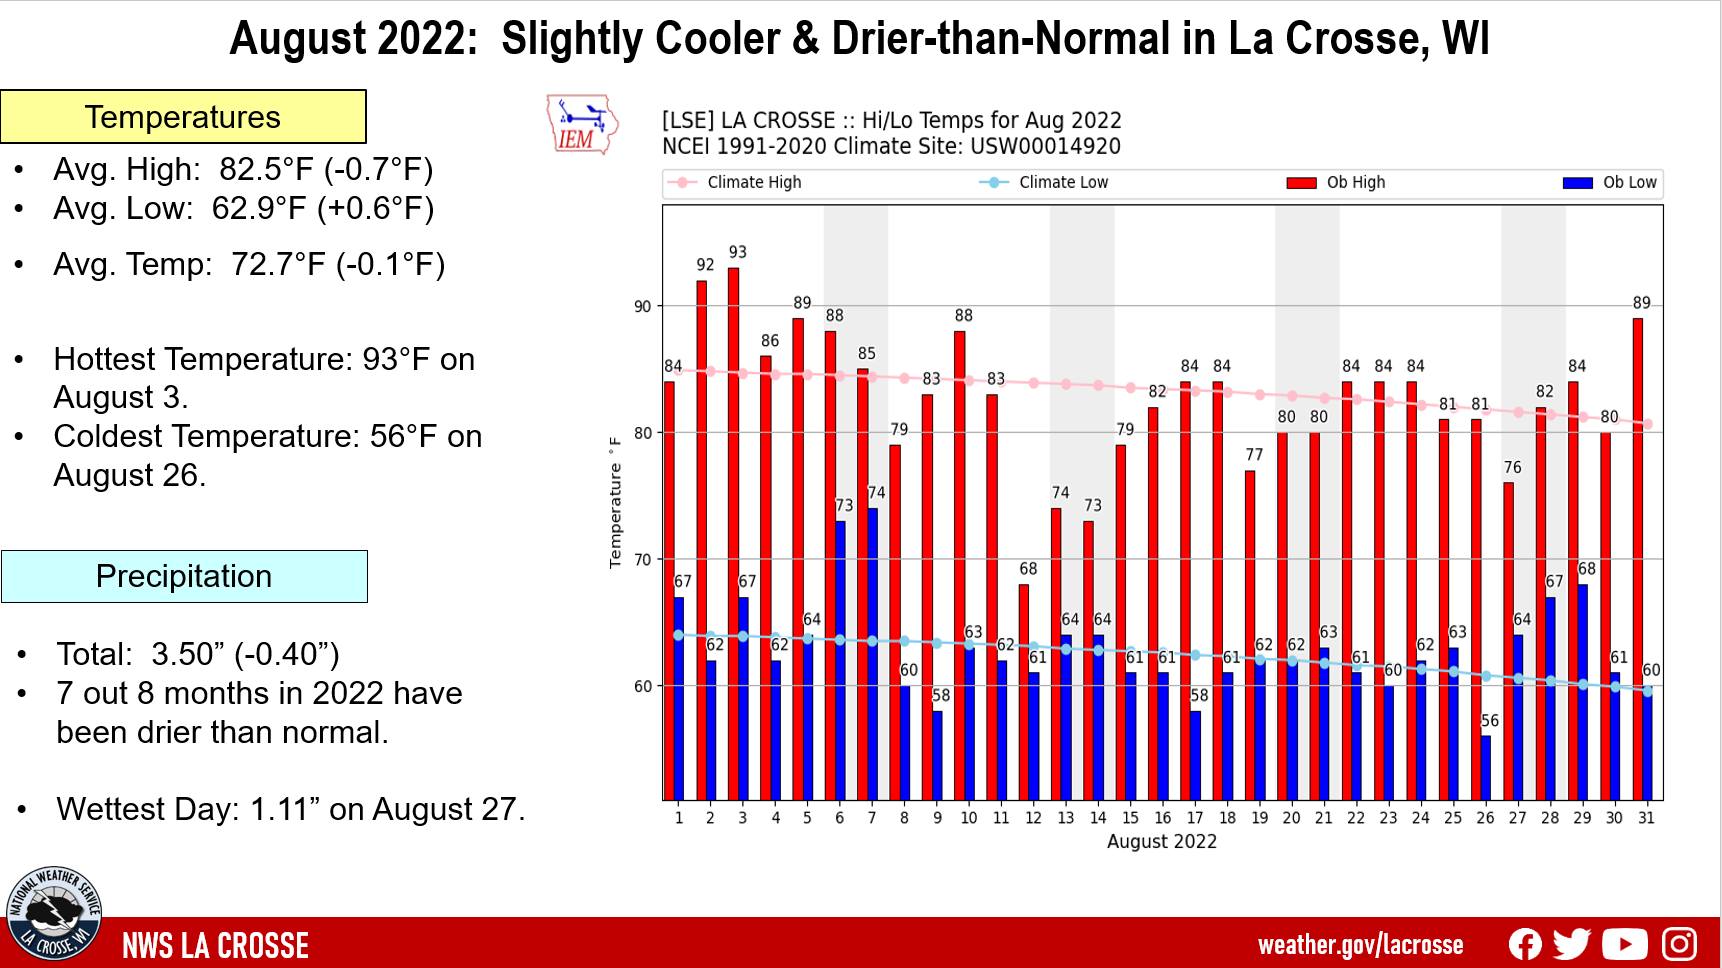
- For the second month in a row, temperatures were near normal or normal at La Crosse Regional Airport. The average temperature was 72.7°F. This was 0.1°F cooler than1991-2020 normal of 72.8°F.
- The average high temperature was 82.5°F. This was 0.7°F cooler than the 1991-2020 normal of 83.2°F.
- The average low temperature was 62.9°F. This was 0.6°F warmer than the1991-2020 normal of 62.3°F.
- There were 2 days with high temperatures of 90°F or hotter. This was 2 days below the long-term average of 4 days.
- The hottest temperature was 93°F on August 3.
- The coldest temperature was 56°F on August 26.
|
 |
Rainfall...Slightly Drier-than-Normal
- During August, 3.50" of rain fell at La Crosse Regional Airport. This was 0.40" drier than the 1991-2020 normal of 3.90".
- 7 out of the 8 months this year have been drier than normal. The largest monthly deficit was 0.85" in February. The only month which was wetter than normal was June and that month only had a surplus of 0.07". Through the end of August, 22.78" of precipitation fell. This was 2.99" below the 1991-2020 normal of 25.77". This was the 84th driest and 67th wettest start to a year.
- The wettest day was 1.11" inches on August 27.
- There were 8 days with thunderstorms and 4 days with dense fog.
...August 2022 Records...
...Looking Ahead to September...
- The normal high temperature in La Crosse starts off at 81°F on September 1st and falls to 69°F by the end of the month. The normal low temperature starts off at 59°F on the 1st and falls to 48°F by the end of the month. The warmest September temperature on record is 101°F on September 6, 1922, and the coldest is 24°F on September 30, 1899.
- The normal mean temperature for September is 64.8°F. La Crosse’s hottest September occurred in 2015 with an average temperature of 69.3°F, and their coldest September occurred in 1918 with an average temperature of 54.8°F.
- The normal September rainfall is 3.63". The wettest September occurred in 1881 with 10.87" of rain, while the driest September occurred in 1940, with only 0.29" of precipitation. The wettest September day occurred on September 6, 1884, when 5.55" of rain fell. Normally, there are 4 days with thunderstorms.
- While typically no snow falls during September, measurable snow did fall in 1942 (0.2" on September 26).
- Valley fog is quite prevalent in the area. On average, this fog reduces the visibility to a quarter-mile or less at the airport on 3 days.
Rochester, MN
August 2022 - Slightly Cooler and Much Wetter than Normal in Rochester, MN
...August 2022 Highlights...
Temperatures...Near Normal
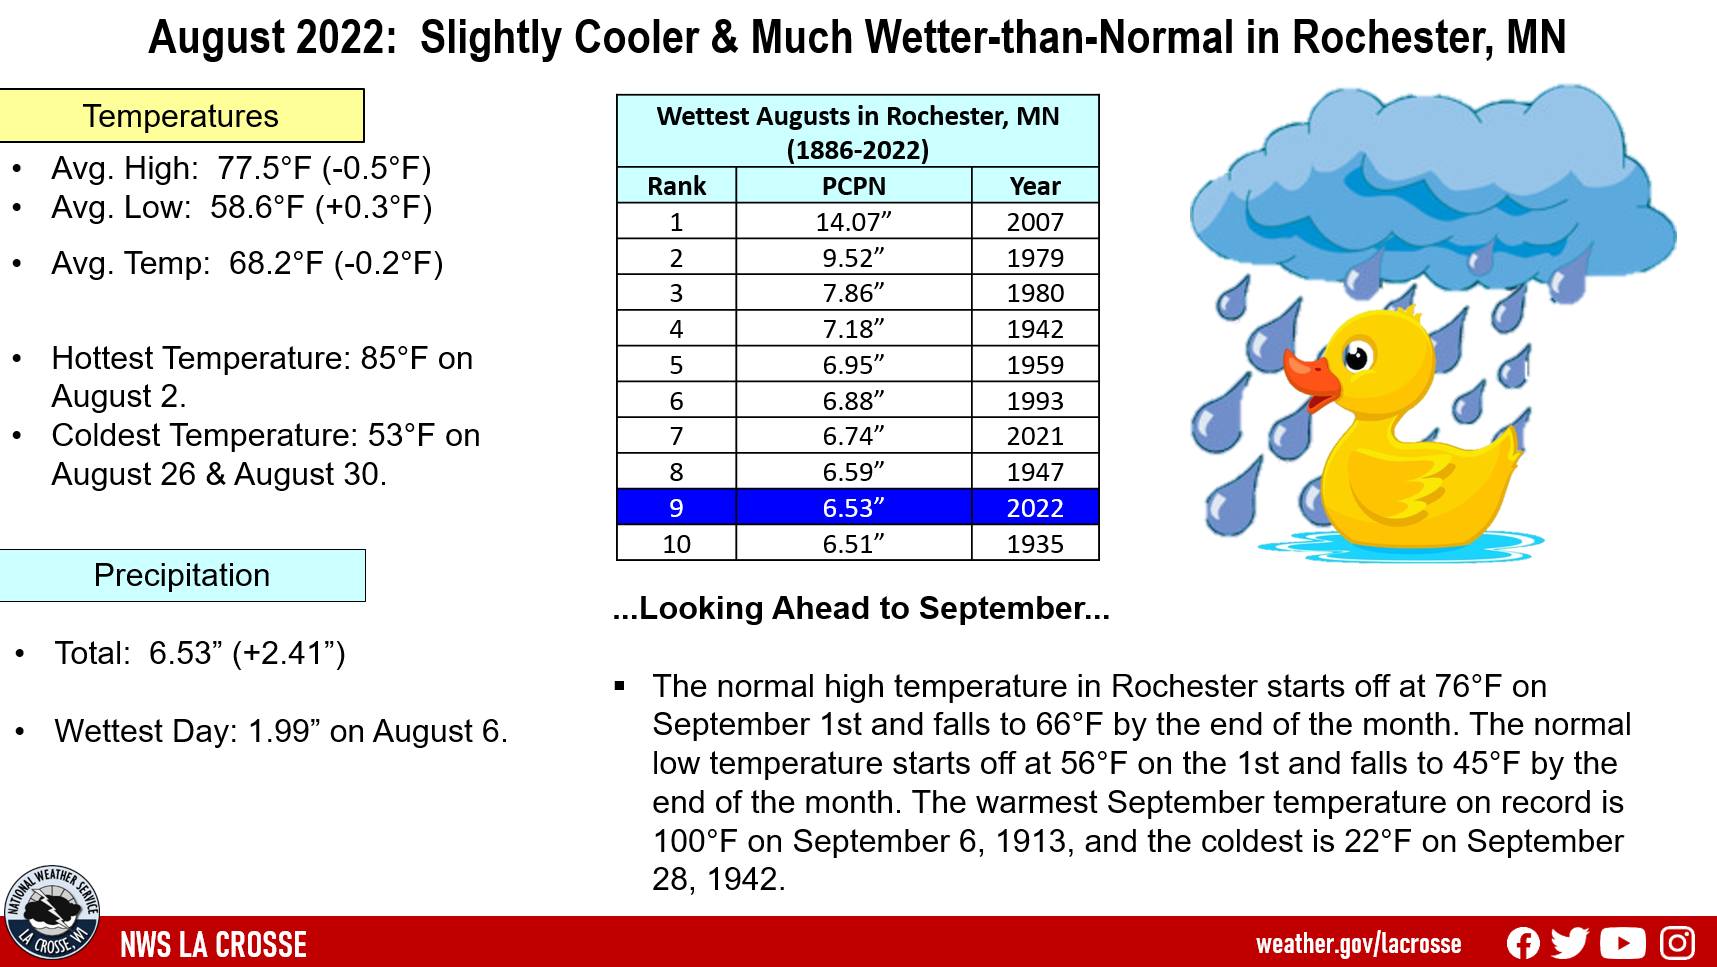
- The average temperature at Rochester International Airport was 68°F. This was 0.2°F cooler than the 1991-2020 normal of 68.2°F.
- The average high temperature was 77.5°F. This was 0.5°F cooler than the 1991-2020 normal of 78°F.
- The average low temperature was 58.6°F. This was 0.3°F warmer than the 1991-2020 normal of 58.3°F.
- There were no days with high temperatures 90°F or hotter. This was 3 days below the long-term average of 3 days.
- The hottest temperature was 85°F on August 2.
- The coldest temperature was 53°F on August 26 and 30.
|
 |
Rainfall...9th Wettest
- During August, 6.53" of rain fell at Rochester International Airport. This was 2.41" wetter than the 1991-2020 normal of 4.12". This was the 9th wettest August. This was the second August in a row to finish in the top ten for wettest Augusts. During 2021, 6.74" of rain fell (7th wettest). The wettest August occurred in 2007 when 14.07" of rain fell. The table below lists the ten wettest Augusts for Rochester MN.
Ten Wettest Augusts
in Rochester MN
Rank Rainfall Year
---- -------- ----
1 14.07 inches 2007
2 9.52 inches 1979
3 7.86 inches 1980
4 7.18 inches 1942
5 6.95 inches 1959
6 6.88 inches 1993
7 6.74 inches 2021
8 6.59 inches 1947
9 6.53 inches 2022
10 6.51 inches 1935
- The wettest day was 1.99" on August 6.
- There were 5 days with thunderstorms and 5 days with dense fog.
...August 2022 Records...
...Looking Ahead to September...
- The normal high temperature in Rochester starts off at 76°F on September 1st and falls to 66°F by the end of the month. The normal low temperature starts off at 56°F on the 1st and falls to 45°F by the end of the month. The warmest September temperature on record is 100°F on September 6, 1913, and the coldest is 22°F on September 28, 1942.
- The normal mean temperature for September is 61.1°F. Rochester’s hottest September occurred in 1908 with an average temperature of 69.5°F, and their coldest September occurred in 1993 with an average temperature of 53.6°F.
- The normal September rainfall is 3.60". The wettest September was in 1986 with 10.50" of rain, while the driest September occurred in 1953, with only 0.33" of precipitation. The wettest September day occurred on September 12, 1978, when 5.98" of rain fell. Normally, there are 5 days with thunderstorms.
- While typically no snow falls during September, measurable snow did fall in 1942 (0.3" on September 26) and 1961 (0.8" on September 30).

