Upper Mississippi River Climate Summary for April 2024:
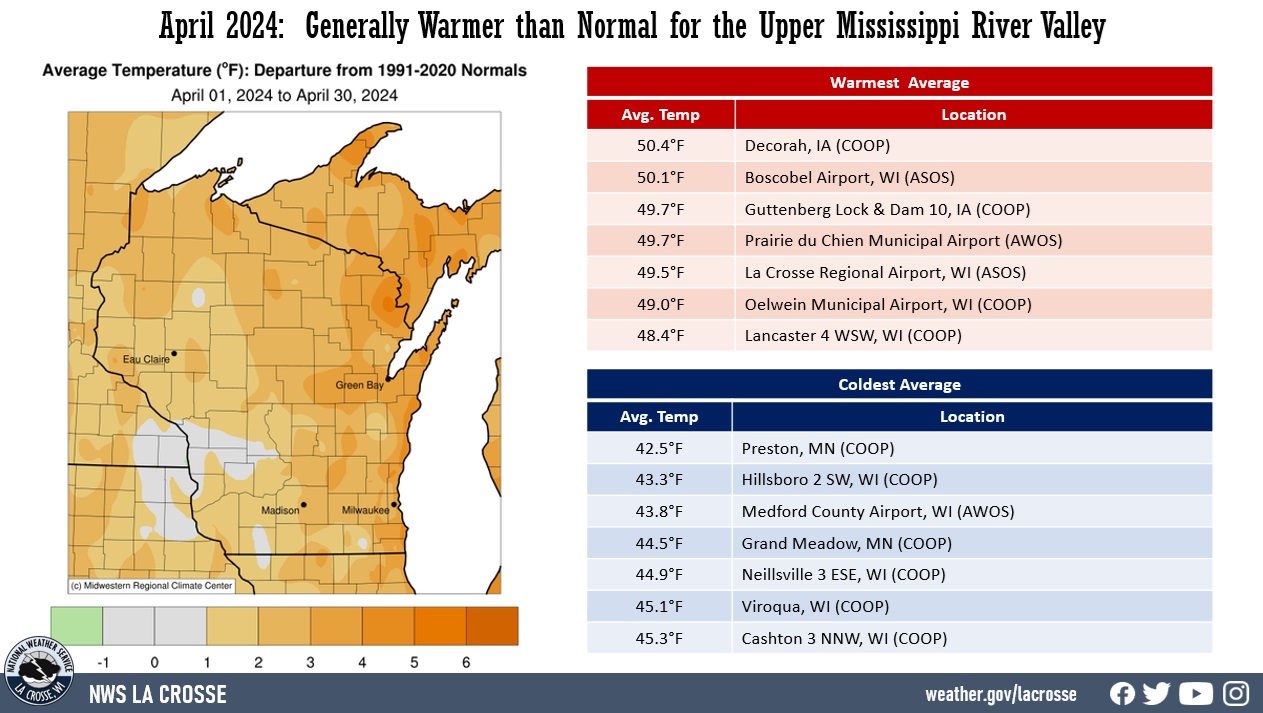
Temperatures - Generally Warmer than Normal
- During April 2024, average temperatures ranged from 42.5°F at Preston, MN (COOP) to 50.4°F at Decorah, IA (COOP).
- Temperature anomalies ranged from near normal to 2°F above normal.
- There was a 68°F difference between the warmest and coldest temperatures in the Upper Mississippi River Valley. The warmest temperature was 84°F at Boscobel Airport, WI (ASOS) on April 14. Meanwhile, the coldest temperature was 16°F at Sparta Fort/McCoy Airport, WI on April 16.
|
 |
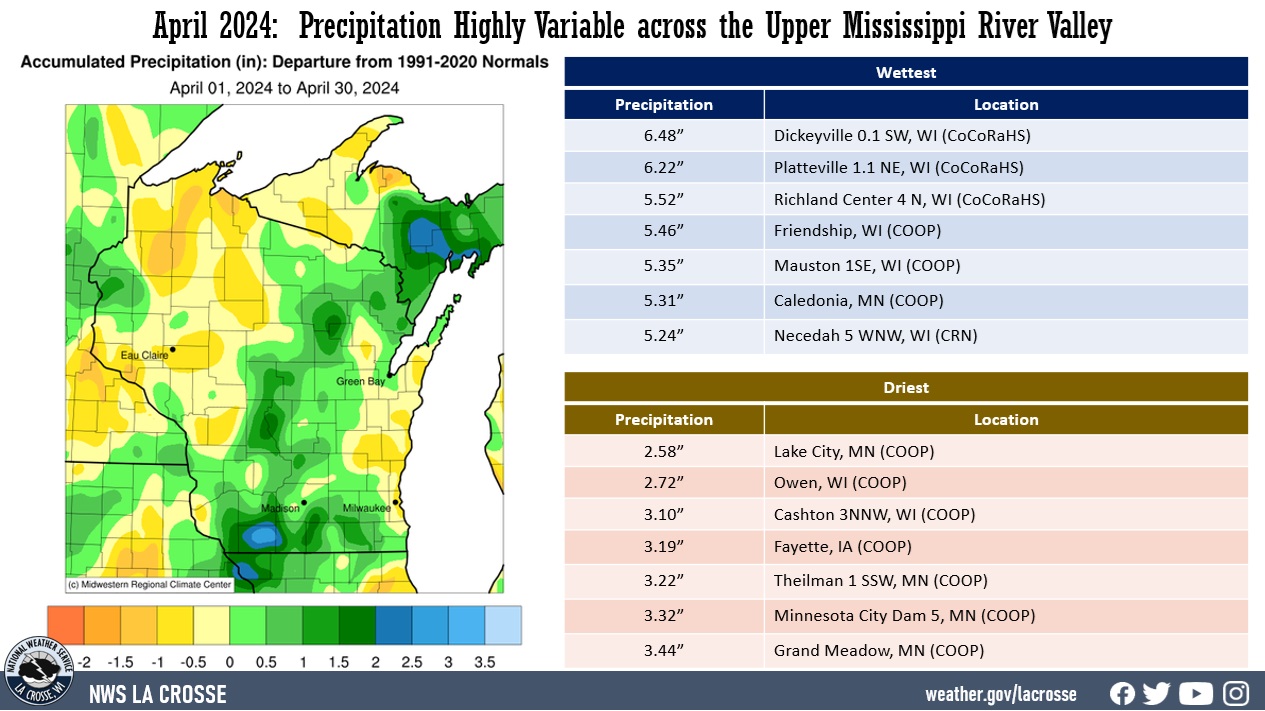
Precipitation - Highly Variable
- Precipitation totals varied from 2.58" at Lake City, MN (COOP) to 6.48" near Dickeyville, WI (CoCoRaHS).
- Precipitation anomalies ranged from 1" drier than normal to 2" wetter than normal.
- The highest one-day precipitation was 2.72" near Postville, IA (COOP) from April 16 through April 17.
- There was a reduction in the abnormally dry conditions north of Interstate 90. There was around a 10% reduction (from 54.1% of the area to 44.5%) in the moderate (D1) to extreme (D3) drought south of Interstate 90.
|
 |
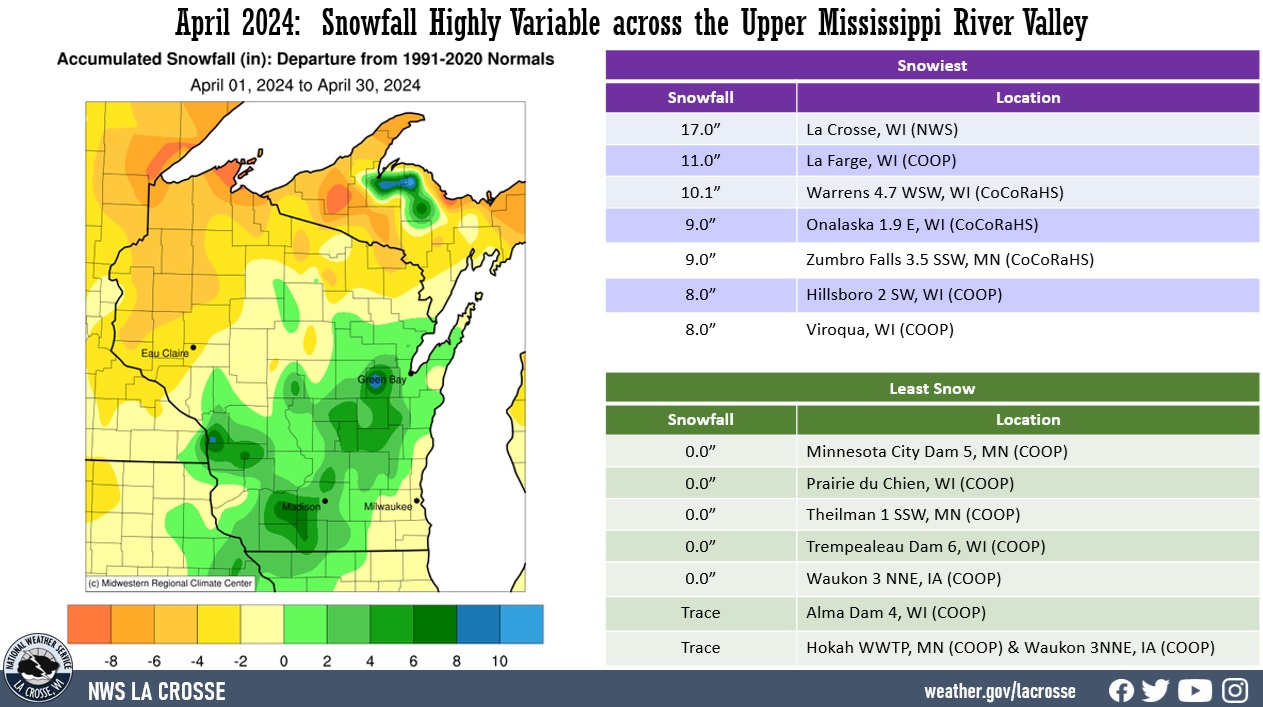
Snowfall - Highly Variable
- Snowfall varied from no snow at Minnesota City Dam 5, MN (COOP); Prairie du Chien, WI (COOP); near Theilman, MN (COOP); Trempealeau Dam 6, WI (COOP); and near Waukon, IA (COOP) to 17" at the La Crosse National Weather Service on top of La Crosse ridge.
- There was a 15.9" difference between NWS La Crosse, WI, and La Crosse Regional Airport (1.1"). These 2 sites are just 4.9 miles apart. The main difference between the snowfalls was the 655-foot elevation difference and the warmth of the Mississippi River.
- Snowfall anomalies ranged from 4" below normal to nearly a foot above normal.
- The highest one-day snowfall was 11.8" at NWS La Crosse, WI on April 2.
|
 |
Below are the April 2024 climate summaries for La Crosse, WI, and Rochester, MN.
La Crosse, WI
April 2024 was Slightly Warmer and Wetter than Normal for La Crosse, WI
...April 2024 Highlights...
Temperatures - Slightly Warmer than Normal
- During April, the average temperature was 49.5°F at La Crosse Regional Airport. This was 0.5°F warmer than the 1991-2020 normal of 49°F.
- This was 9th consecutive month to be warmer than normal. The last month to have below-normal temperatures was July 2023 (72.7°F - 2.3°F colder than normal).
- The average high temperature was 59.7°F. This was 0.1°F warmer than the 1991-2020 normal of 59.6°F.
- The average low temperature was 39.4°F. This was 1°F warmer than the 1991-2020 normal of 38.4°F.
- The warmest temperature was 79°F on April 14 and the coldest temperature was 27°F on April 5.
|
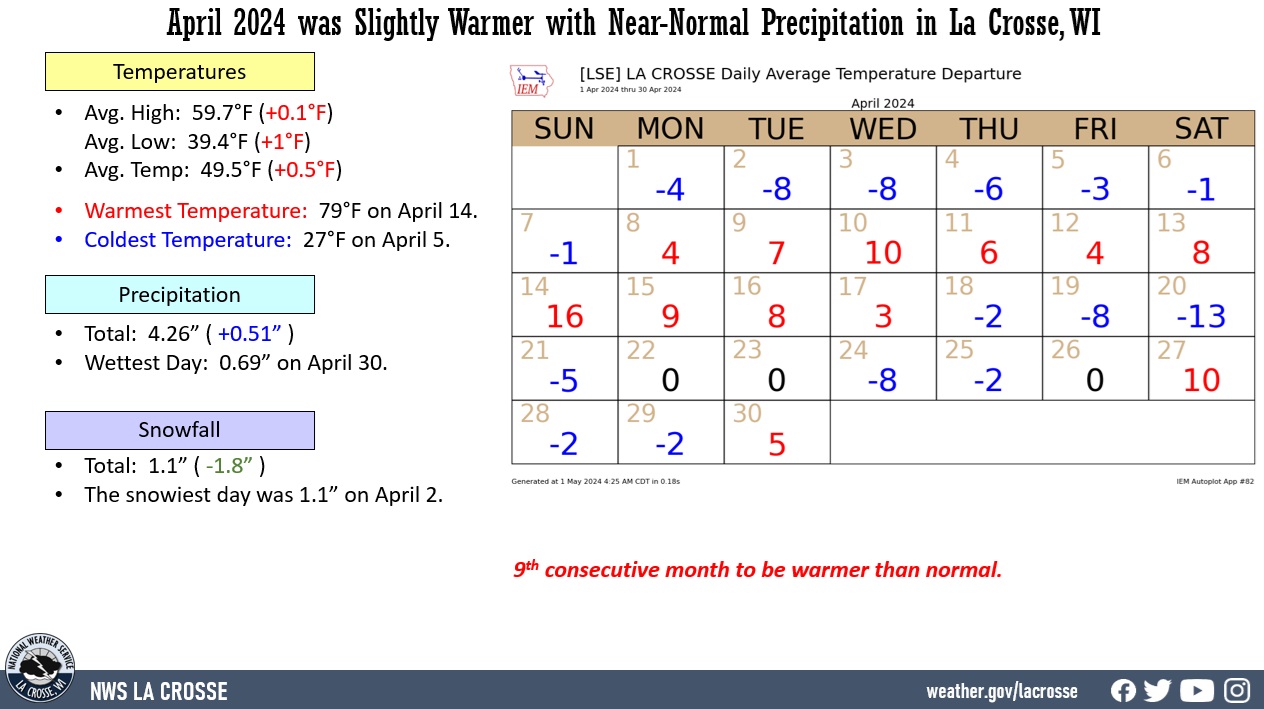 |
Precipitation - Slightly Wetter than Normal
- A total of 4.26" of precipitation fell. This was 0.51" wetter than the 1991-2020 normal of 3.75".
- The wettest day was on April 30 when 0.69" fell.
- Measurable precipitation fell on 14 days (46.7%) and a trace of precipitation fell on another 6 days (20%).
Snowfall - Quite Variable
- Snowfall was quite variable for the area. A total of 1.1" of snow was measured by the official NWS snow observer near La Crosse Regional Airport. This was 1.8" below the 1991-2020 normal of 2.9". Meanwhile, 17" was measured at NWS La Crosse. This was 11" greater than the 1997-2024 average of 6". This snow fell from April 1 through April 3. These 2 sites are just 4.9 miles apart. The main difference between the snowfalls was the 655 foot elevation difference and the warmth of the Mississippi River.
- For the 2023-24 snow season, NWS La Crosse has received 48.7" and the official NWS snow observer near La Crosse Regional Airport received 26". This is a difference of 22.7".
- The snowiest day near La Crosse Regional Airport was 1.1" on April 2.
- At La Crosse Regional Airport, measurable snow fell on 1 day (3.3%) and a trace of snow fell on another 4 days (13.3%). Meanwhile, NWS La Crosse had measurable snow on 3 days (10%) and a trace of snow fell on another 3 days (10%).
...Records...
...Looking Ahead to May...
- The normal high temperature in La Crosse rises from 66°F on May 1st to 77°F by the end of the month. The normal low temperature warms from 45°F on the 1st to 56°F by the end of the month. The normal mean temperature for the month is 61°F. La Crosse's warmest May occurred in 1934 with an average temperature of 68°F, and their coldest May occurred in 1907 with an average temperature of 50.8°F.
- During May, the hottest temperature recorded was 107°F on May 31, 1934, and the coldest temperature was 26°F on May 2, 1911, May 3, 1971, and May 6, 1989.
- The average precipitation for May is 4.33". There are normally 5 days with thunderstorms during May in La Crosse. The wettest May occurred in 2004 with 9.73" of precipitation, while the driest was in 1887 with 0.50". The wettest May day was 3.06" on May 19, 1912.
- Normally, there are 5 days with thunderstorms.
Rochester, MN
April 2024 was Warmer and Slightly Wetter than Normal for Rochester MN
...April 2024 Highlights...
Temperatures - Warmer than Normal
- During April, the average temperature was 46.8°F at Rochester International Airport. This was 1.6°F warmer than the 1991-2020 normal of 45.2°F. This was 9th consecutive month to be warmer than normal. The last month to have below-normal temperatures was July 2023 (69.4°F - 1.1°F colder than normal).
- The average high temperature was 56.7°F. This was 1.4°F warmer than the 1991-2020 normal of 55.3°F.
- The average low temperature was 36.9°F. This was 1.8°F warmer than the 1991-2020 normal of 35.1°F.
- The warmest temperature was 80°F on April 13 and the coldest temperature was 27°F on April 21.
|
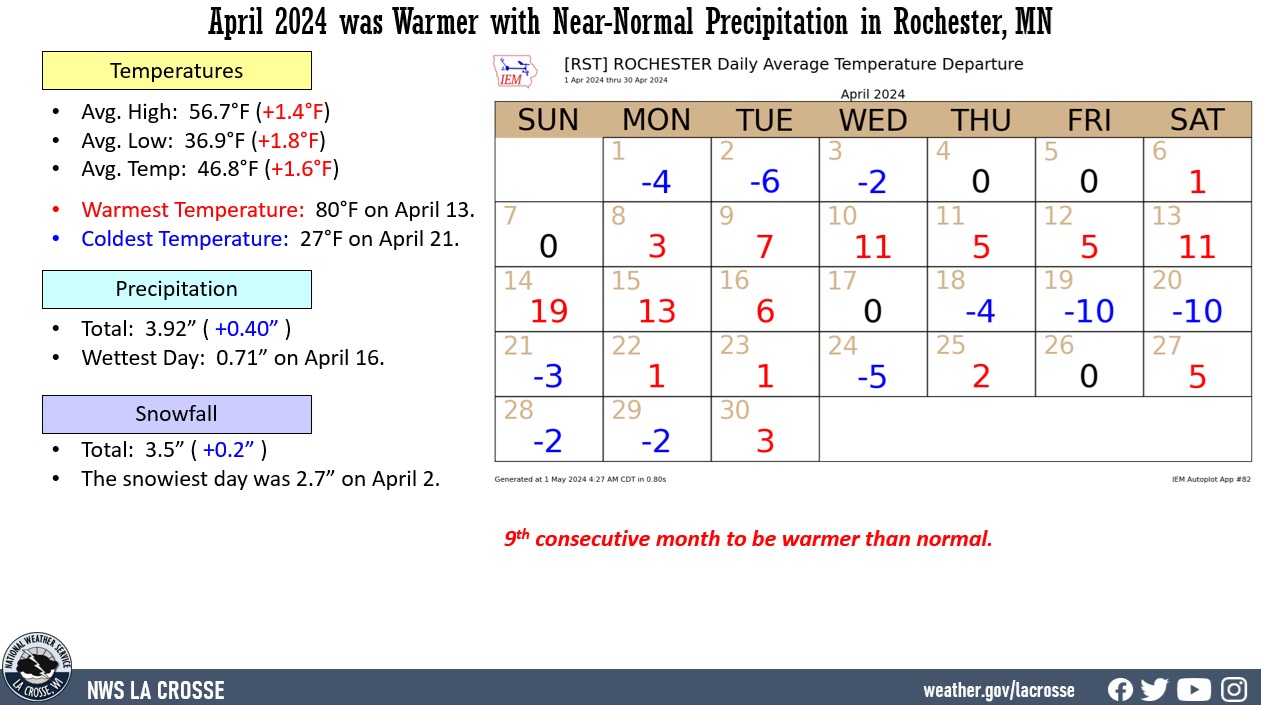 |
​Precipitation - Slightly Wetter than Normal
- A total of 3.92" of precipitation fell. This was 0.40" wetter than the 1991-2020 normal of 3.52".
- The wettest day was on April 16 when 0.71" fell.
- Measurable precipitation fell on 14 days (46.7%) and a trace of precipitation fell on another 2 days (6.7%).
Snowfall - Slightly Above Normal
- The official NWS snowfall observer near Rochester International Airport measured 3.5" of snow. This was 0.2" snowier than the 1991-2020 normal of 3.3".
- This was only the second month in the 2023-24 snow season to be snowier than normal. The other month to be snowier than normal was October (1.6" - 0.7" snowier than the 1991-2020 normal of 0.9").
- The snowiest day was 2.7" on April 2.
- Measurable snow fell on 3 days (10%) and a trace of snow fell on another 3 days (10%).
...Records...
...Looking Ahead to May...
- The normal high temperature in Rochester rises from 62°F on May 1st to 74°F by the end of the month. The normal low temperature rises from 41°F on the 1st to 53°F by the end of the month. The normal mean temperature for the month is 57.6°F. Rochester’s warmest May occurred in 1934 with an average temperature of 66.2°F, and their coldest May occurred in 1888 with an average of only 49.6°F.
- During May, the hottest temperature was 106°F on May 31, 1934, and the coldest temperature was 21°F on May 3 in 1910, and 1967. Normally, there is only 1 day with temperatures at or above 90°F.
- The average precipitation for May is 4.35". The wettest May occurred in 2013 with 12.26" of precipitation. While the driest was in 1934 with 0.40". The wettest May day was 4.02" on May 17, 2000.
- Normally, there are 5 days with thunderstorms.


 Weather Story
 Weather Map
 Local Radar