Gaylord, MI
Weather Forecast Office

 |
 |
 |
 |
|
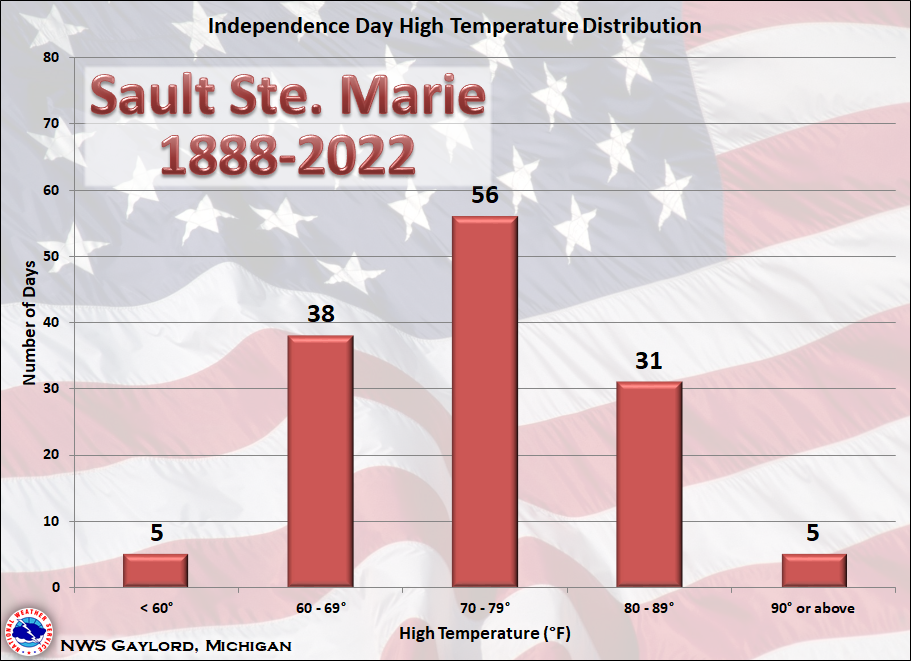
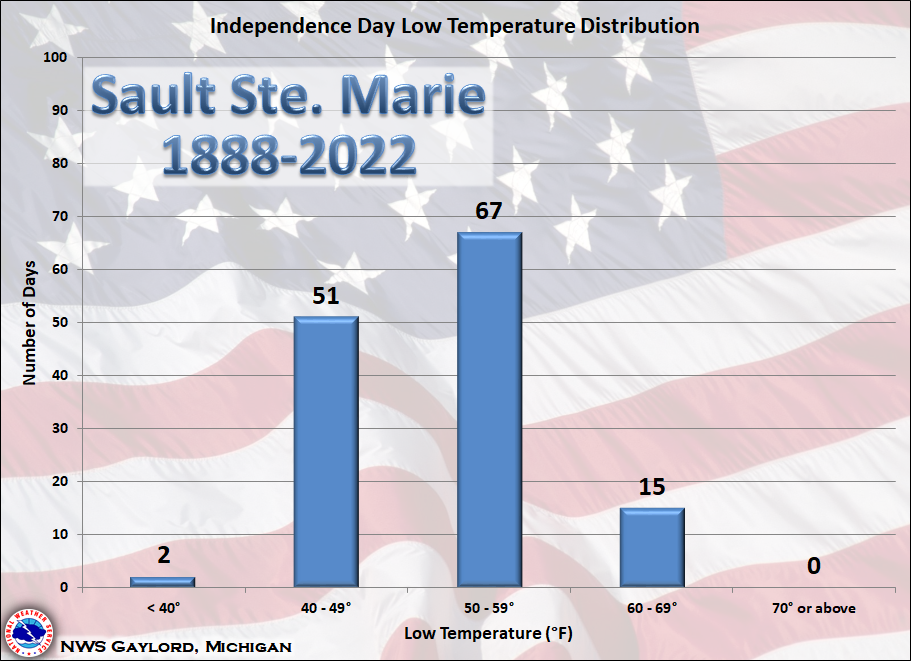
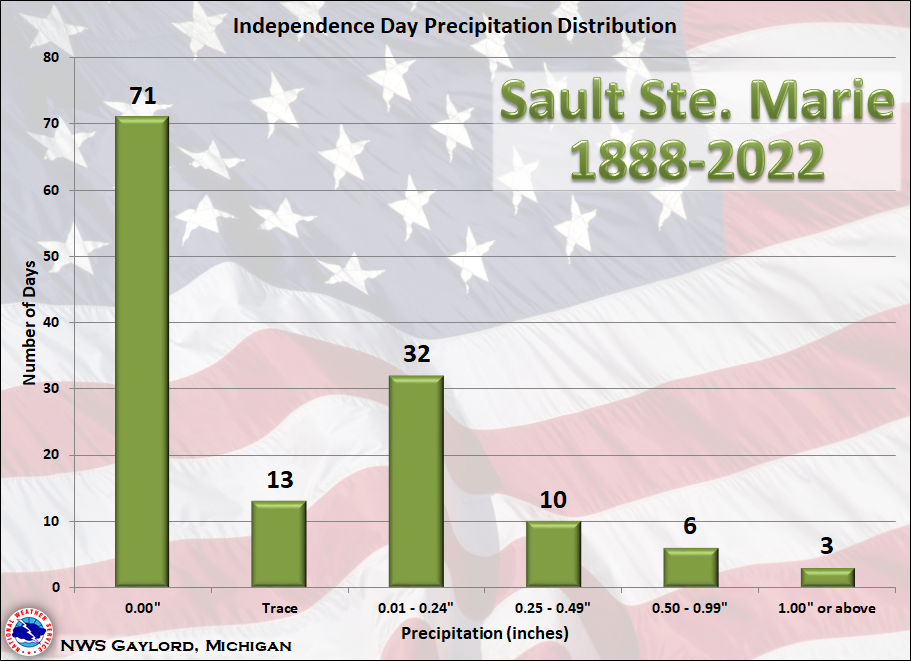
Here is a look at some Independence Day weather statistics for Sault Ste. Marie, with data going back to 1888. As can be seen in the data below, there has been a wide spectrum of temperatures and rainfall on Independence Day in Sault Ste. Marie, but highs have generally been in the 70s and lows in the 50s. It is also not uncommon for Sault Ste. Marie to see some rain on Independence Day. |
Local Information
Area Information
Office Webcam
Forecast
Recreational
Great Lakes/Marine
NWS DSS Table
Beach/Surf
Text Products
US Dept of Commerce
National Oceanic and Atmospheric Administration
National Weather Service
Gaylord, MI
8800 Passenheim Road
Gaylord, MI 49735-9454
989-731-3384
Comments? Questions? Please Contact Us.