A storm system is bringing strong winds and heavy mountain snow to the Cascades into the Northern Rockies. Santa Ana winds and dry conditions will support elevated to critical fire weather over coastal portions of California. Snow, strong winds, blizzard conditions, and high seas are impacting Southwestern Alaska. A Tropical Storm Watch is in effect for the Florida Keys from Tropical Storm Rafael. Read More >
What is the Pacific-North American Pattern (PNA)?
PNA (Positive Phase) Loading Patterns By Season
What is the Pacific-North American Pattern (PNA)?
- The Pacific/ North American teleconnection Pattern (PNA) is one of the most prominent modes of low-frequency variability in the Northern Hemisphere extra-tropics.
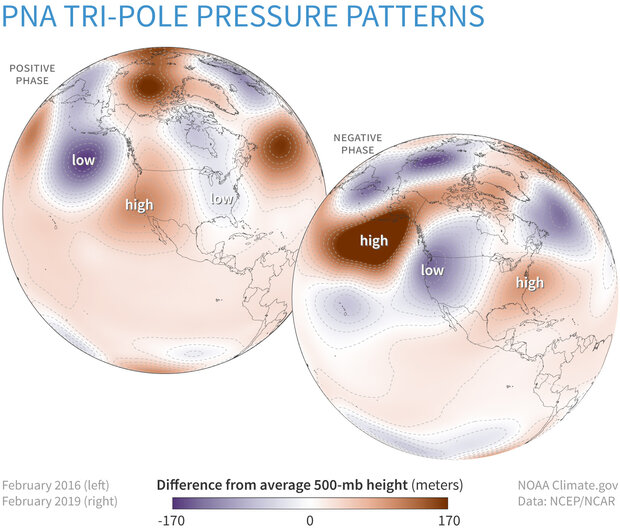
- The PNA is essentially a "pressure quartet," meaning it is derived from pressure patterns over the North Pacific Ocean and the continent of North America.
- The "pressure quartets" are: 1) Aleutian Islands, 2) Subtropical Pacific (near Hawaii), 3) Western Canada (Canadian Rockies) and 4) Southeastern CONUS.
- A good analogy of the PNA is: “Some people like to sleep on their backs. Some people prefer to sleep on their stomachs or on their sides. Some people don’t sleep much at all! There are certain states we gravitate to when we sleep, often to maximize comfort. They are our preferred states. Would you be surprised if I were to tell you the atmospheric circulation operates in the same way, that certain patterns or flows appear more often than others because we’re not the only ones who like routine? One of these preferred states is the Pacific-North American Pattern, or as we scientists like to shorthand it: The Almighty P-N-A!” (climate.gov)
- The PNA can play a role in temperature and precipitation patterns across Alaska.
- There are two phases of the PNA: Positive (+PNA) and Negative (-PNA)
- The PNA has the strongest influence in Northern Hemispheric Winter.
Click here to return to the top
Click here to return to the top
PNA (Positive Phase) Loading Patterns By Season

The loading patterns for January, April, July, and October, are displayed so that the plotted value at each grid point represents the temporal correlation between the monthly standardized height anomalies at that point and the teleconnection pattern time series valid for the specified month.
NOTE: The signal is strongest in winter and weakest in summer. This is visualized by the magnitude of the troughs and ridges in these loading patterns. The deepest troughs and strongest ridges are shown in the January loading pattern, while the weakest troughs and ridges are shown in the July loading pattern.
Click here for the methodology used to calculate the daily PNA Index
Click here to return to the top
How Does the PNA Affect Alaska Weather?
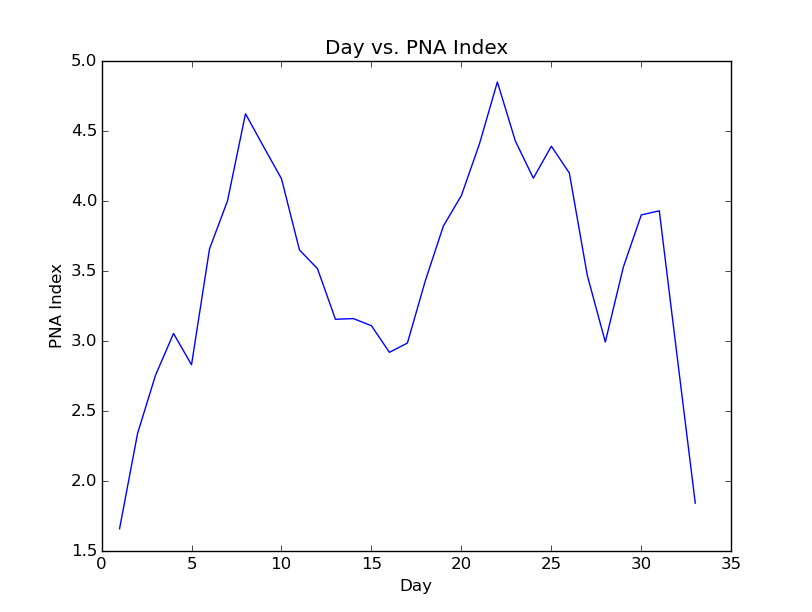
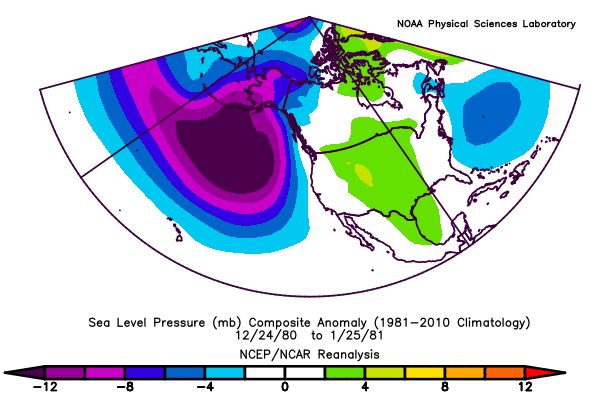
Positive PNA Regime: December 24th, 1980 - January 25th, 1981 (33 Days)
Day vs. PNA Index 500mb Geopotential Height Anomaly
.png)
2-Meter Temperature Anomaly Precipitation Anomaly
.png)
.png)
MSLP Anomaly
Click Here to return to the top
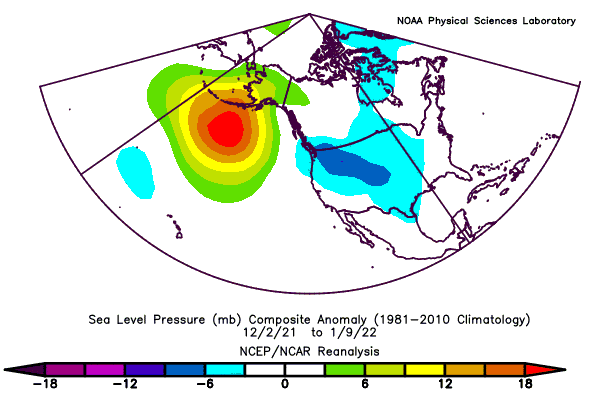
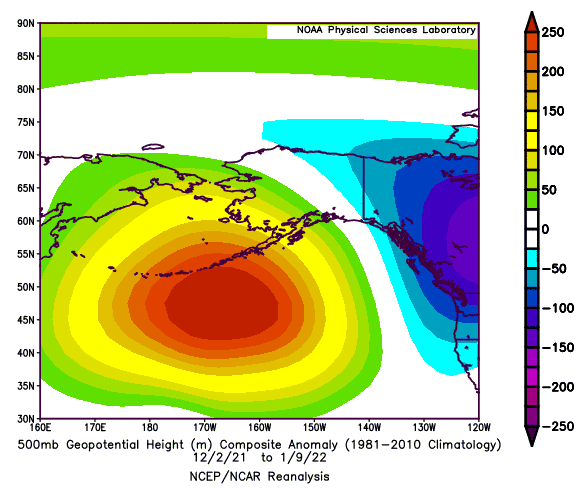
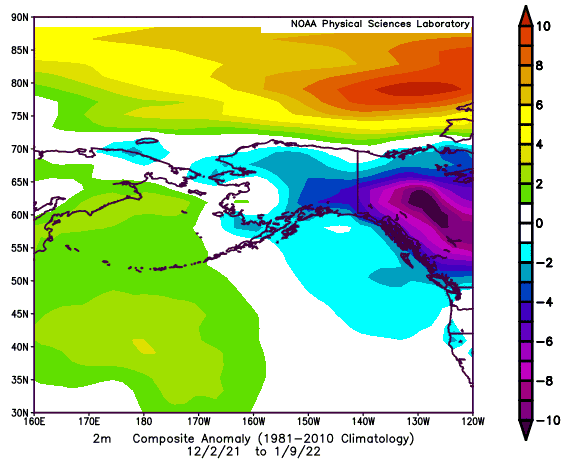
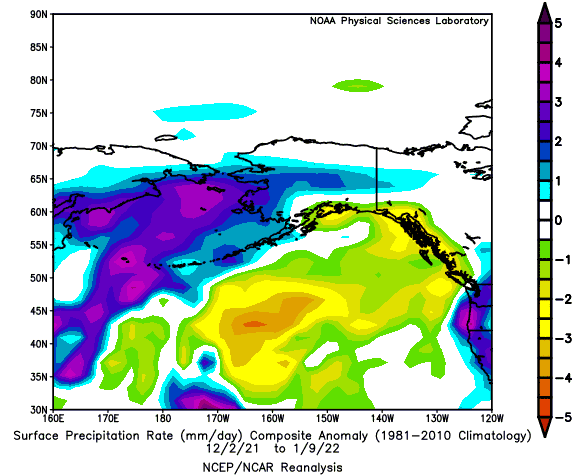
Negative PNA Regime: December 2nd, 2021 - January 9th, 2022 (39 Days)
Day vs. PNA Index 500mb Geopotential Height Anomaly

2-Meter Temperature Anomaly Precipitation Anomaly
MSLP Anomaly
