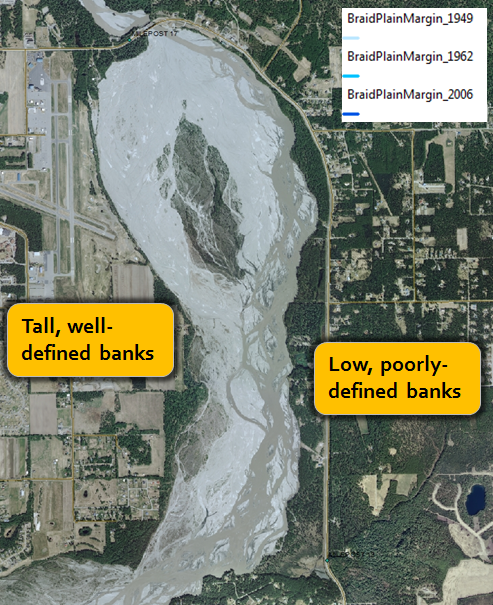
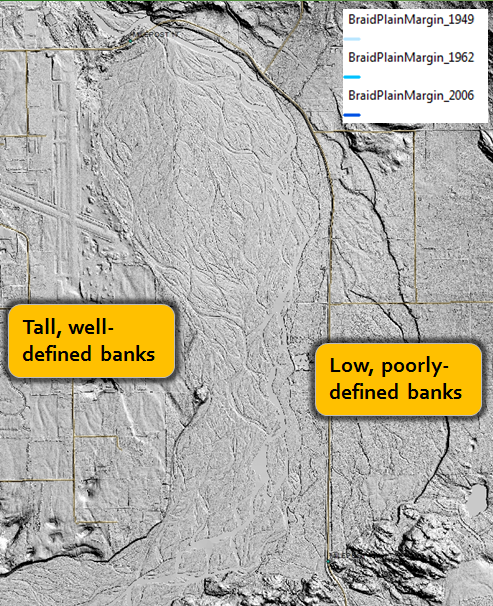
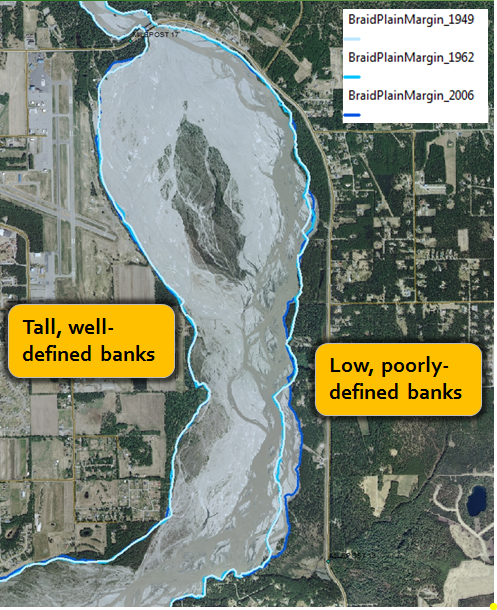
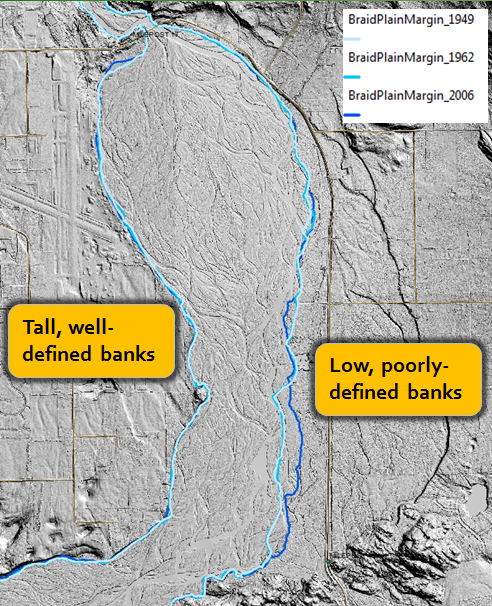
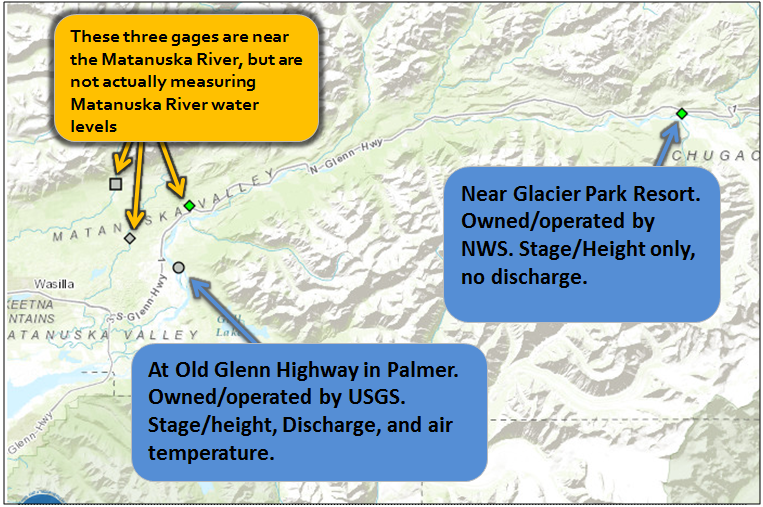
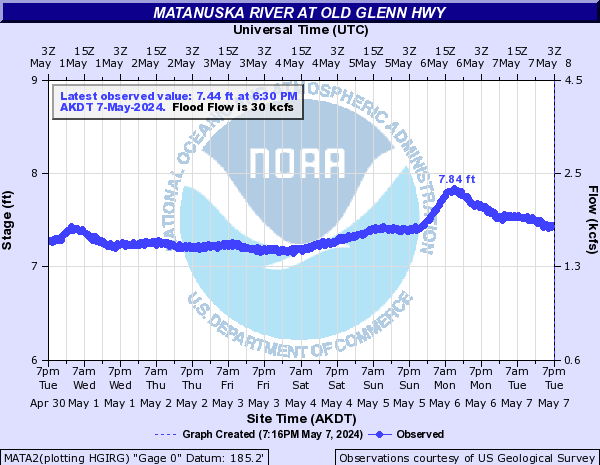
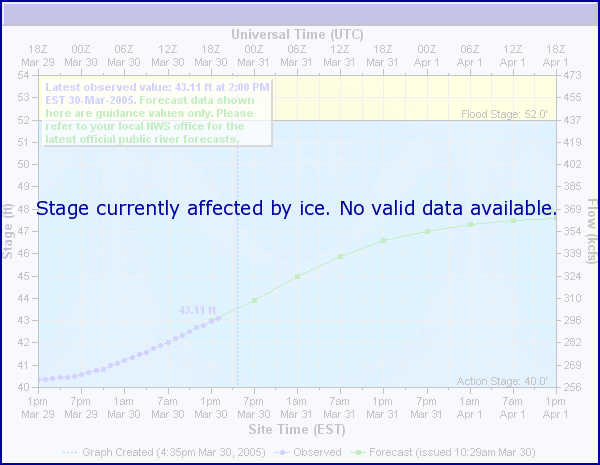
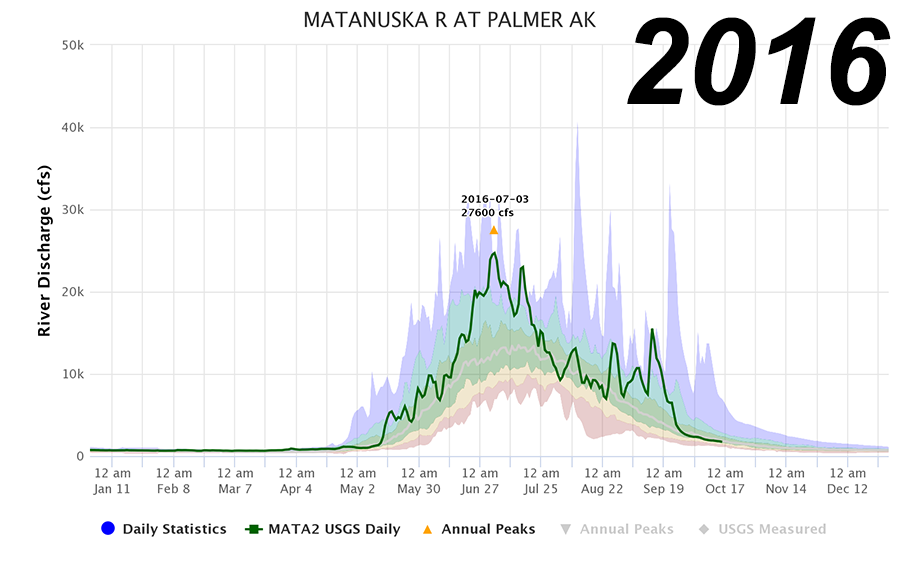
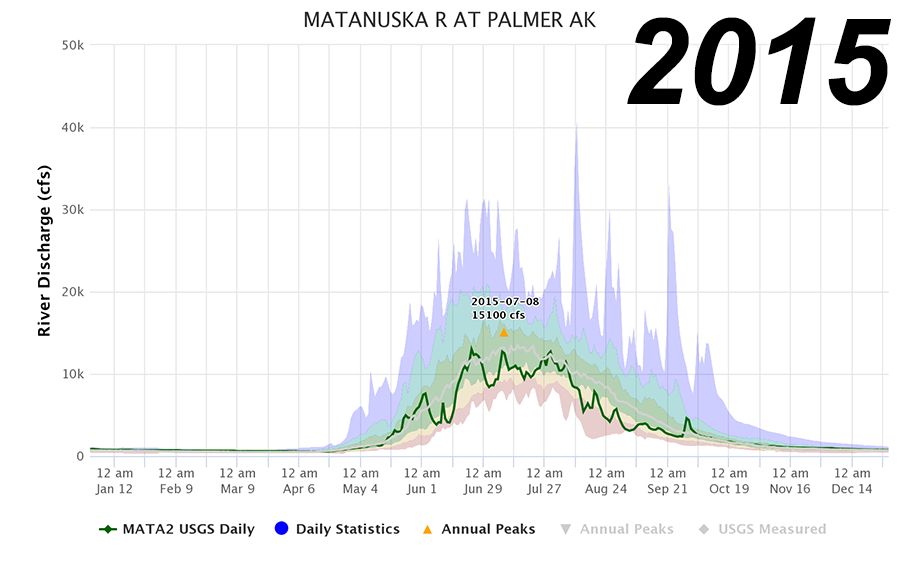
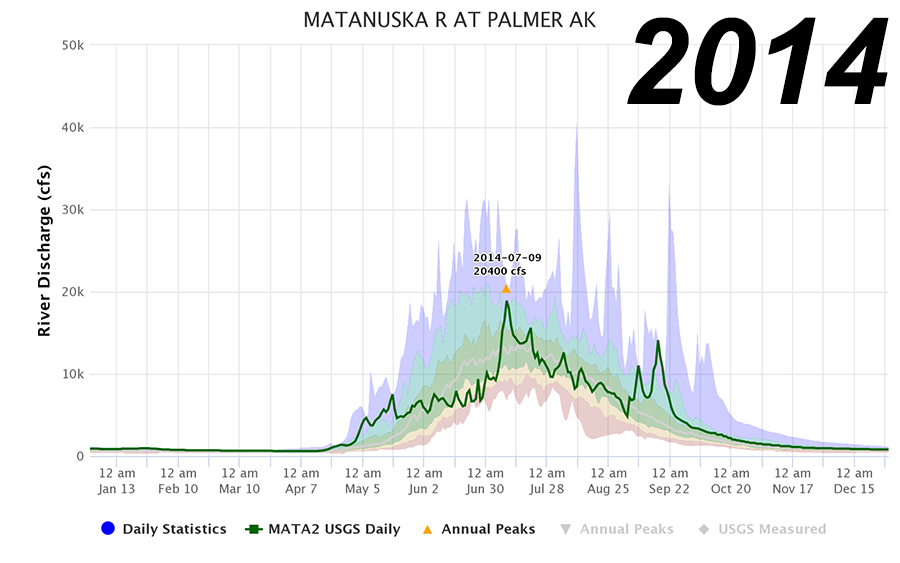
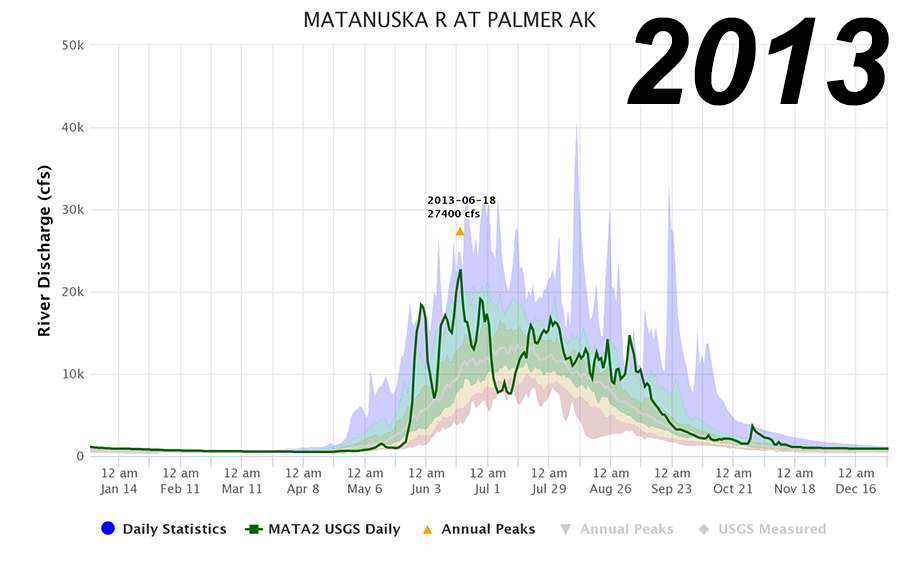
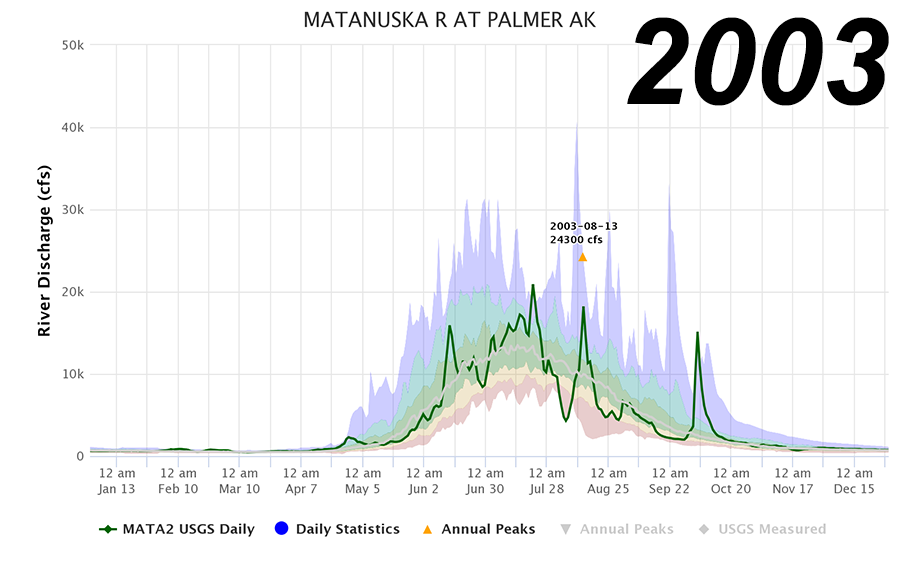
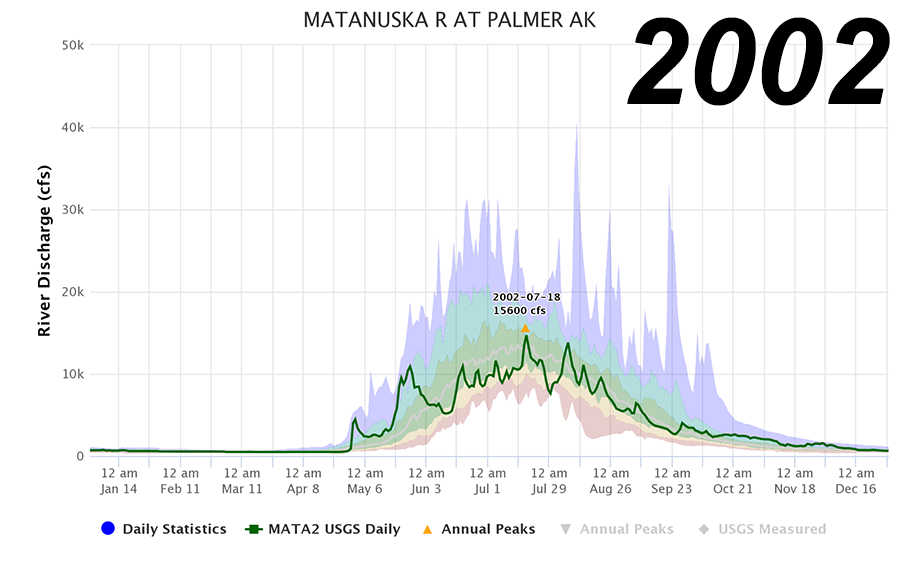
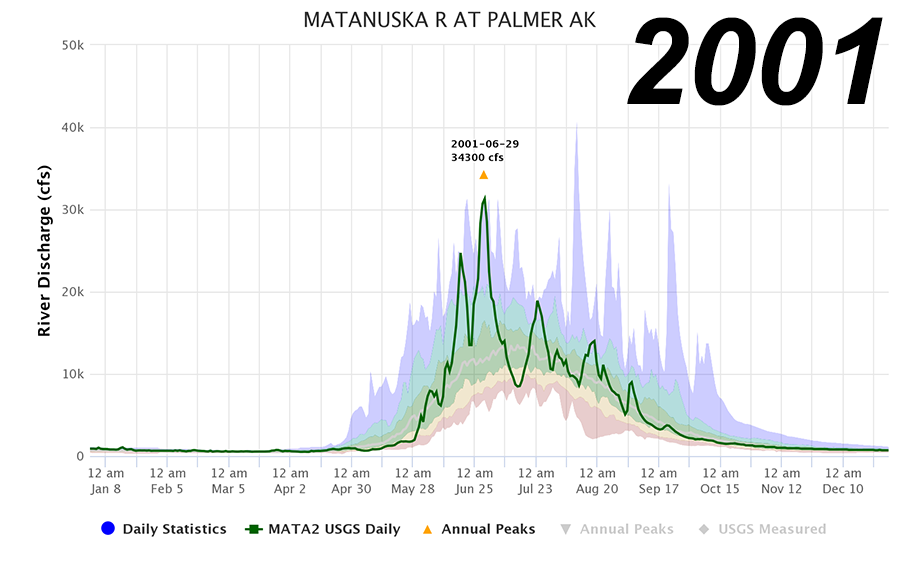
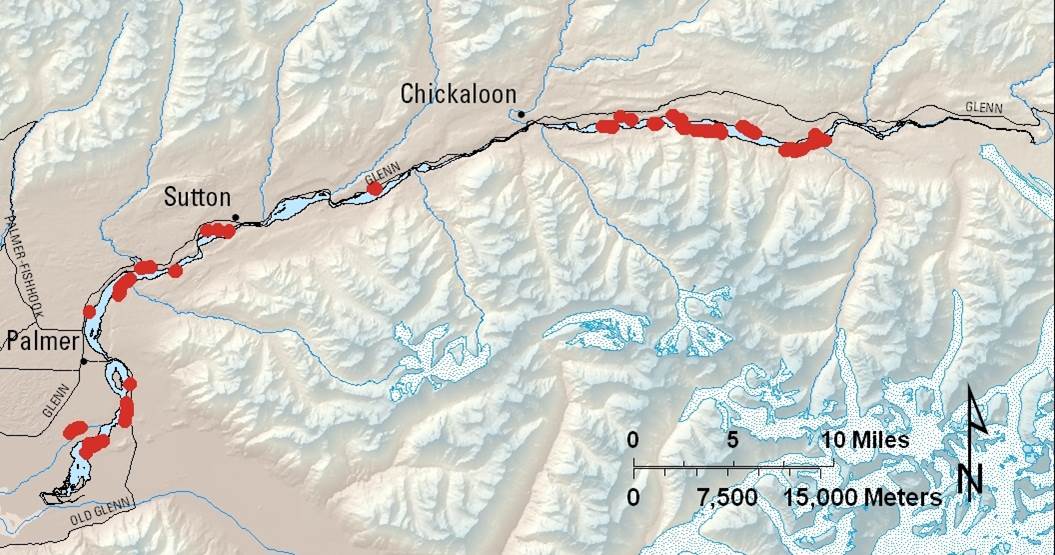
Introduction These impacts and thresholds, including Flood Stage thresholds, are meant to be a mostly static/unchanging indicator of known impacts along the river. However, there are many factors at play on the Matanuska River that work together to paint a picture of a river that is constantly, and at times rapidly, changing in numerous and significant ways. Because the impacts along the Matanuska River change so much in both space and time, we must speak in generalities when identifying the impacts at any individual water level. This is because we know that specific impacts at individual locations along the river often differ significantly from the general impacts displayed by the NWS. Why does this page exist? Looking for more information about the flood threshold changes happening in the Spring of 2017? The majority of the images and content on these pages courtesy of the following sources: Curran, J.H., McTeague, M.L., 2011, Geomorphology and Bank Erosion of the Matanuska River, Southcentral Alaska: U.S. Geological Survey Scientific Investigations Report 2011-5214, 64 p. (Also available at https://pubs.usgs.gov/sir/2011/5214/pdf/sir20115214.pdf.) Schuman, M., 2006, Matanuska River Watershed Plan: U.S. Department of Agriculture, Natural Resources Conservation Service Palmer Field Office, 34 p. (Also available at https://efotg.sc.egov.usda.gov/references/public/AK/MatanuskaWatershedPlan.pdf.) Mat-Su Borough and Missal, LLC, 2010, Matanuska River Management Plan, 97 p. (Also available at http://www.matsugov.us/plans?task=download&collection=plan_documents&xi=0&file=plan_document_upload&id=14095.) National Weather Service, Advanced Hydrologic Prediction Service, http://water.weather.gov/ahps/region.php?state=ak The Matanuska River is a large and dynamic river that flows more than 80 miles from the mountainous region bordering the southwestern Copper River Basin through the Matanuska Valley and into the Knik River and Knik Arm of Cook Inlet. In recent years, the area surrounding the lower portions of the river has seen the fastest population growth anywhere in Alaska. ​There are only two active river gages along the more than 80 mile length of the Matanuska River. The map below shows the locations of these two river gages. The Matanuska River has been monitored by the USGS at the Old Glenn Highway bridge for more than 60 years, though significant gaps in the historical record exist particularly during the 1970s-1990s. The river has been monitored continuously at this location since 2000. Currently, the gage reports stage (water level), discharge (amount of water flowing through the river), air temperature, and water temperature. Upstream, near Glacier Park Resort, the NWS has maintained a once-daily river gage since the early 1980s, and in 2005 installed equipment to enable an around-the-clock hourly observation of water levels. Stage (water level) is the only thing reported from this station. Here are the current hydrographs (water level charts) along the river. *NOTE* Both of these gages are significantly affected by the presence of river ice during the cold season, and routinely will not report data due to complete ice coverage over the river. Explanation of NWS AHPS river gage pages The National Weather Service (NWS) Advanced Hydrologic Prediction System (AHPS) has a dedicated page for each river gage. Click the hydrographs above to be taken to the corresponding AHPS page for each site. Another option is to go to the USGS page for the gage on the lower river. Or, keep reading for more explanation of the different sections of an AHPS river gage page. -Click to enlarge- -Click to enlarge- Water in the Matanuska River comes from a variety of sources - glaciers, freshwater tributary streams, rainfall, and groundwater. The river’s annual hydrograph (the long-term average flows throughout the year) is that of a standard Alaskan glacier-fed river. The river’s flow gradually declines during the fall and winter months, and then sees a sudden surge in April and May as the snowpack runoff ramps into high gear. This is followed by a slow increase through mid-July as low-elevation snowmelt diminishes, but is more than made-up for by increased glacial meltwater-runoff and high-elevation snowmelt. After starting to drop in the late summer/early fall period, the flow can come up again during the typical fall rainy season during particularly wet periods, but this final seasonal rise is not as consistent from year-to-year as the first two features mentioned above. In addition to season-to-season and year-to-year variations, the Matanuska River also exhibits diurnal/daily flow rate fluctuations, due to the changes in glacier and snow melt (especially at higher elevations) between day and night. In winter, most of the river becomes ice-covered, though water flows year-round under the ice, primarily as a result of groundwater flow. Here's a picture of the entire Matanuska River drainage basin, as indicated by the red lines. All rain (or snow) that falls in this area (that doesn't get absorbed by the ground or used in some other way such as in plant processes) will eventually drain into the Matanuska River. Here is a graph of some flow/discharge daily statistics (these are for daily mean/average flow, not instantaneous values) as compiled by the USGS for the gaging site in Palmer (site ID: MATA2). A legend to aid interpretation is under the graphic: -Click to enlarge- Previous Hydrographs (2001-2016) Here are the annual hydrographs showing daily mean/average flow values for each year from 2000 to 2016, overlaid on top of the annual statistics graphic above. The highest instantaneous flow value for that calendar year is also included and shown as a yellow triangle, as well as the date on which it occurred. This instantaneous peak will always be at least slightly higher than the corresponding daily mean value. Click the thumbnails to enlarge. Images courtesy of: USGS -Click to enlarge- -Click to enlarge- Many Alaskan rivers carry significant loads of sediment, both suspended in the water (silt) as well as bounced/moved along the bottom of the riverbed (gravel), and the Matanuska River is certainly no exception. While the Matanuska Glacier contributes a huge amount of suspended sediment to the river (glacial silt in the water), it does not appear to be a significant contributor of larger gravel-sized sediments. Rather, the large alluvial fans (fan-shaped deposits of river-bed sediment) from the many tributary streams along the length of the river appear to contribute the vast majority of gravels to the river system. Multiple studies have estimated the average amount of this "bedload" yield in the lower portions of the Matanuska River at 397,000 tons or 267,000 cubic yards per year. That's enough to fill 26,700 average commercial dump trucks! This huge transport of gravel/bedload is directly linked to the sometimes rapid and substantial shifting around of the active channel within the larger braid plain. More on this in the "Geomorphology" tab of this page. 2017 Changes, and the challenge of establishing flooding thresholds Trying to pinpoint impacts at specific reported water levels is made ever more difficult by the fact that the huge amount of gravel being perpetually carried/moved around within the river channel causes the elevation of the bottom of the river to be constantly, and often significantly, changing both 1) from place to place, and also 2) at a single point over time. In hydrology, this is known as an "unstable bed", and it results in constant changes in the fundamental relationship between stage (water level) and discharge (how much water is actually flowing through the river). In addition, the natural constriction of the river east of Palmer (at the Old Glenn Highway Bridge, the location of the USGS gage) is one of the narrowest constrictions anywhere along the river. This adds to the challenge of trying to extrapolate impacts at other sections of the river based on what is going on at the site of the gage. To best serve the public interest, starting in Spring 2017, the NWS, in coordination with the Mat-Su Borough Department of Emergency Services, plans to link flood thresholds at the USGS gage east of Palmer (Old Glenn Highway bridge) to the reported discharge (amount of water flowing through the river). This is a change from previous years, when it was linked to the stage (water level). Stage information will still be displayed on the hydrograph, like it has in years past. As noted above, considering the variability of the elevation of the riverbed from month-to-month and year-to-year, it is extremely difficult to determine an appropriate and representative flood threshold for the lower river that would remain relevant throughout these constant and natural changes in the river system. A discharge-based flood threshold will be more representative of truly unusual flood events that are affecting the broader portions of the river. Additionally, as additional location-specific impacts are discovered for various water levels, notes will be added to the NWS AHPS page for the USGS site near Palmer (A guide for interpreting the different sections of an AHPS page can be found on the "River Gages" tab above). Here are sample "before-and-after" hydrographs that show the changes that will take effect beginning in the spring of 2017. The first image is how things looked when the flood thresholds were based on stage/water level height, and the second image shows how it will look based on discharge/flow through the river. NOTE: The reported data on these hydrographs is NOT CURRENT, and is used for illustration purposes only. The right axis and left axis values should not be compared in these examples. -Click to enlarge- -Click to enlarge- All users are encouraged to convey reports of flooding to local officials (Mat-Su Borough Emergency Services: 907-861-8004) or the National Weather Service (907-266-5105) or submit a flooding report online here. Widespread flooding along the river corridor is fairly rare, owing in large part to the very wide river channel available at most of the populated areas along the river. This allows the river to spread out horizontally within the river channel before flowing over the riverbank. Recent widespread flood events are limited to the summer 1971 flood event when the Matanuska River breached the Old Glenn Highway and flooded low-lying areas in the Bodenburg Butte area near Ye Old River Road and east of the highway. This flood resulted from a regional rainstorm that also occurred at the same time as a one-time-only event on Granite Creek (a tributary stream from the Talkeetna Mountains) wherein a lake that had been formed by a landslide blocking the creek released suddenly and sent a huge pulse of water into the Matanuska River. This was far and away the highest flow/discharge ever recorded on the Matanuska River reaching a maximum of 82,100 cfs. The 1971 flood caused the Old Glenn Highway, the only road link out from Anchorage at the time, to wash out in four places near/east of Palmer. Further upstream, the road washed out at 4 additional locations: Moose Creek, Granite Creek, Eska Creek, and Kings River. Southcentral Alaska sustained $8 million to $10 million in damage from the floods of August 1971. Of that amount, roughly $6 million was directly from damage occurring in the Matanuska Valley. Ironically, during this event, geomorphic changes on the river were minimal, as the water returned to a “normal” path within banks once the event had ended. The more significant geomorphic changes along the river occur not from specific flooding events, but rather through the incremental channel migration and erosion process. A much smaller, but still significant, flood happened in the fall of 2012, when flows at the USGS in Palmer reached more than 38,000 CFS after another regional rainstorm. This led to overbank flooding in the Butte area, with flood waters inundating several homes west of the Old Glenn Highway. Localized flooding does occur more frequently along the Matanuska River, and is often more related to channel migration than to high flows. This occurs when shifting channels re-occupy old portions of the braid plain (The braid plain is defined as the area presently or formerly occupied by active channels of the river). Because of natural variability in braided channel migration, the river has been known to spend several decades or longer on the “other” side of the large braid plain. This allows vegetation and even trees to grow and mature in the inactive portions of the braid plain. When the river does eventually work its way back across the braid plain, it first floods and then erodes this new area of “forest” that has grown over the span of time since the river last flowed through the area. The good news is that this process describes changes within the historic braid plain itself, where there are very few developed properties. An additional type of localized flooding can occur as the river erodes through the riverbanks on the sides of the braid plain, thereby increasing the overall width of the braid plain. Occasionally when this happens, the river will encounter a low spot that had previously been protected by the bank. Once the bank is eroded, this area experiences a sustained flooding condition that persists until the river migrates somewhere else, or more likely, until the land fully erodes and any trees or houses in this localized low area are washed away. In recent years, this has been what has happened along the Old Glenn Highway in the Butte and near the Glenn Highway Milepost 64 in Sutton. Here's an image that shows an old (and now forested) portion within the braid plain experiencing flooding as the active channel has moved back into the area. Image courtesy of: USGS Bank erosion is a long-term reality on the Matanuska River. In addition to eroding as part of channel migration within the historic braid plain, the river also erodes the riverbank (which represents the boundaries of the braid plain). This results in the braid plain getting permanently wider. The dynamic nature of the braided Matanuska River and the resulting erosion at the edge of the braid plain is caused by natural physical processes common to streams having abundant sediment loads, steep slopes, and erodible banks. The glaciers and tributary fans of the Matanuska River basin supply large quantities of sediments ranging in size from silt and clay to boulders. As flow through this relatively steep river fluctuates, huge amounts of this gravel/sediment are moved around and down the river in multiple, frequently shifting channels. At the edge of the braid plain, bank erosion can occur when an active channel flows against an erodible bank. It is important to note that the NWS forecast, issued during the warm season months, is a forecast exclusively for stage (water surface elevation). The NWS does not forecast erosion. USGS studies have shown that erosion can happen at both low and high flows through the river. According to the U.S. Geological Survey (USGS), 64 percent of the total erosion to the braid plain margin between 1949-2006 occurred at 8 percent of the banks, so the river does not erode equally. The image below shows where erosion exceeded 230 ft between 1949 and 2006. Additional erosion has occurred at some locations since 2006. Image courtesy of: USGS -Click to enlarge- Erosion along the Matanuska River is only a significant problem where it affects human development. Development along the Matanuska River has occurred without much knowledge of or consideration to river channel migration. As a result, homes have been destroyed, agricultural land lost, and infrastructure damaged as the river has shifted back and forth across its plain. Although minor shifts occur constantly, major shifts in the suite of active channels can occur. For example, near Palmer in the early 1990s the main channel migrated to the left (east) bank of the river, resulting in loss of homes and land. Within the braid plain, the main channel can move back and forth quickly, or it can take decades for the main channel to cross from one side of the brain plain to the other. In some cases, this is enough elapsed time to allow forests to develop. When the main channel reoccupies part of the braid plain that has been dry for a long time, these forests can become inundated, or progressively eroded, or both, as seen in the following picture. Image courtesy of: USGS Here's an example of how the area along the river can be classified: Images courtesy of: USGS -Click to enlarge- -Click to enlarge- Geomorphology, and more specifically river morphology, refers to the study of the features of the surface of the earth and the associated change over time, especially as they relate to underlying geological features. Some of the key features of the Matanuska River are: These are some of the main factors that result in much of the Matanuska River being characterized as a “braided” river...which means there are multiple small channels that frequently migrate from side to side. The broader area that encompasses the general side-to-side movement of the multiple river braids is called the braid plain. As described by the USGS: The braid plain consists of areas occupied by the Matanuska River presently or within the historical period (about 100 years). Fundamentally a broad, gravelly plain, it stretches hundreds to thousands of feet across the valley and contains active channels, bars, vegetated islands, and vegetated abandoned channels and bars. (Curran, 2011) Most of the Matanuska River consists of braided channels that migrate frequently, leaving abandoned channels and bars that revegetate until reworked once again. Sometimes these inactive portions of the braid plain will revegetate and develop into forest in the time it takes the channel to migrate back into the area and re-activate the old braid plain. However, it doesn’t always take long periods of time for the active channel to migrate across the braid plain. As far back as the 1930s the active channel of the Matanuska River was documented to shift significantly on a yearly scale, sometimes even shifting from one side of the braid plain to the opposite side from one year to the next. Over the past 150 years, surfaces in the braid plain have been stable on average for only a few decades before being re-occupied by the river. Although this cannot be used to predict future locations and movements of the active channel of the river at a particular location, it does help give a general idea of how long an inactive location within the braid plain could expect to stay high and dry. In addition to the migration of the active channels back and forth along the braid plain, there is also a well-known and documented history of the Matanuska River eroding against the side of the braid plain (riverbanks) which essentially causes the braid plain to expand horizontally. Anywhere the riverbank is made up of bedrock, erosion is kept in check. Here are some examples: Images courtesy of: USGS -Click to enlarge- -Click to enlarge- -Click to enlarge- Additionally, numerous tributary fans, especially on the Chugach side, locally constrict the river and contribute sediment. For example: Images courtesy of: USGS -Click to enlarge- -Click to enlarge- At any point along the river, a diagram of these various features can be constructed. Here's a diagram of the typical features in the valley bottom of the braid plain, active channels, and historical bank location. Image courtesy of: USGS Another way to highlight the very active nature of the Matanuska River is to look at the distribution of vegetation within the braid plain. Water and unvegetated bars comprised 72 percent of the 2006 Matanuska River braid plain, vegetated braid plain bars covered about 25 percent, and vegetated islands occupied only about 3 percent. The rare occurrence of islands implies that a multitude of active channels migrate frequently across the braid plain and that vegetation does not appreciably limit channel movement. As of a 2006 study, the average age of vegetation on the braid plain was 15 years. The Matanuska River flood plain is unique in that much of the adult spawning and juvenile rearing habitat for salmon occurs in clear water side channels and probably many of the silty braids as well…although these clearwater side channels are the most likely spawning location. These channels are shallow, spring-fed or tributary-fed streams that flow across the braid plain and into the main channels of the Matanuska River. Side channel spawning areas are dynamic and susceptible to change depending on active river channel migration, so that in some years a spawning area may be obliterated and not active, only to return at some point after another shift by the active river channel. The Matanuska River braid plain provides spawning habitat for over 90% of chum and sockeye, and 45% of coho, within the larger drainage basin. Images courtesy of: USGS -Click to enlarge- -Click to enlarge- -Click to enlarge- For more information: Sutton is an unincorporated area of the Mat-Su borough between Milepost 52 and 72 of the Glenn Highway, on the north side of the Matanuska River. Like much of the rest of the river, the active channel here can and does shift rapidly across the braid plain. Over the past 10 years, near Glenn Highway milepost 63, more than 1000 ft of the traditional braid plain has been reoccupied by the river. In addition, in recent years, the river has also begun to erode through parts of the historic riverbank at the edges of the braid plain near Glenn Highway mileposts 64-65. According to a USGS study, erosion to the braid plain margin (riverbank) in Sutton did not begin until 2004. As an example, houses constructed by 1962 in this area were 1,500 ft from the active channel but less than 100 ft from braid plain margin. Images courtesy of: USGS -Click to enlarge- The images below show the same area of the Matanuska River near Sutton at four different years throughout the decades: 1949, 1962, 2006, and 2011-2012. While the quality of the imagery has, of course, improved throughout the years, it is still easy to observe that over the last 50 years the area of active river channels has steadily moved northward toward the highway and associated properties. What was once a clear-water side channel between milepost 64 and 65 is now the main (glacial) river channel, with active bank erosion now ongoing. Images courtesy of: USGS -Click to enlarge- -Click to enlarge- -Click to enlarge- -Click to enlarge- Google Earth Engine has compiled 32 years of annual satellite imagery showing changes over time. Click here to view the animation for the Sutton area since 1984. Butte, located east and south of Palmer, stretches along both sides of the Old Glenn Highway between mile 9 and 16, and had an estimated 2008 populated of 3,262 people. The prominent namesake Bodenburg Butte (545 foot glacial bedrock remnant outcropping) stands out in otherwise relatively flat terrain. Butte is primarily comprised of large lot, single family residences as well as agricultural development; with increasing residential development. Past Damages in Butte: “As the river approaches Palmer and the Bodenburg Butte, the stream gradient lessens and sediment is deposited, sometimes accumulating so rapidly that the water is abruptly forced to seek a new watercourse” (NRCS, 2006). This is because slower water velocities reduce the amount of sediment the water can transport, causing it to deposit some of the materials carried by the faster velocities upstream. In addition to this general deposition of gravel on the lower portions of the river, there are several areas along the river where hard points or bedrock restrict the river and cause a local acceleration of the water velocity. One such section is near the old Glenn Highway Bridge which is bounded by a narrow bedrock gorge at its upstream extent (where the USGS gage is located. This increased velocity allows the river to pick up and transport significantly more sediment/gravel than when it is traveling at a slower pace, and results in changes to the height of the riverbed near the USGS gaging site, which in turn affects the stage (height of the water surface). As the river exits this narrow section and the channel widens significantly, the water slows back down to “normal” levels and must deposit some of the extra gravel picked up from upstream near the bridge. This natural process results in a steady and significant movement of gravel into this area of the river. According to the NRCS, “Over the past few decades, this deposition has produced a large, elevated bar/island complex in the middle” of the river channel in this area. Through the 1980s the main channel was on the west or Palmer side of the braid plain in this area, and was causing erosion issues. Sometime in the 1990s the active channel abruptly shifted across to the far eastern or Butte side of the river channel, where it has also caused significant erosion to the river banks near Miles 12 to 15 of the Old Glenn Highway. As noted by the NRCS, “An additional medial bar/island complex has formed in the downstream reach of this area and has caused similar concerns in the vicinity of the wastewater treatment ponds and the Circle View Estates subdivision”. Below are two different images. The first is a satellite image showing the general layout and orientation of the area. The 2nd image is of the exact same area, but instead of satellite data the background image is one of High Resolution Topography gathered through a technique called Light Detection and Ranging (LiDAR). LiDAR helps visualize the extent of the historic braid plain, especially in forested areas that can ordinarily obscure this boundary. It also illuminates differences in elevation from one place to another. In this case, we see that the banks on the Palmer side of the river (below the Old Glenn Highway bridge) are more distinct...representing tall and well-defined riverbanks. On the Butte side of the river at this same spot along the river, it's a different story, as the riverbank is much harder to pick out. In fact, one notices what look like old river channels...which may have been part of the previously active braid plain more than 100 years ago. Images courtesy of: USGS -Click to enlarge- -Click to enlarge- Here are the identical images as seen above, except now they are marked up with the margins of the 1949, 1962, and 2006 braid plains. Images courtesy of: USGS -Click to enlarge- -Click to enlarge- Google Earth Engine has compiled 32 years of annual satellite imagery showing changes over time. Click here to view the animation for the Palmer/Butte area since 1984.
Introduction
River Gages
Hydrology
Flood History
Erosion
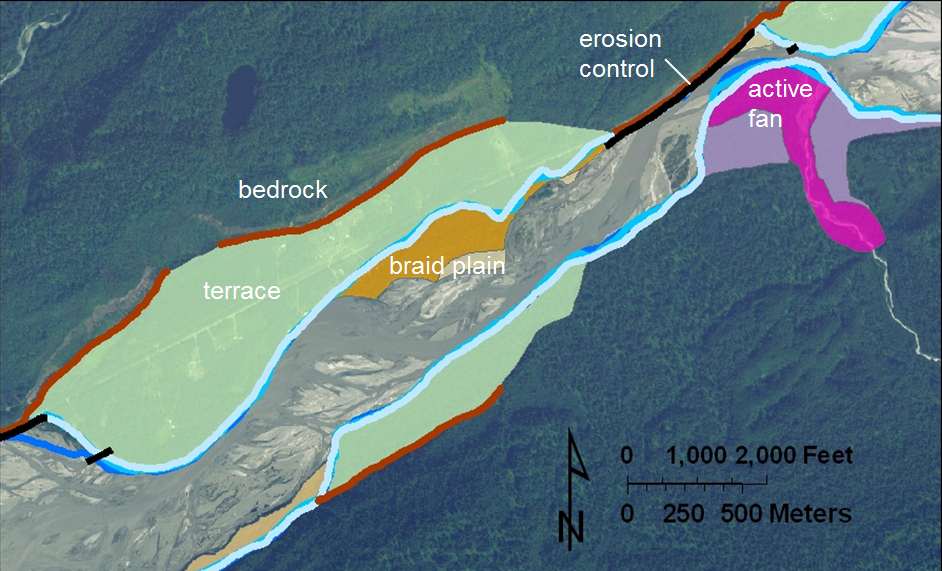
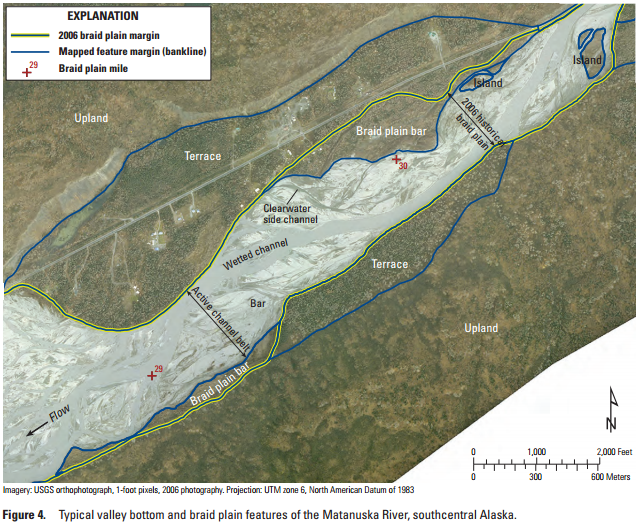
Geomorphology
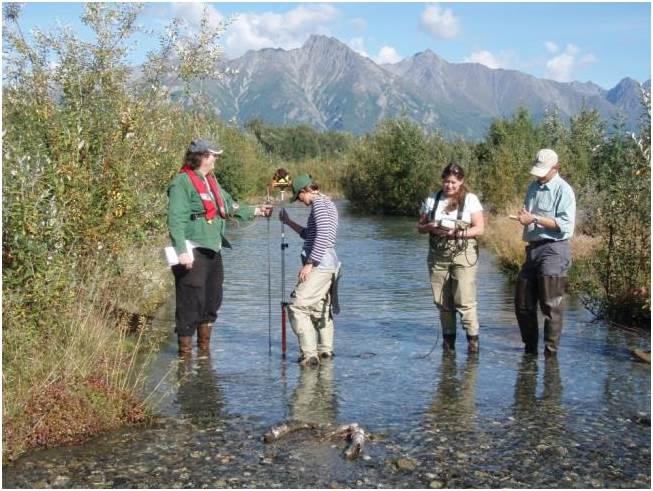
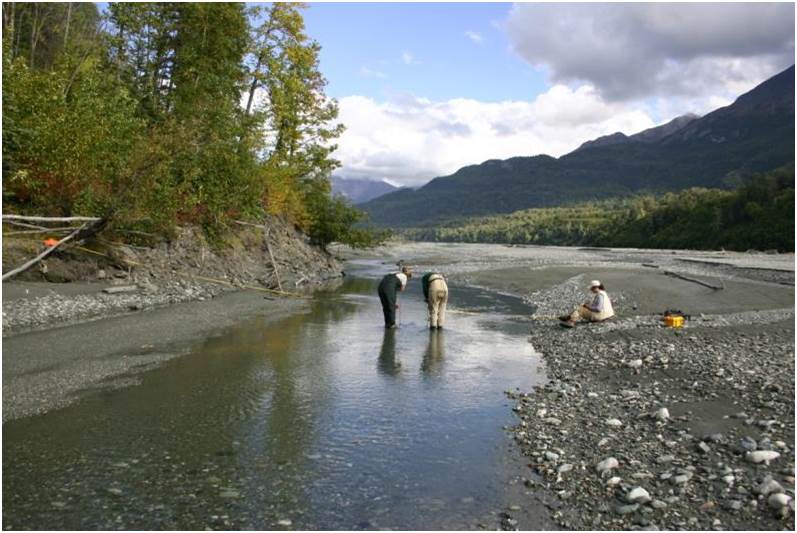
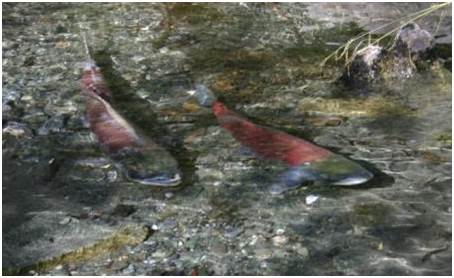
Salmon Habitat
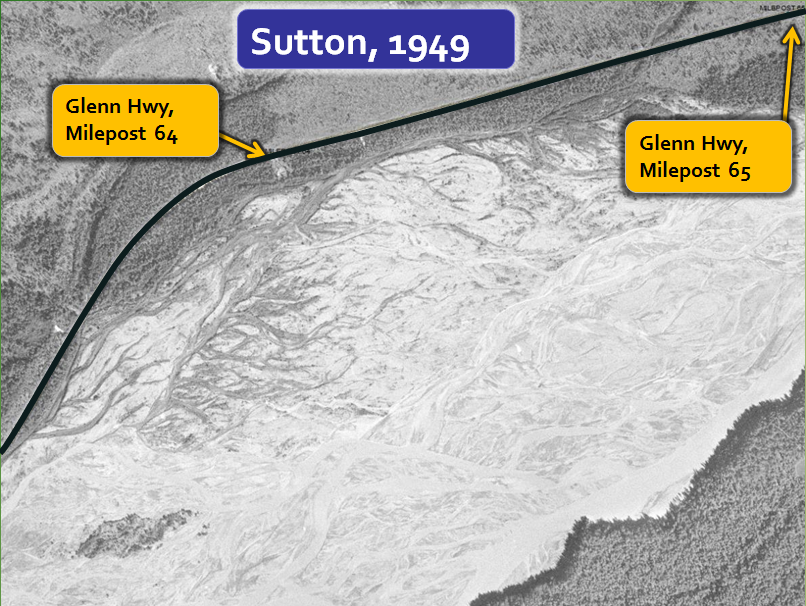
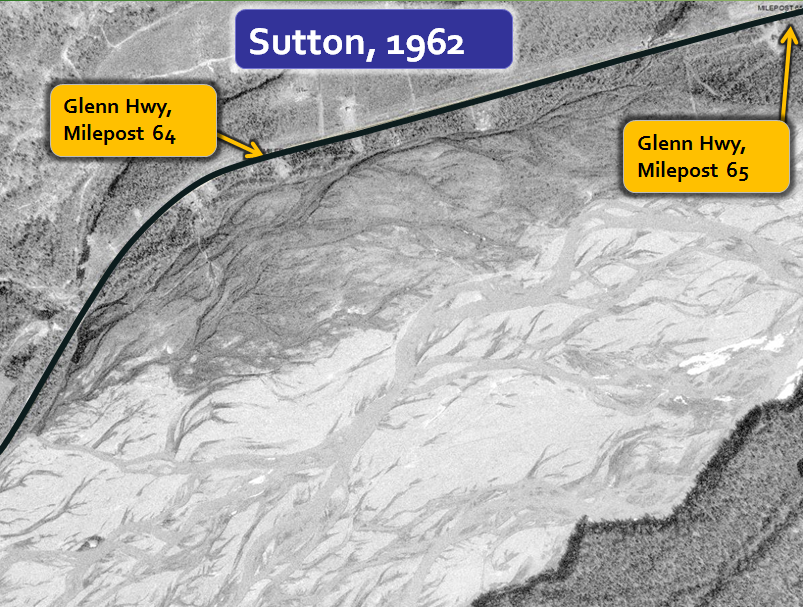
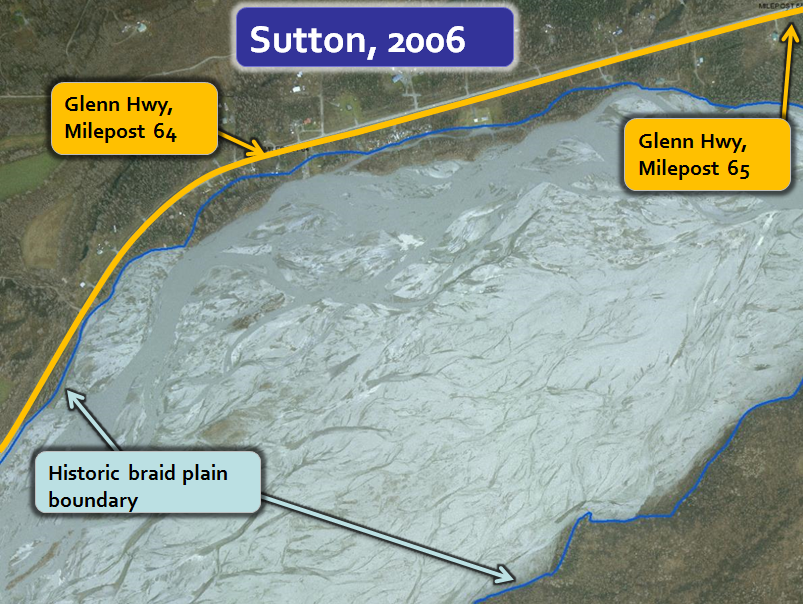
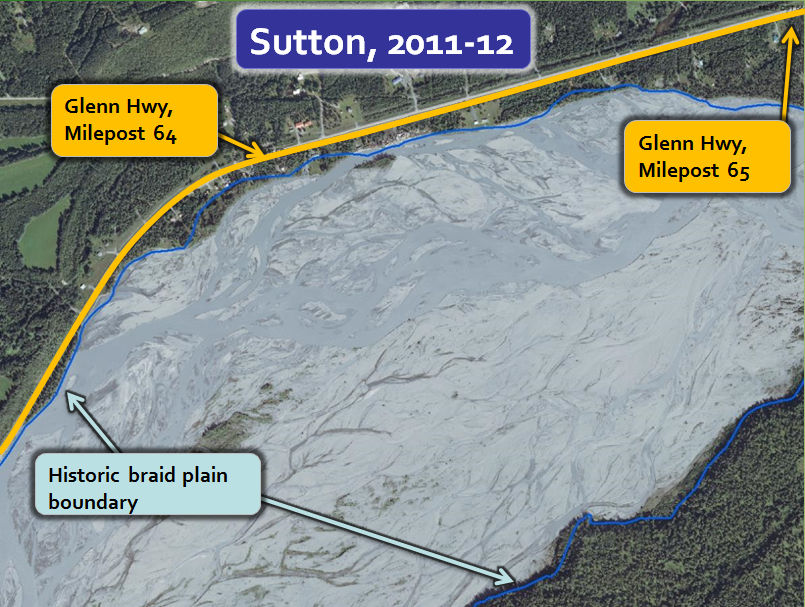
Sutton
Butte
The mission of the National Weather Service (NWS) is to provide forecasts and warnings for the protection of life and property and enhancement of the national economy. To that end, the NWS in Anchorage provides daily water level forecasts along the Matanuska River during the warm season, and also is responsible to set flooding thresholds and keep a catalog of known impacts along the river at specific water levels.
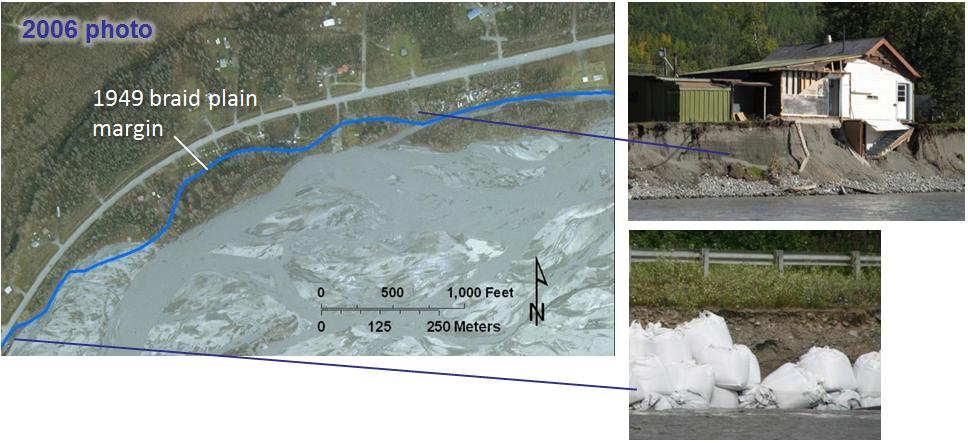
While there is a history of flooding along the river, the largest problem in recent decades has been significant bank erosion in some populated areas. Over the years, structures and acres of farmlands have been swallowed by typical summertime water levels eroding the riverbank. The purpose of this page is to provide a background overview of some of the key physical processes in play within the Matanuska River system, as well as provide information about water-level monitoring efforts and some specific erosion history at selected locations. It is hoped that readers will come away with a better understanding of the differences between classic over-bank flooding and localized flooding that results from bank erosion. Similarly, it will hopefully become clear why river stage (height of the water surface) as reported by the river gages are not a good indicator of erosion potential.
On the tabs above, click on the "Hydrology" tab. Then, click the "2017 Changes" link to be taken directly to that section.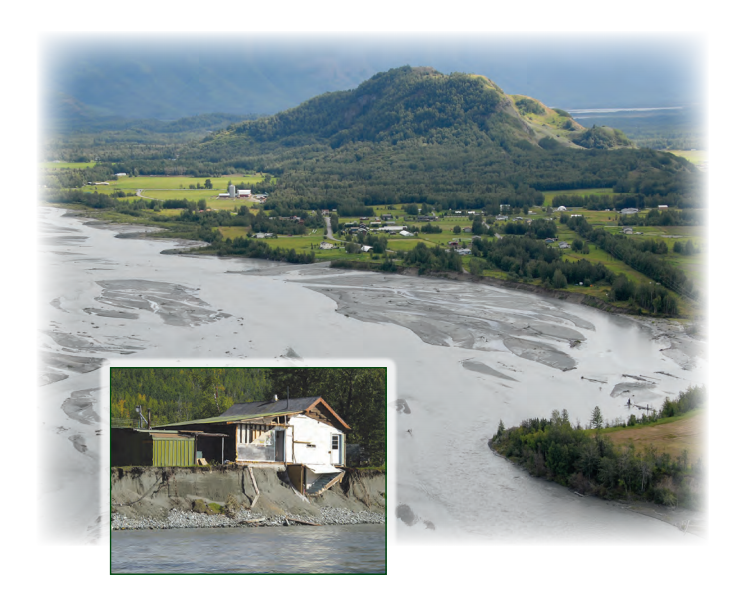
Image courtesy of: USGS
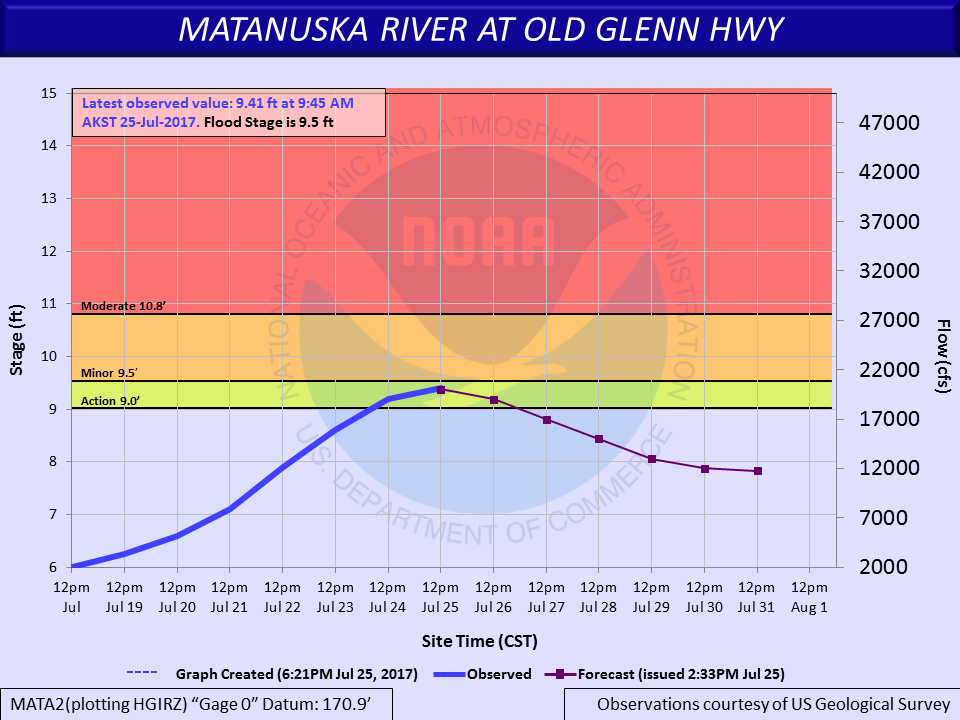
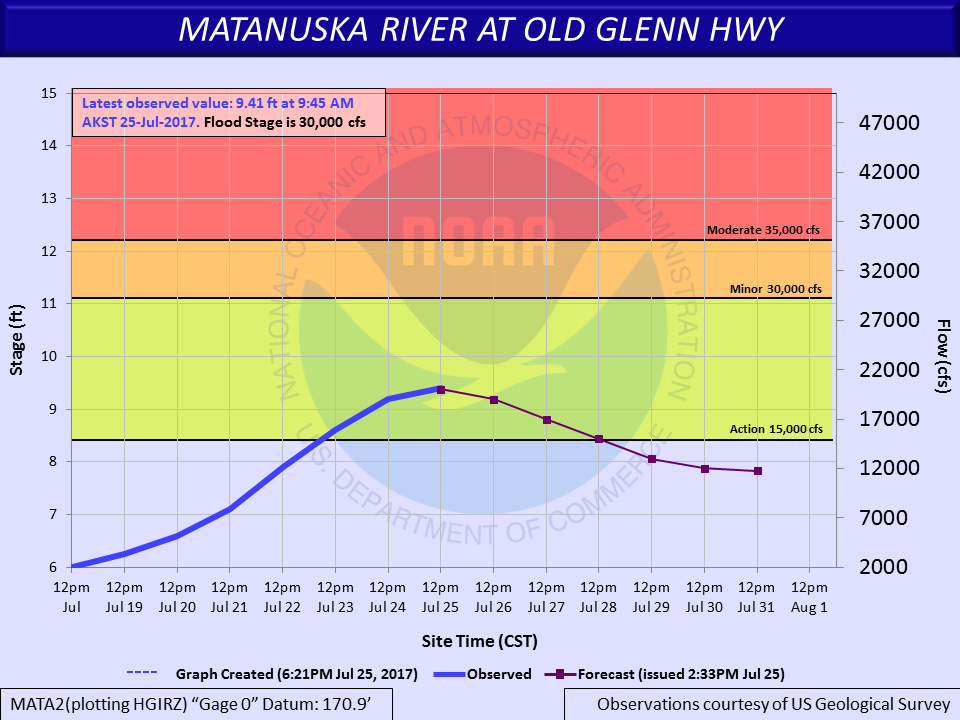
-Click to open AHPS page in a new window- -Click to open AHPS page in a new window-
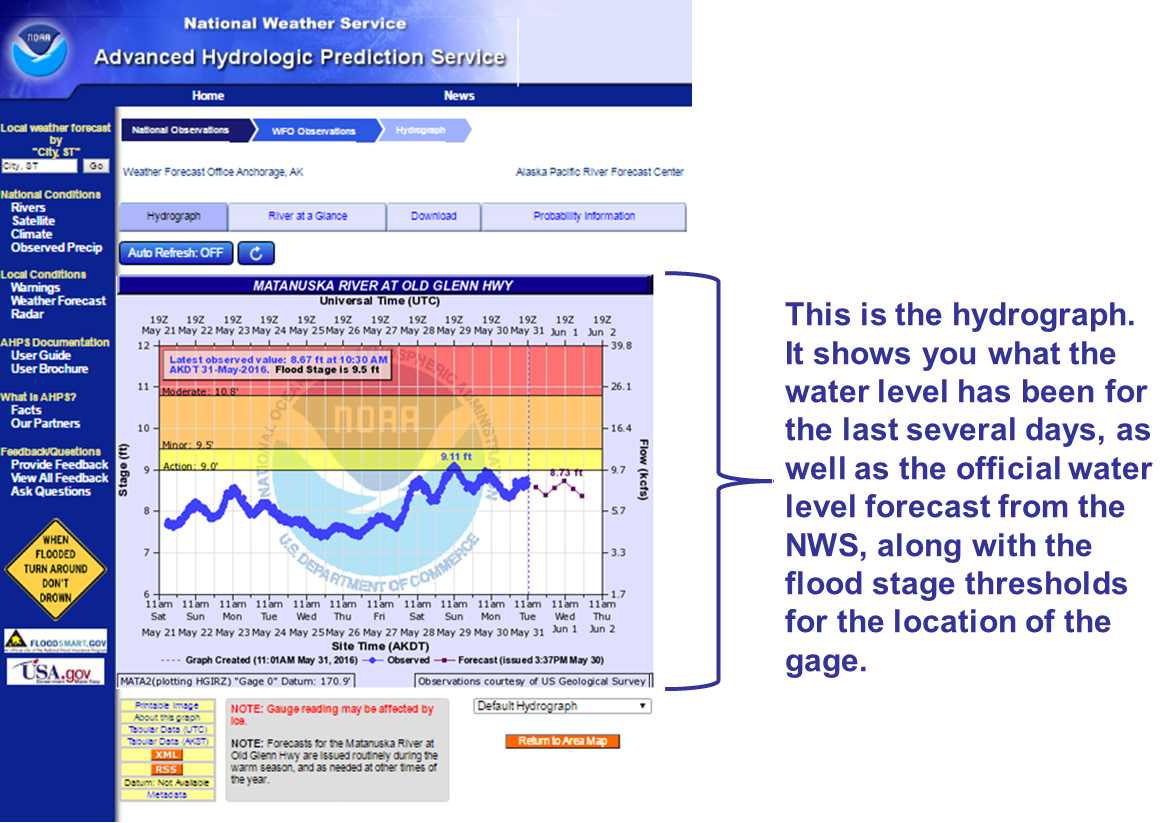
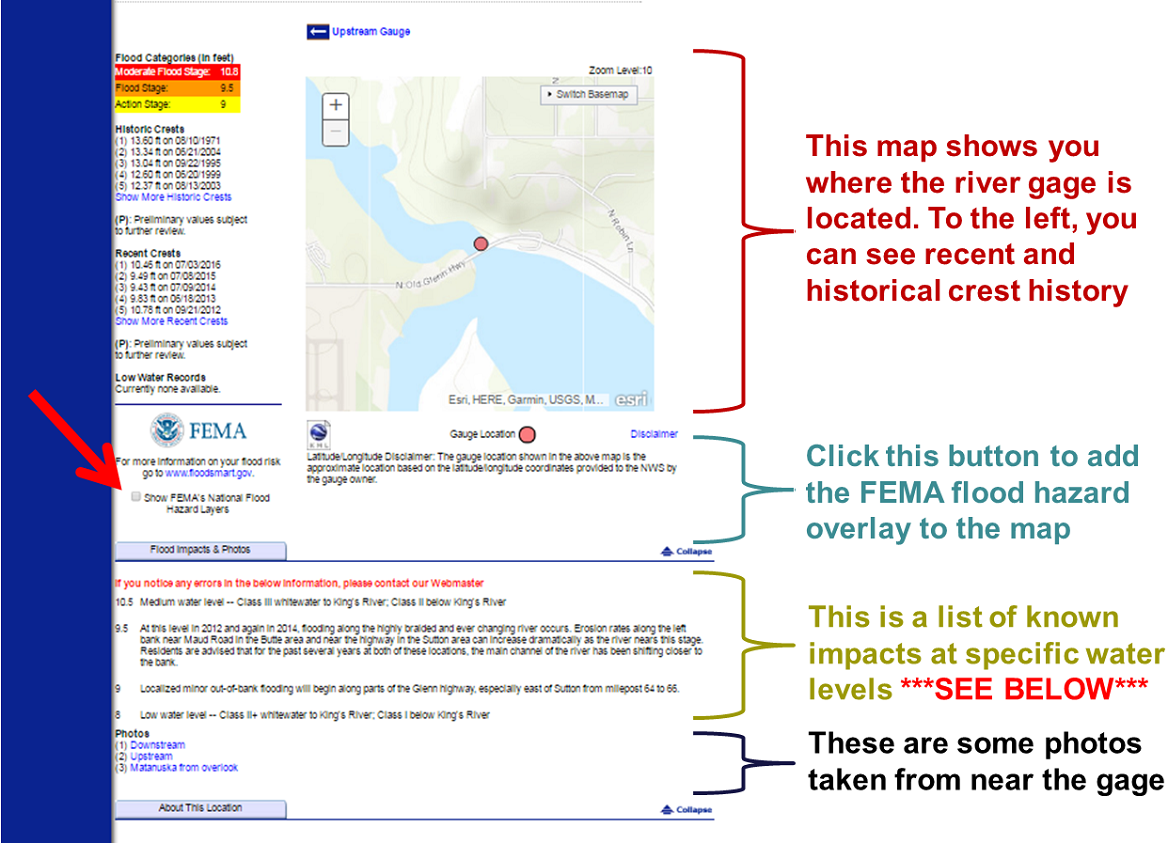
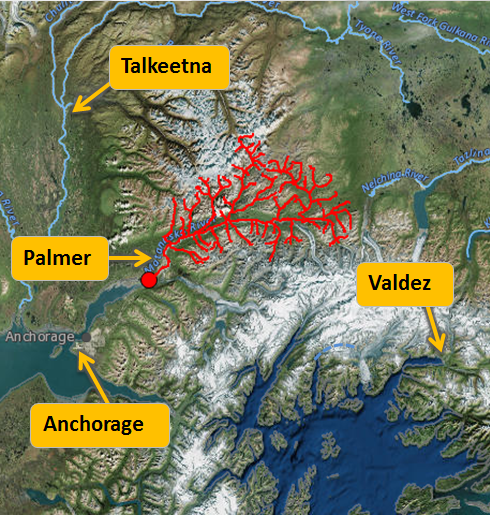
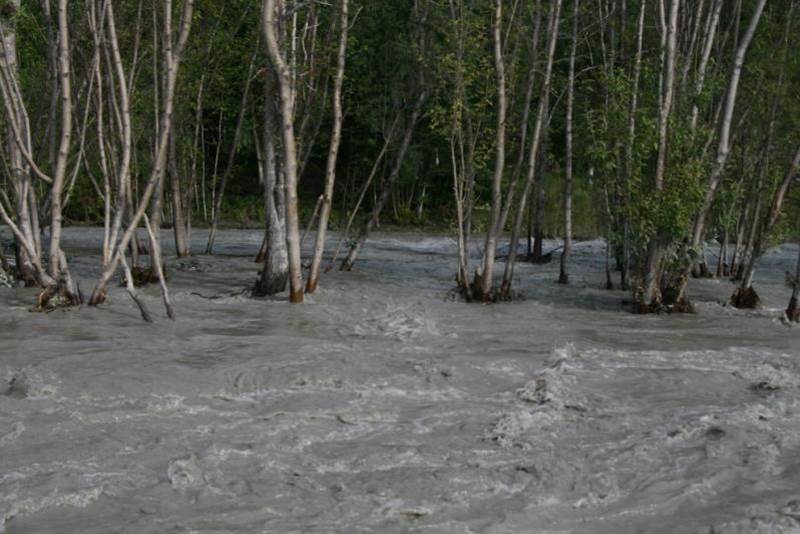
Image courtesy of: USGS
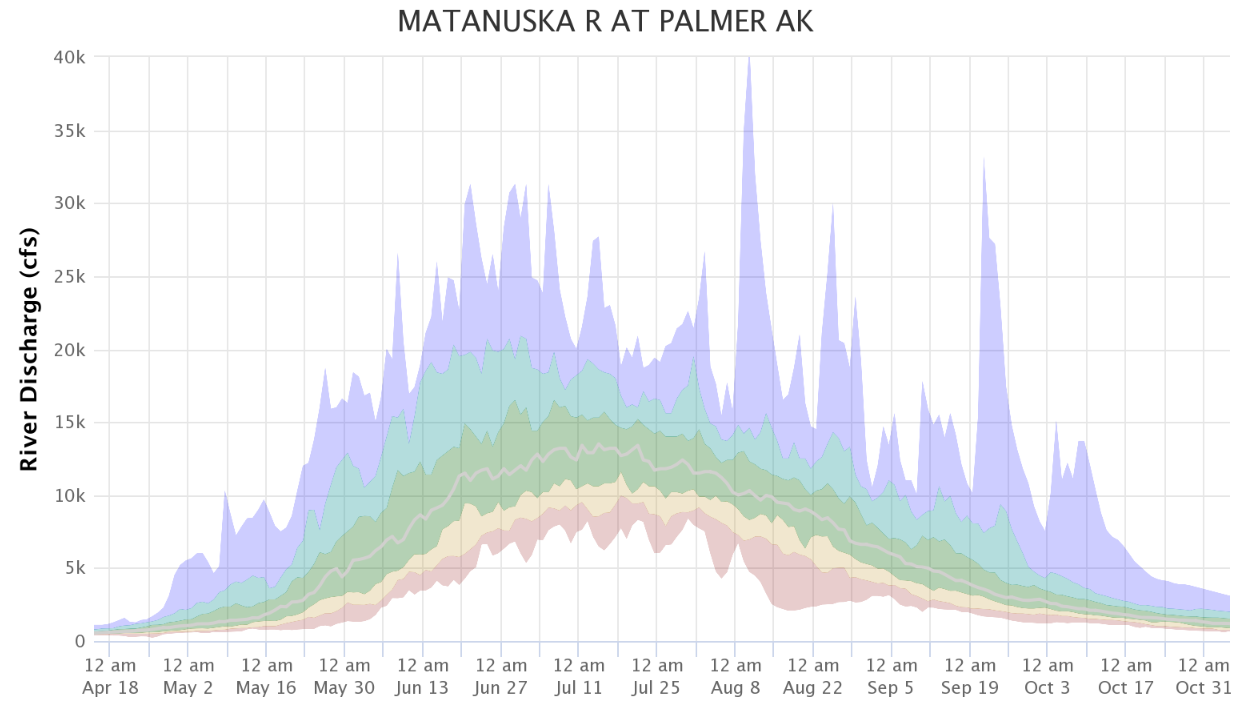
Legend:
Light Red-shaded area: 0-10th percentile flow
Yellow-shaded area: 10th to 25th percentile flow
Dark Green-shaded area: 25th to 75th percentile flow
Thin Gray Line in middle: Median (50th percentile) flow
Light Green-shaded area: 75th to 90th percentile flow
Blue-shaded area: 90th to 100th percentile flow (the top of this area represents the highest daily values recorded for the given date)
.png)
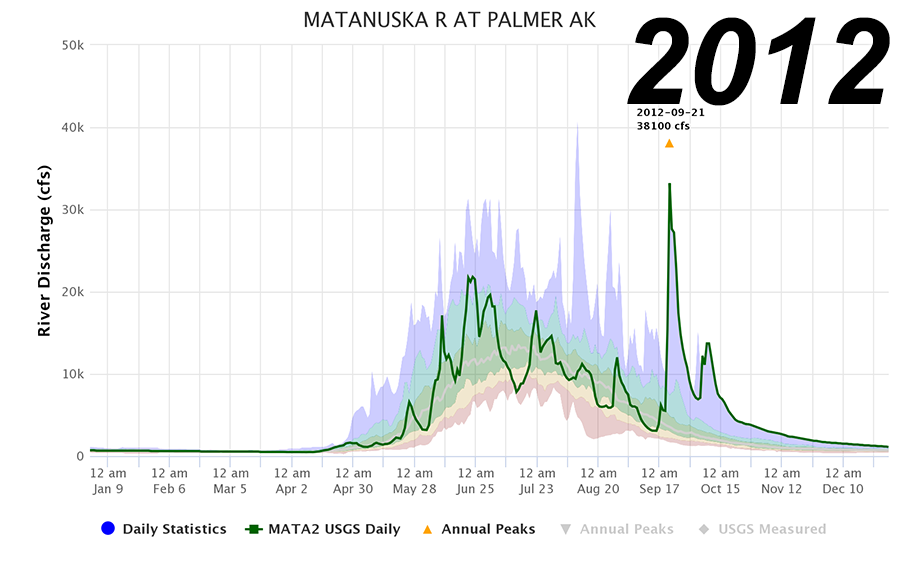
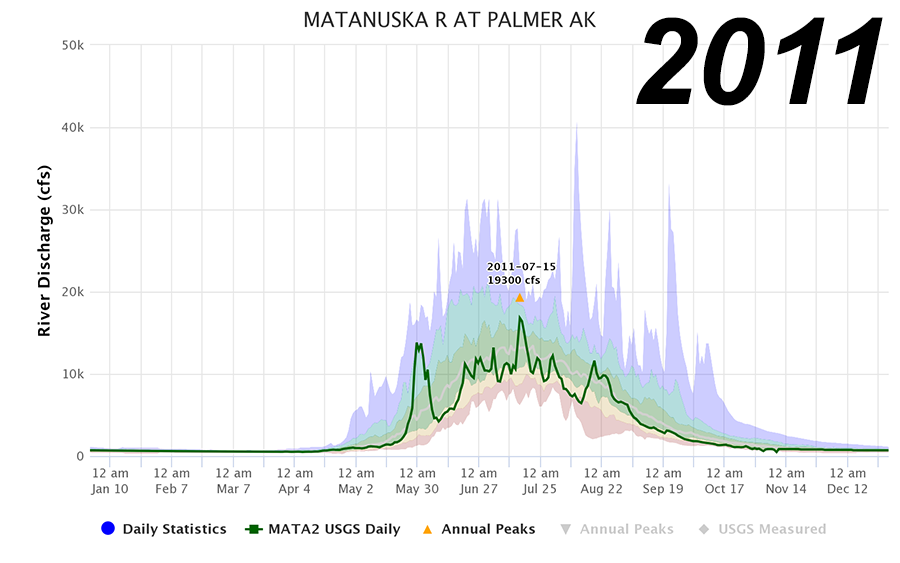
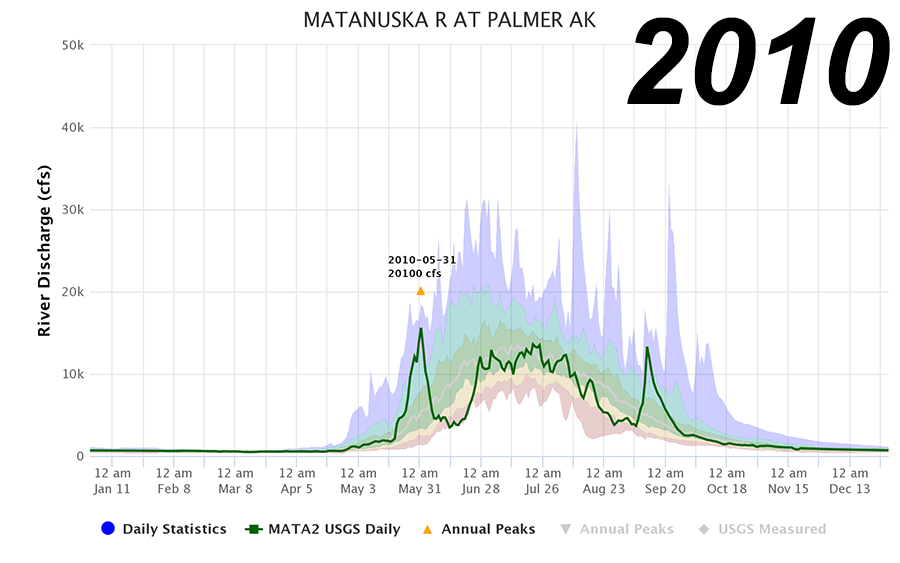
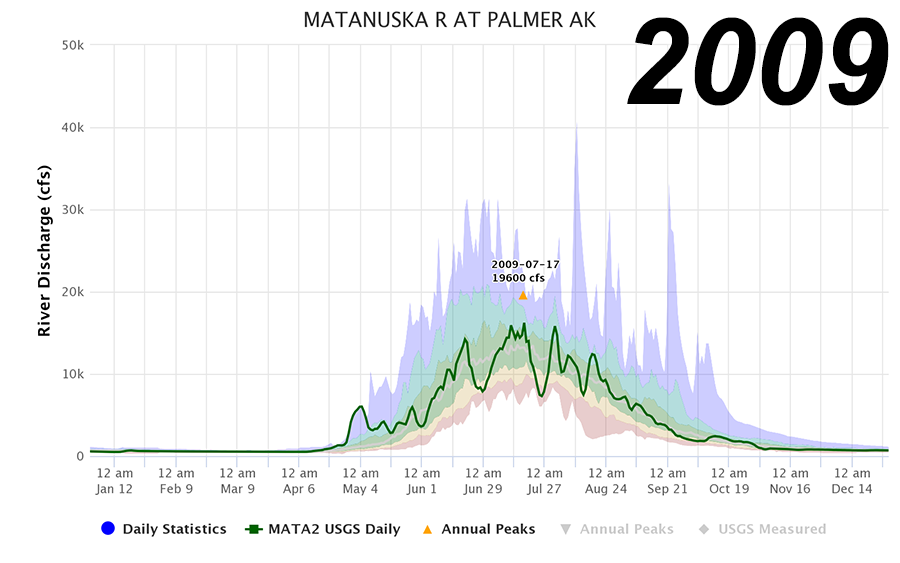
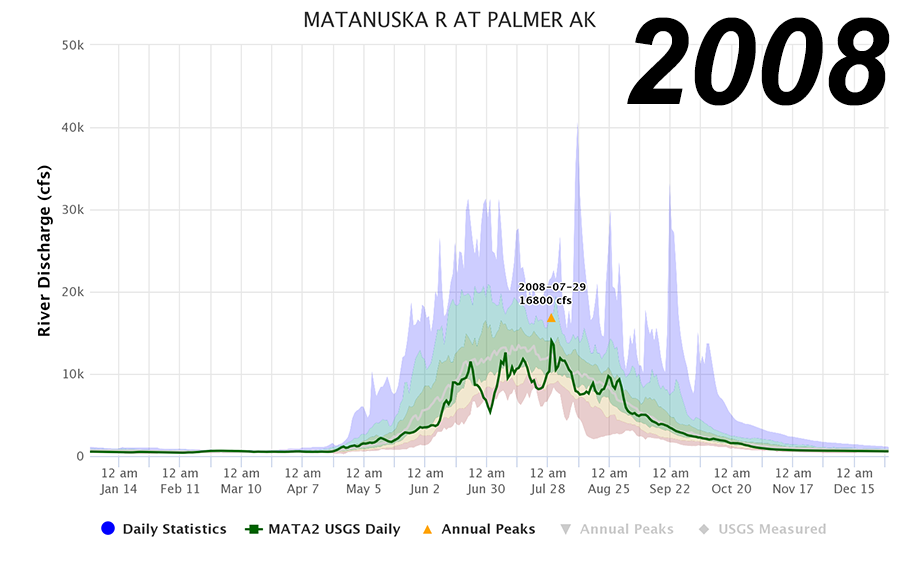
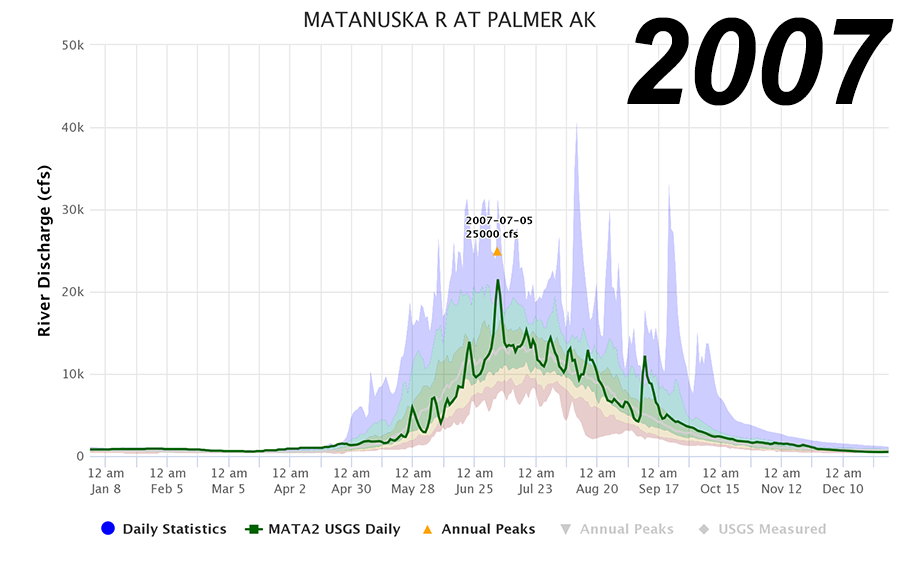
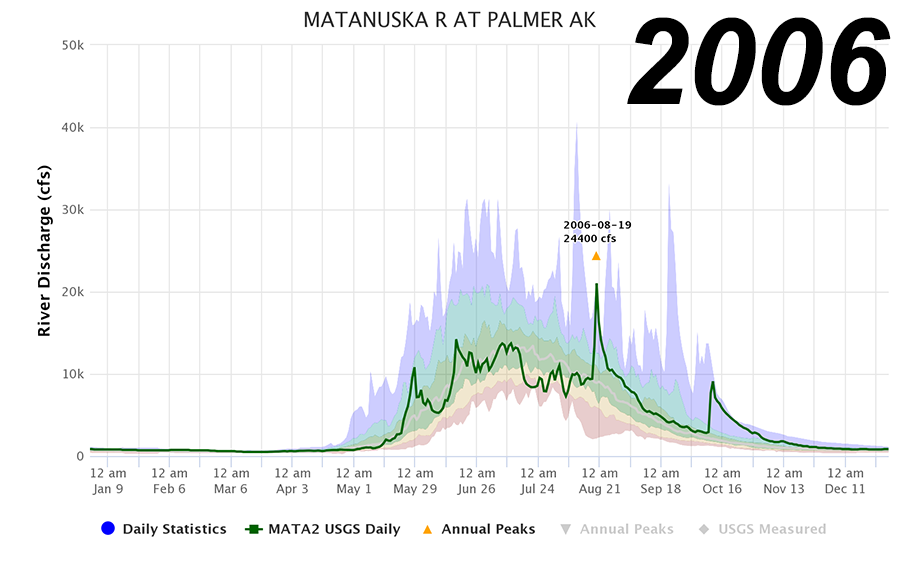
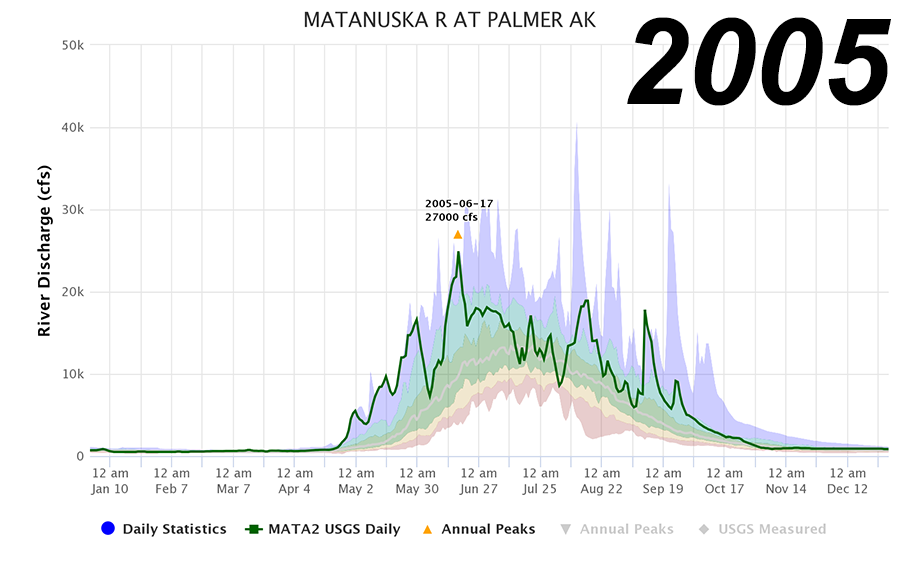

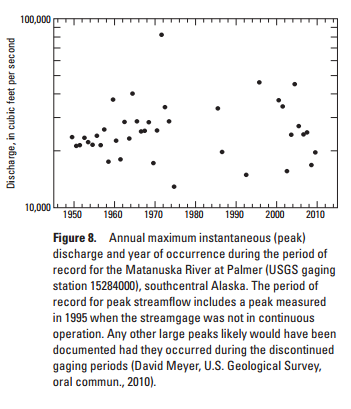
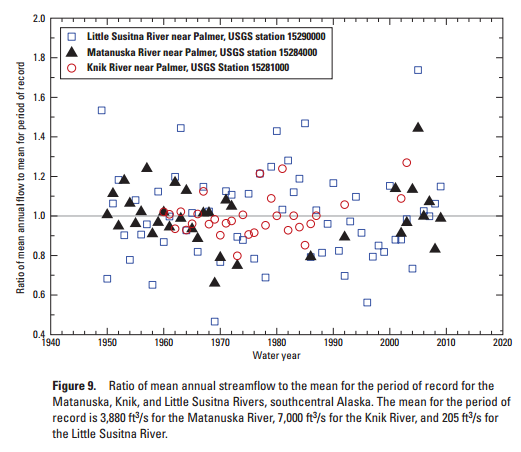
Now, here are some long-term graphs of flow recorded at the USGS gaging station in Palmer. The first image is that of peak streamflow by year, and the second image is a plot of the ratio of average annual streamflow (for each year) to the average annual flow throughout the period of record. Neither way of looking at the data show any clear increasing or decreasing trends over time, although data gaps (primarily from the 1970s through the 1990s) limit the strength of this conclusion.
• 1971 – A large flood resulting from a rainstorm combined with a sudden lake-release on a tributary stream in the Talkeetna Mountains (see Flood History page) breached a dike near Butte, causing widespread flood damages to the area.
• July 1991 – Severe bank erosion near Circle View destroyed one home and threatened others.
• July 1994 – Erosion near Circle View caused serious damage and threatened more property and homes. The State declared a disaster and loaned $500,000 to the Mat-Su Borough to construct four dikes to protect Circle View and Stampede Estates Subdivisions.
• Since 1992 (exact dates unspecified) – Several homes, a triplex, a 120-foot long greenhouse, and a horse barn have fallen into the river…About another dozen homes have been relocated or demolished to avoid erosion.