A Guide to Interpreting Climate Prediction Center Products
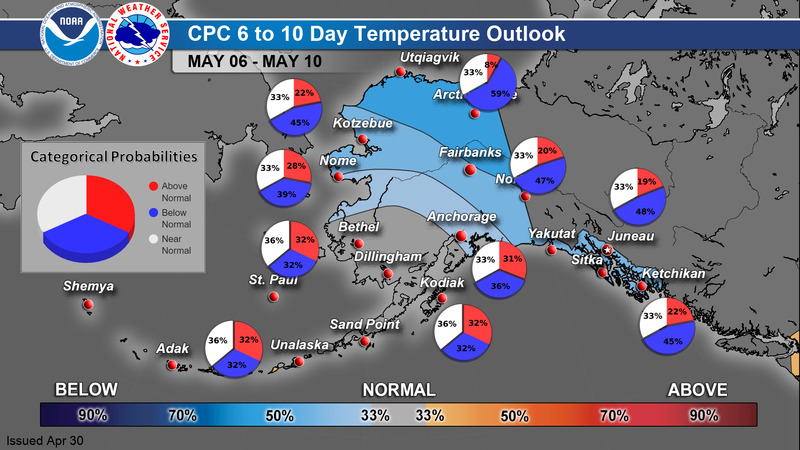
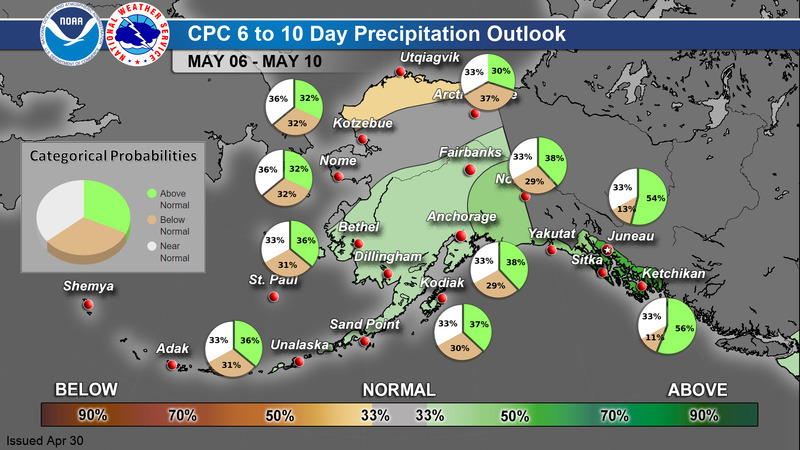
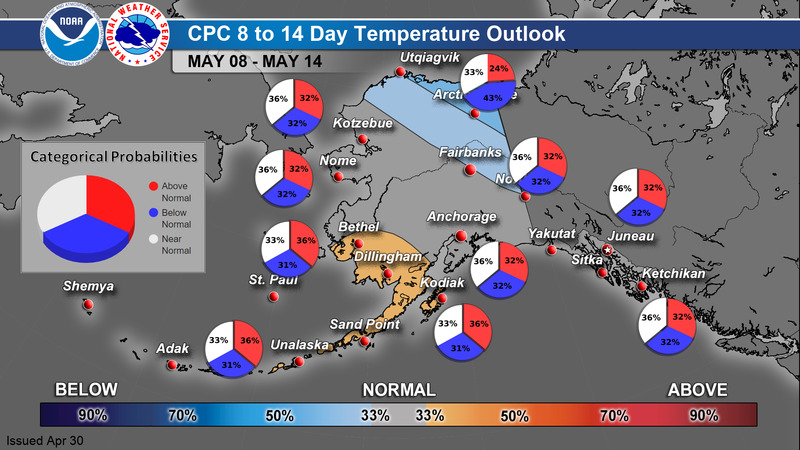
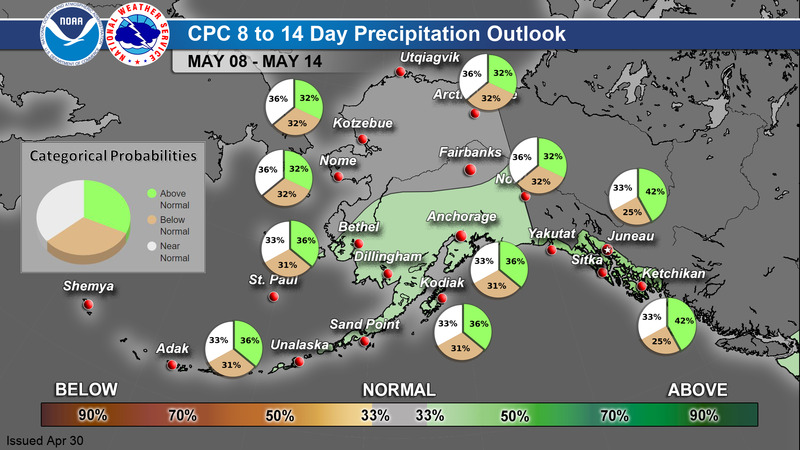
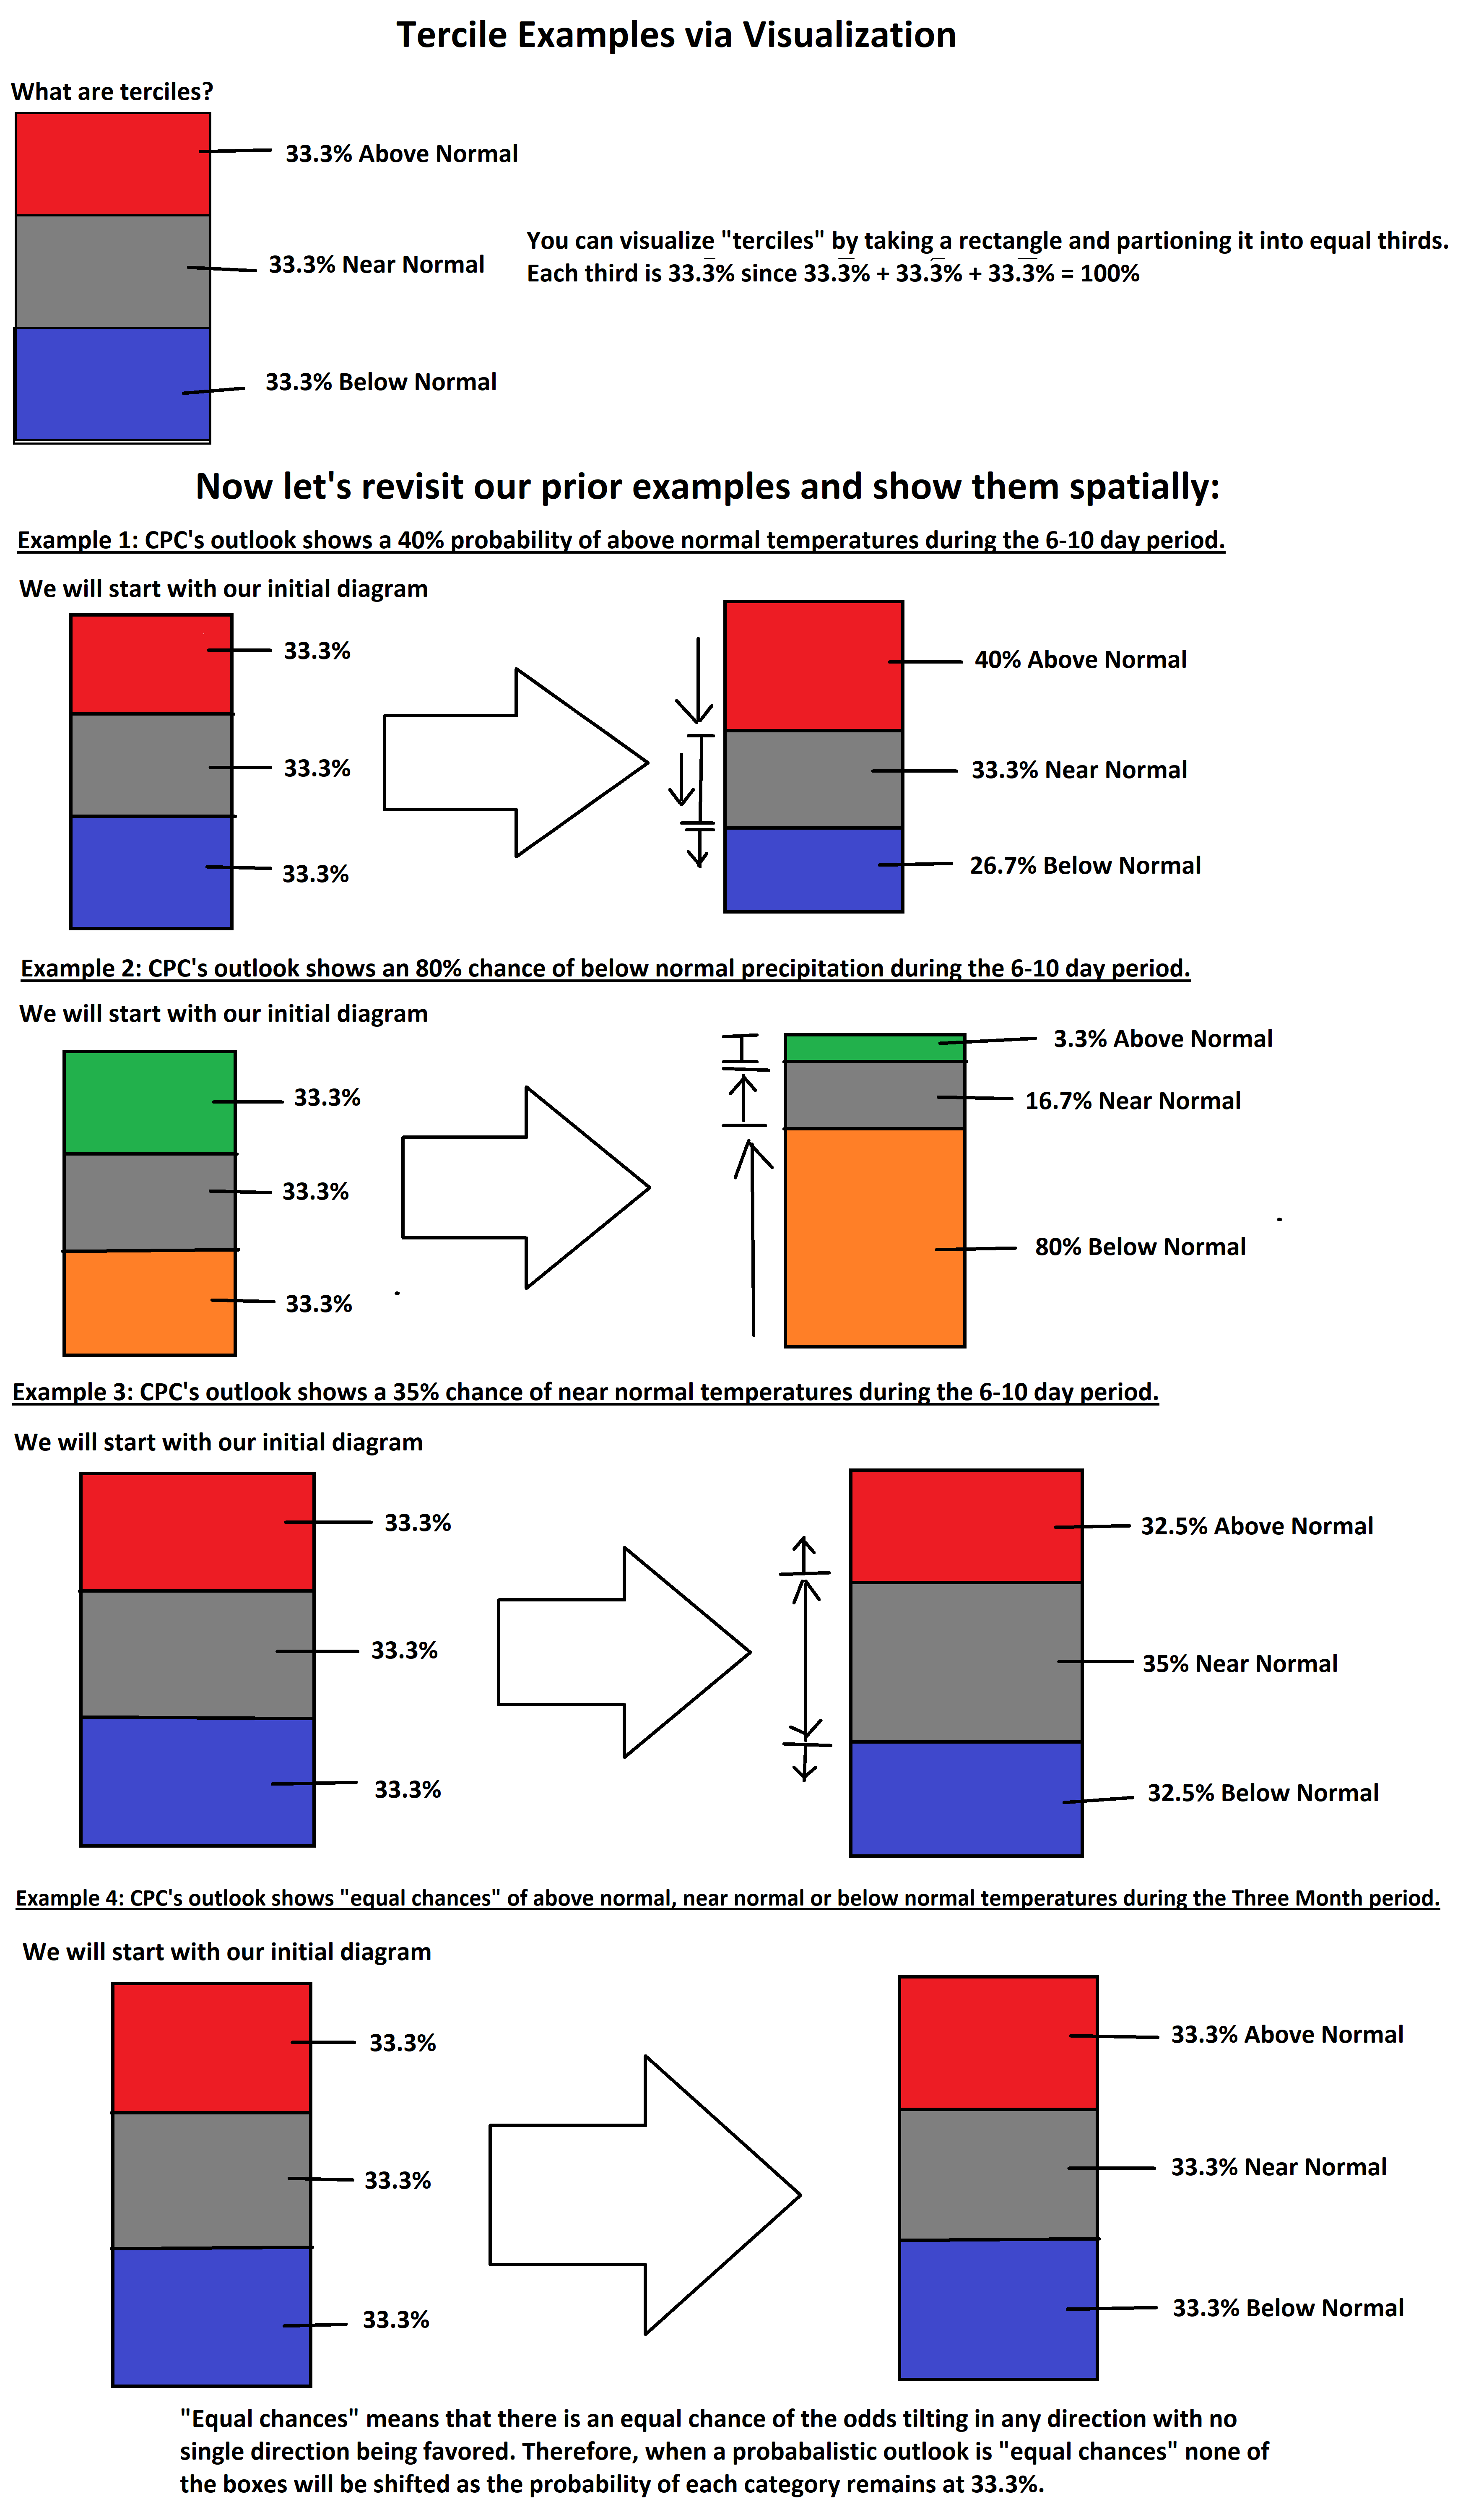
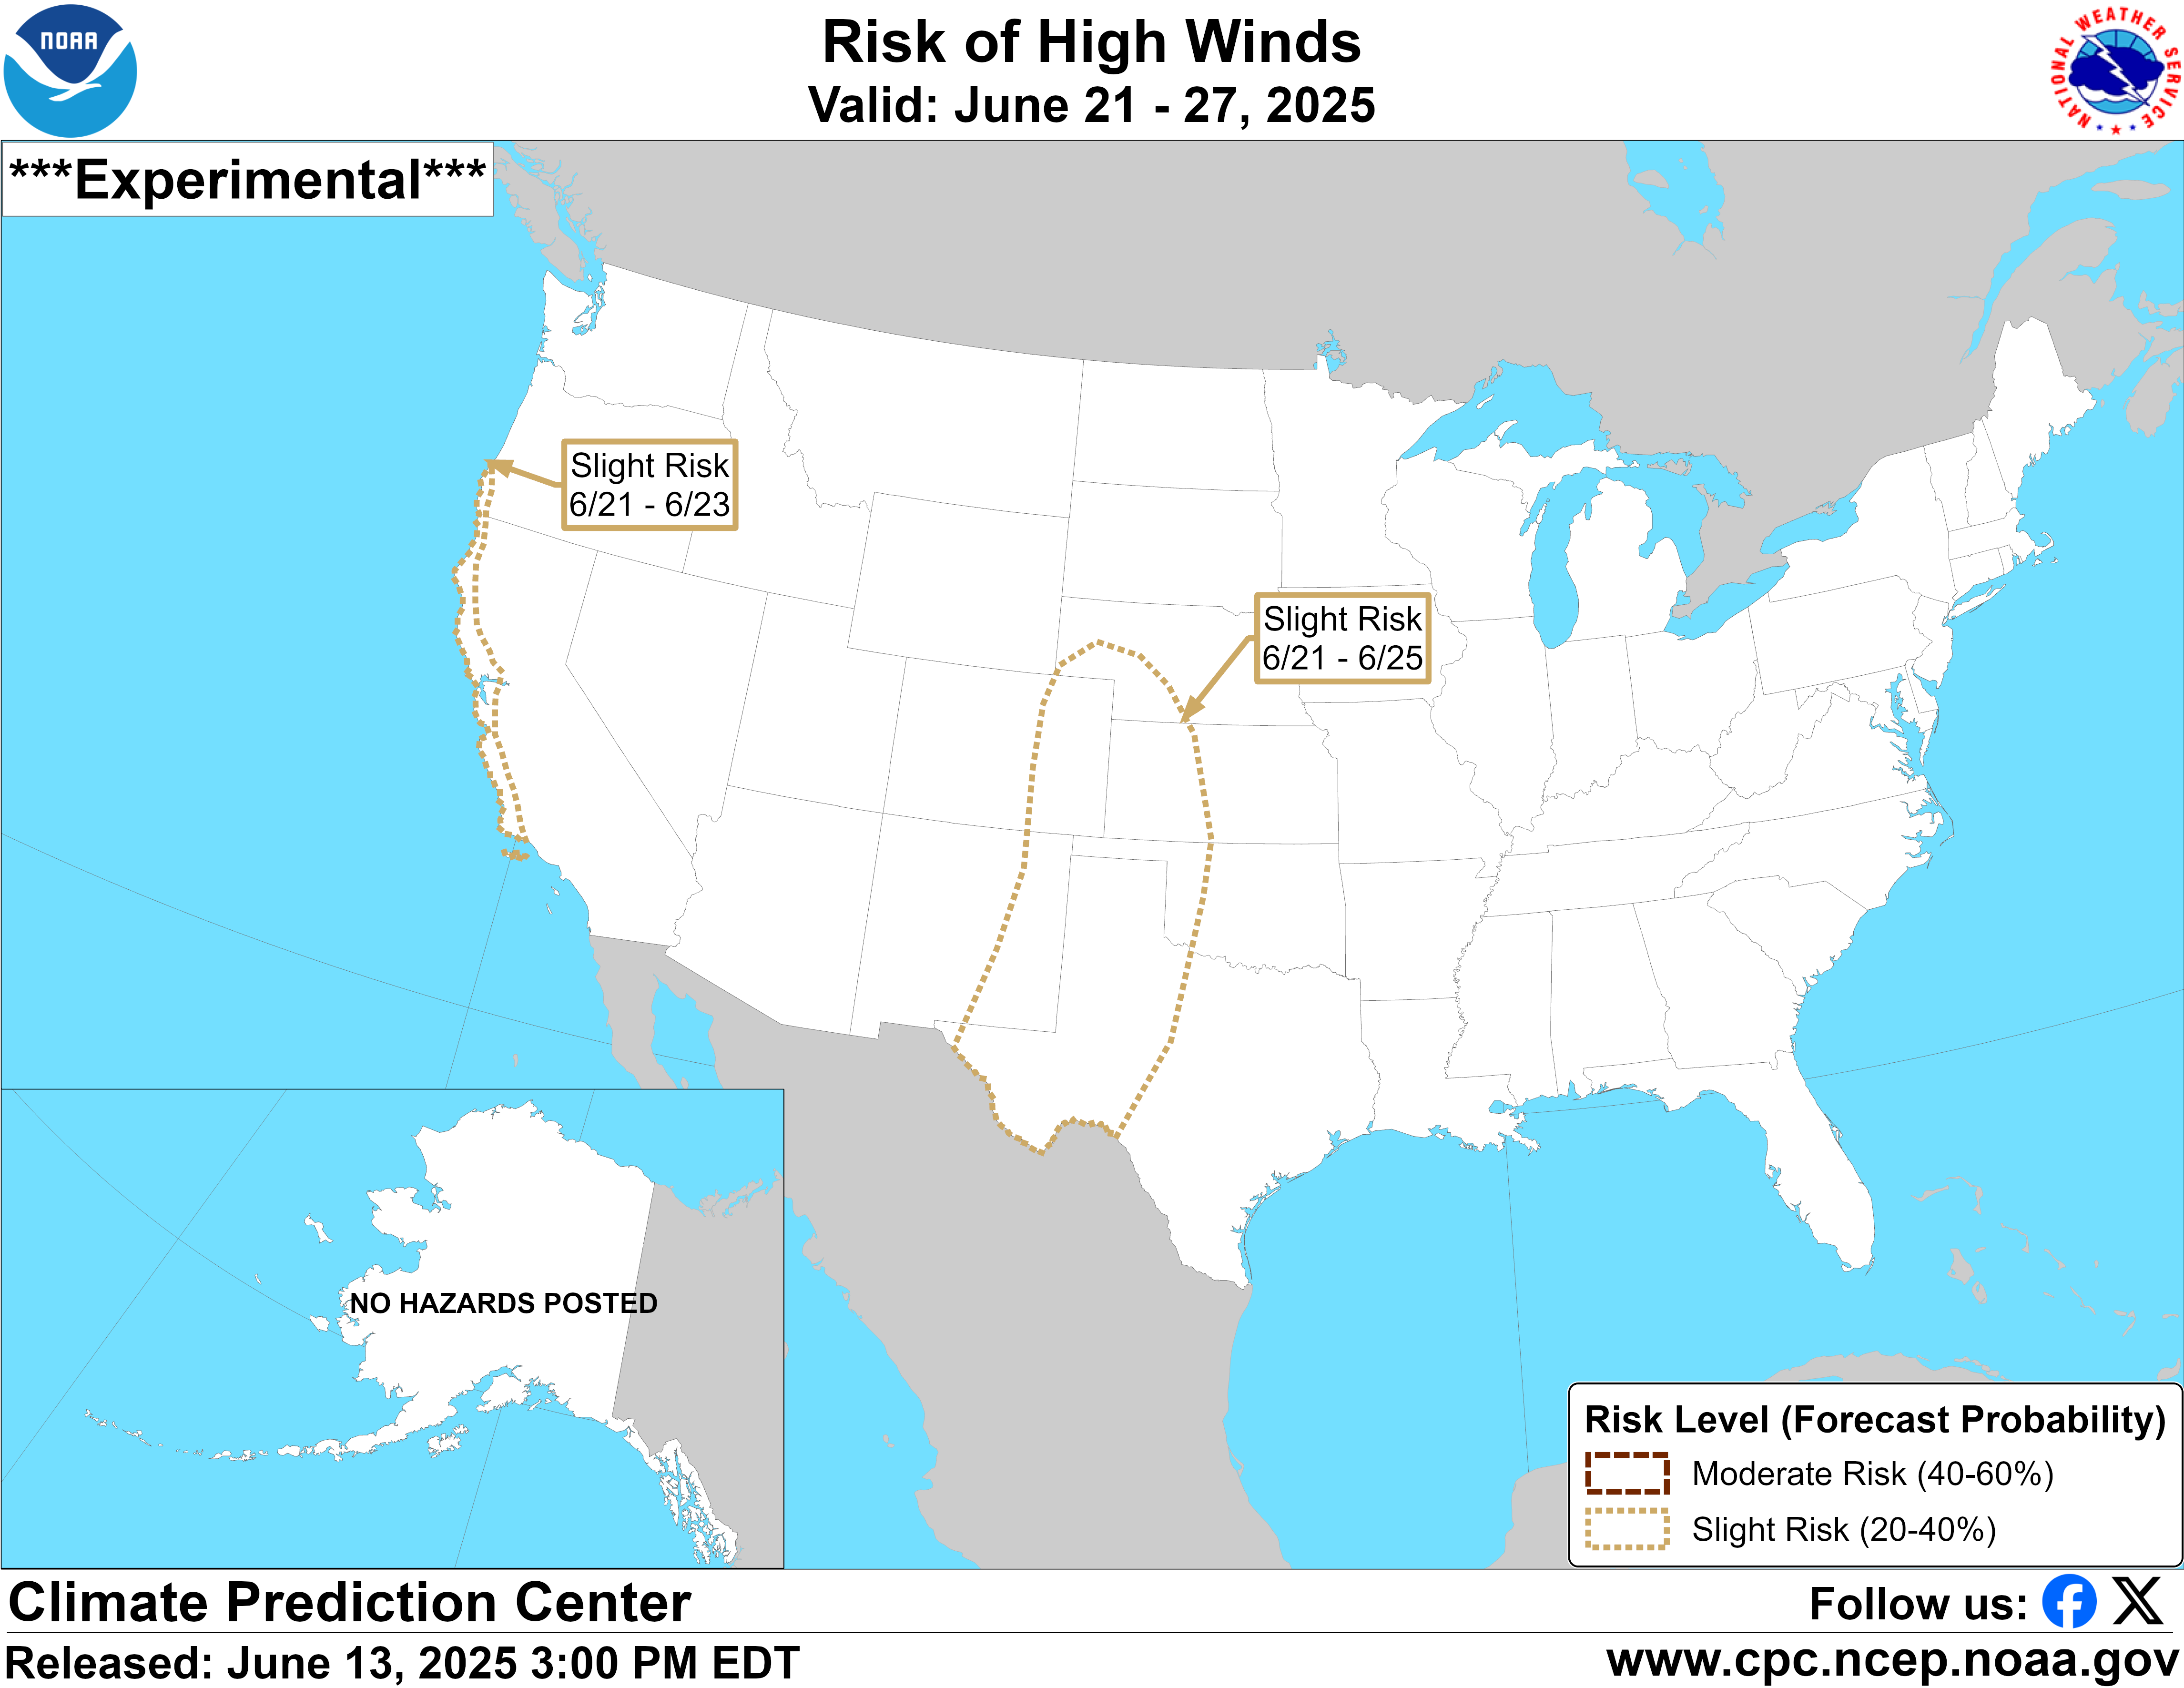
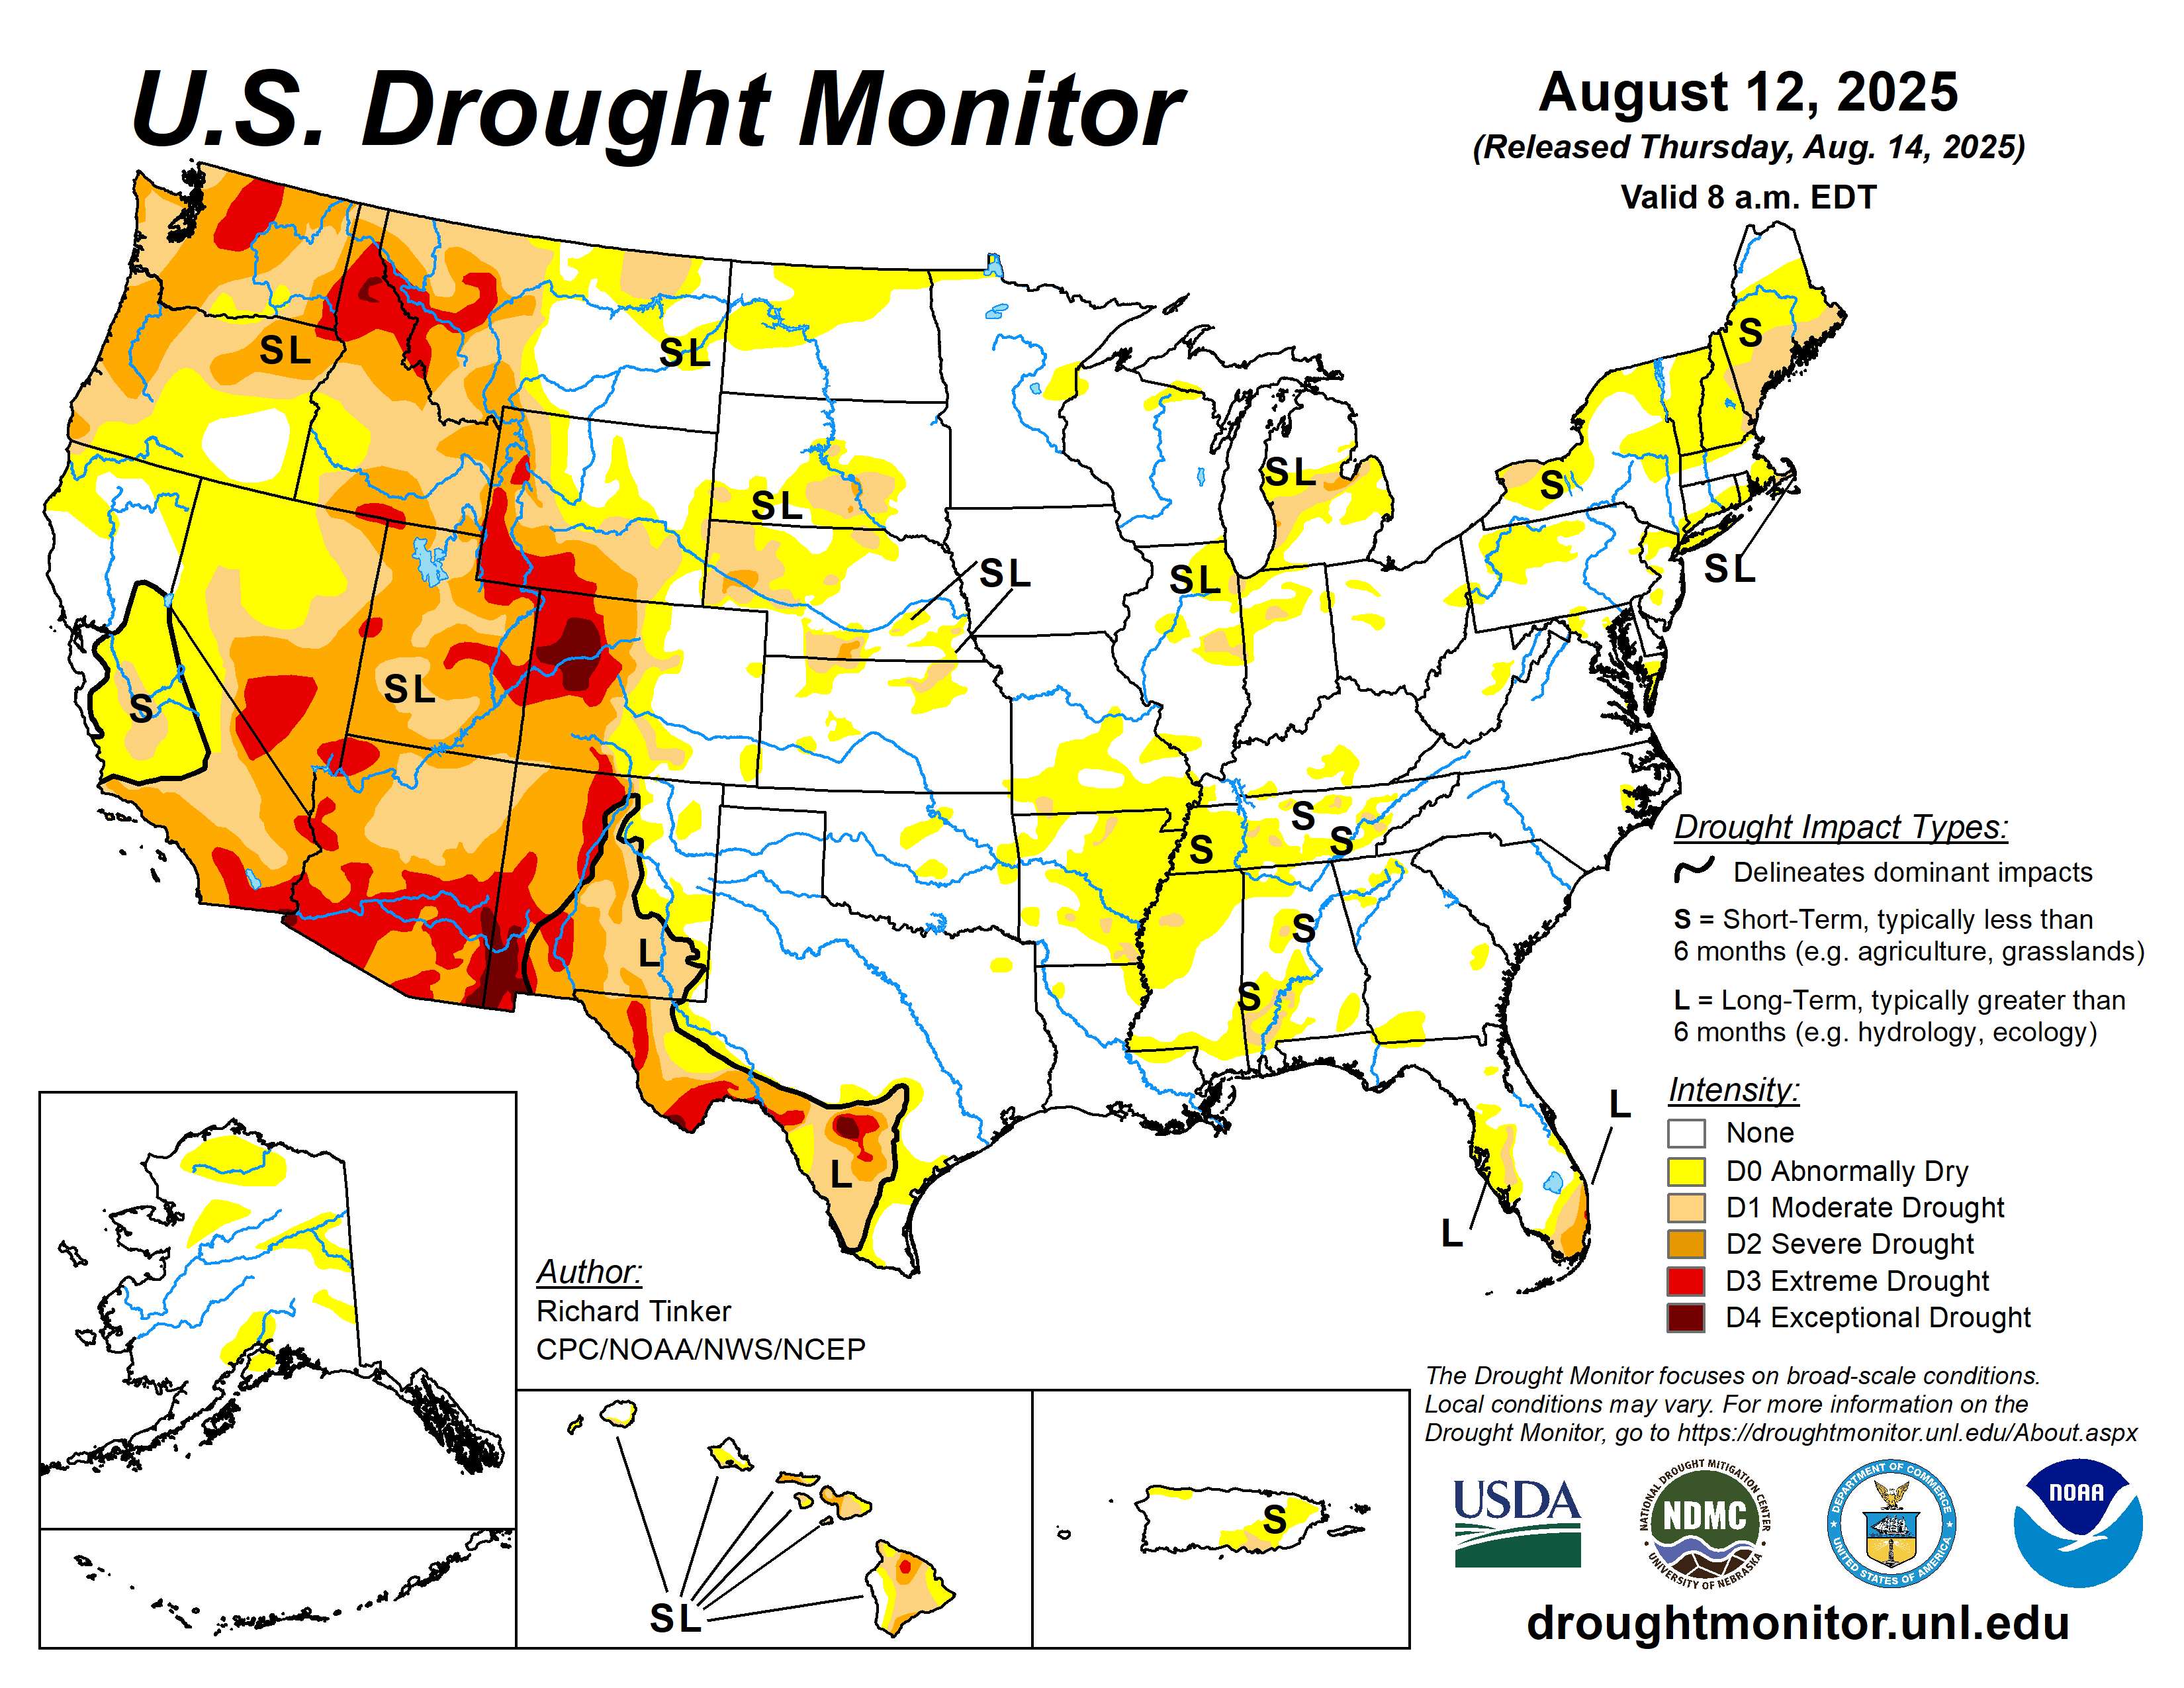
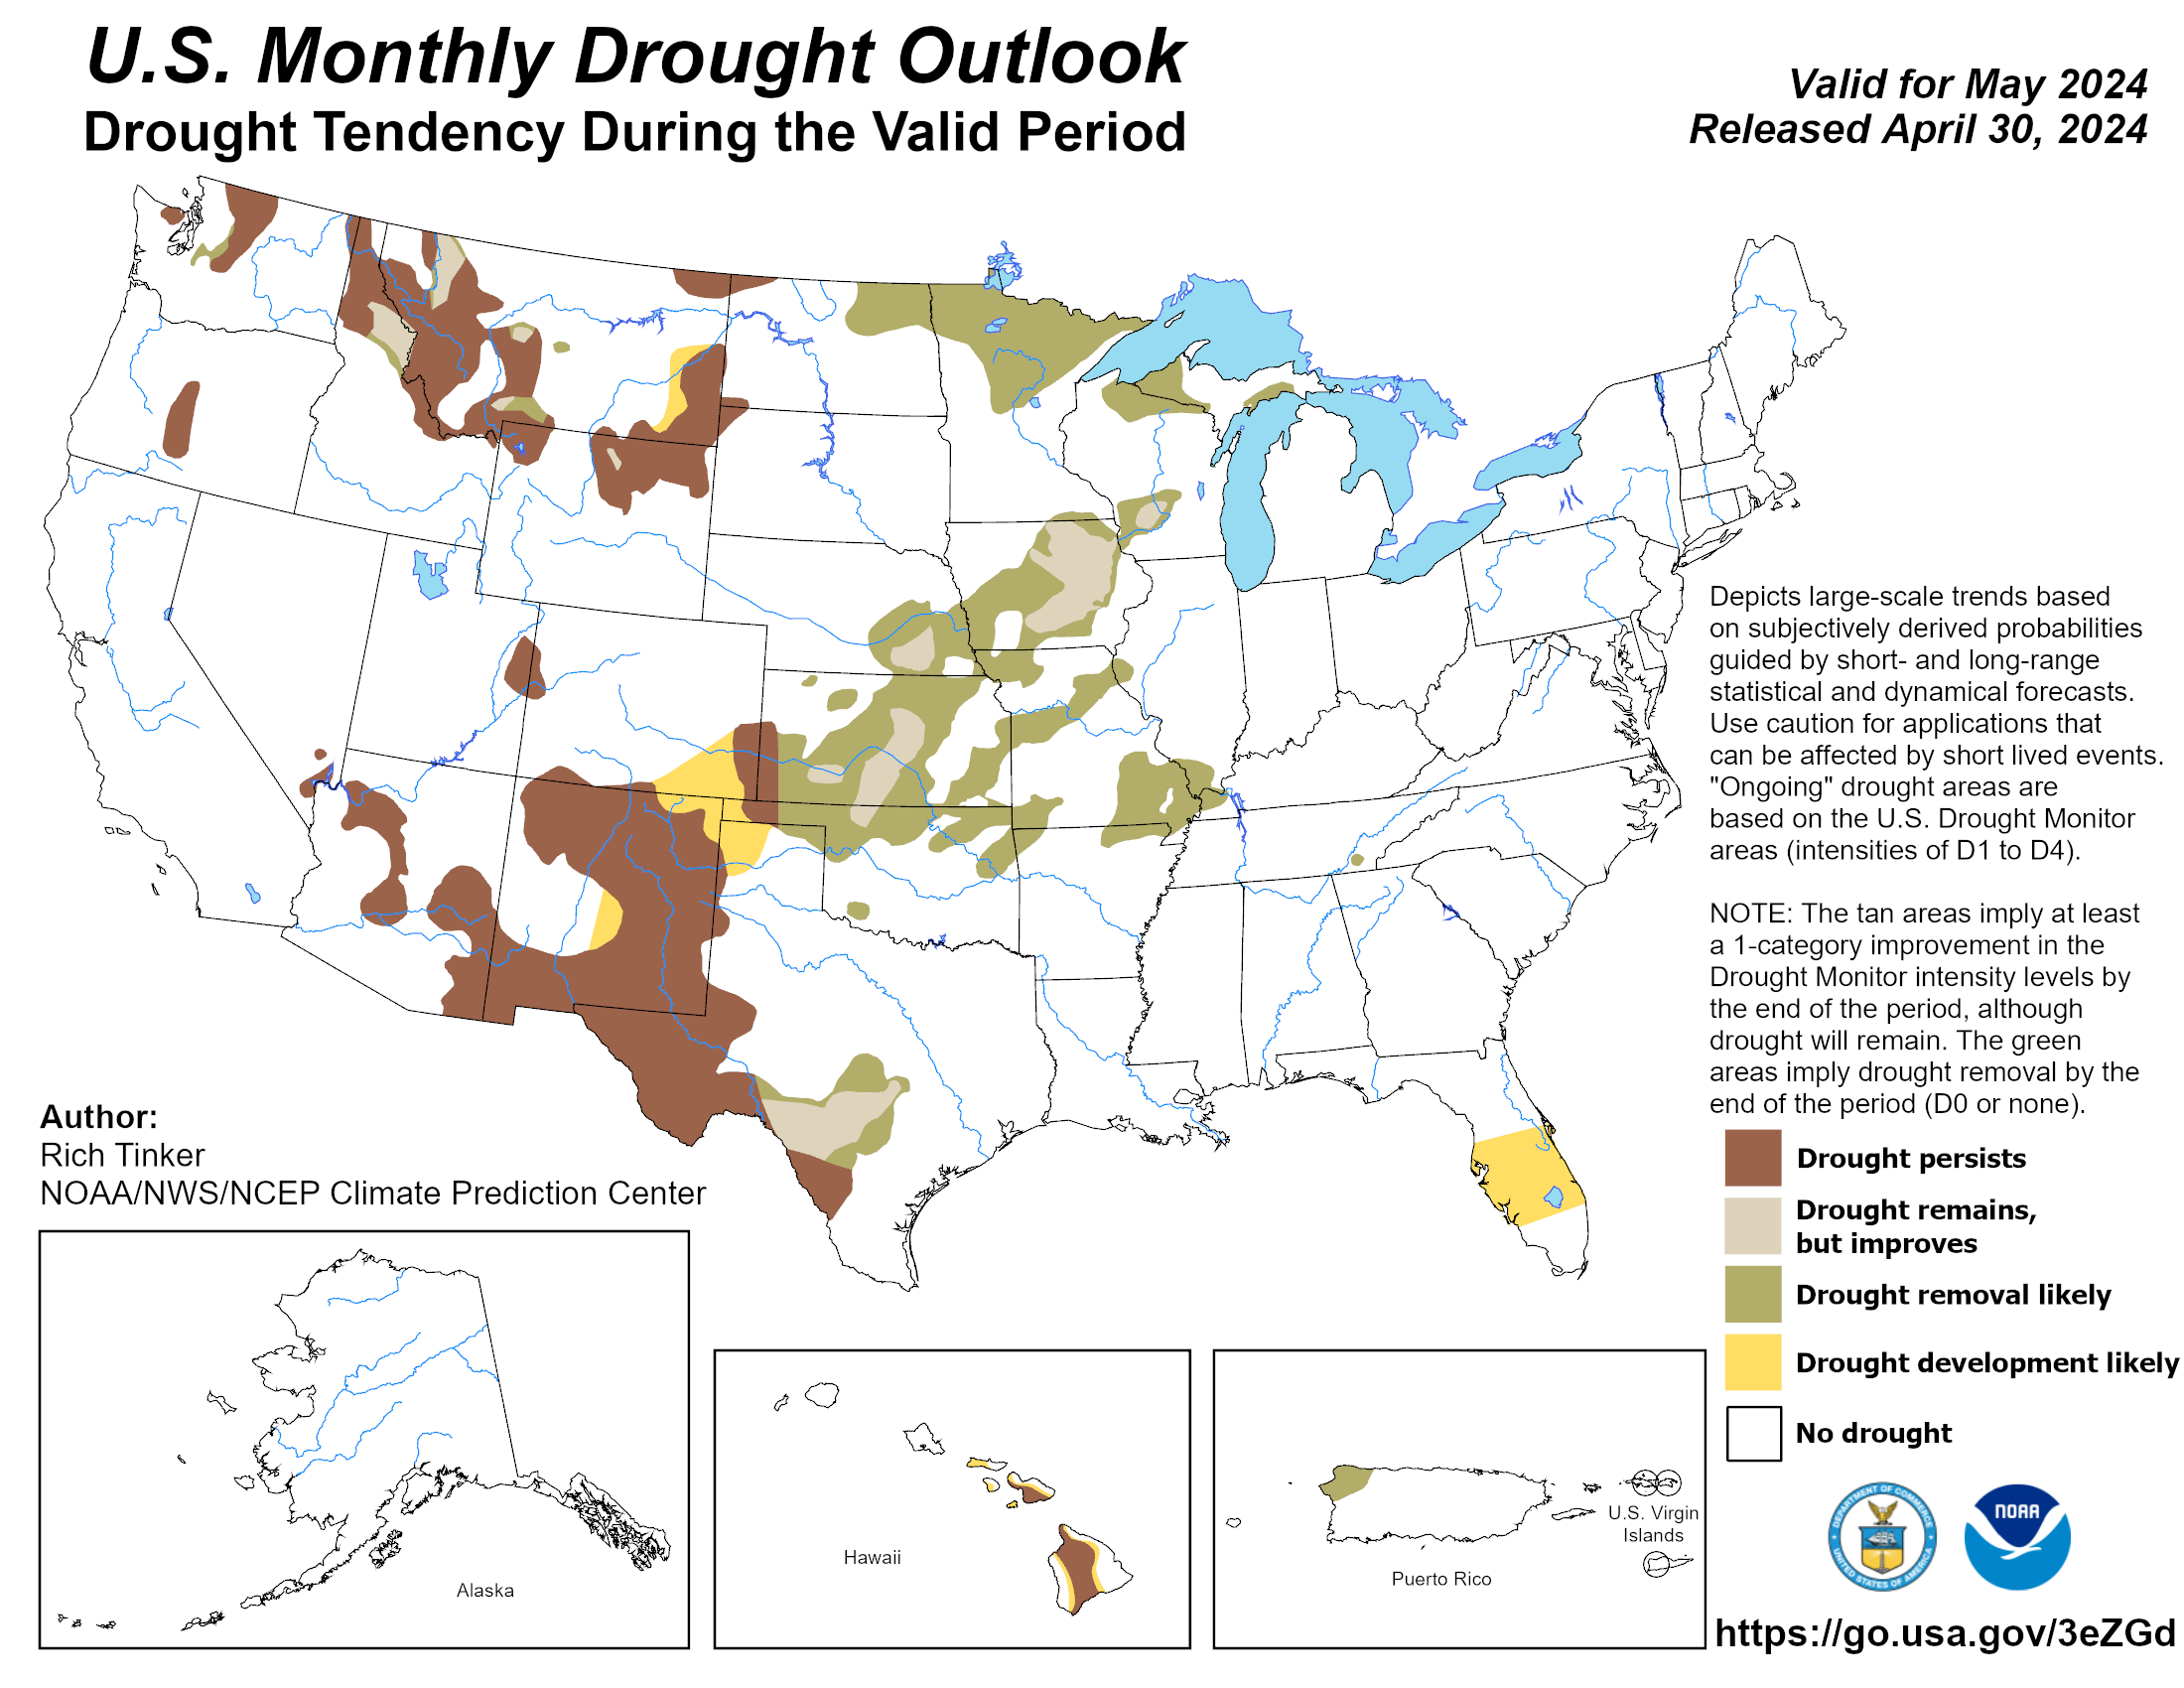
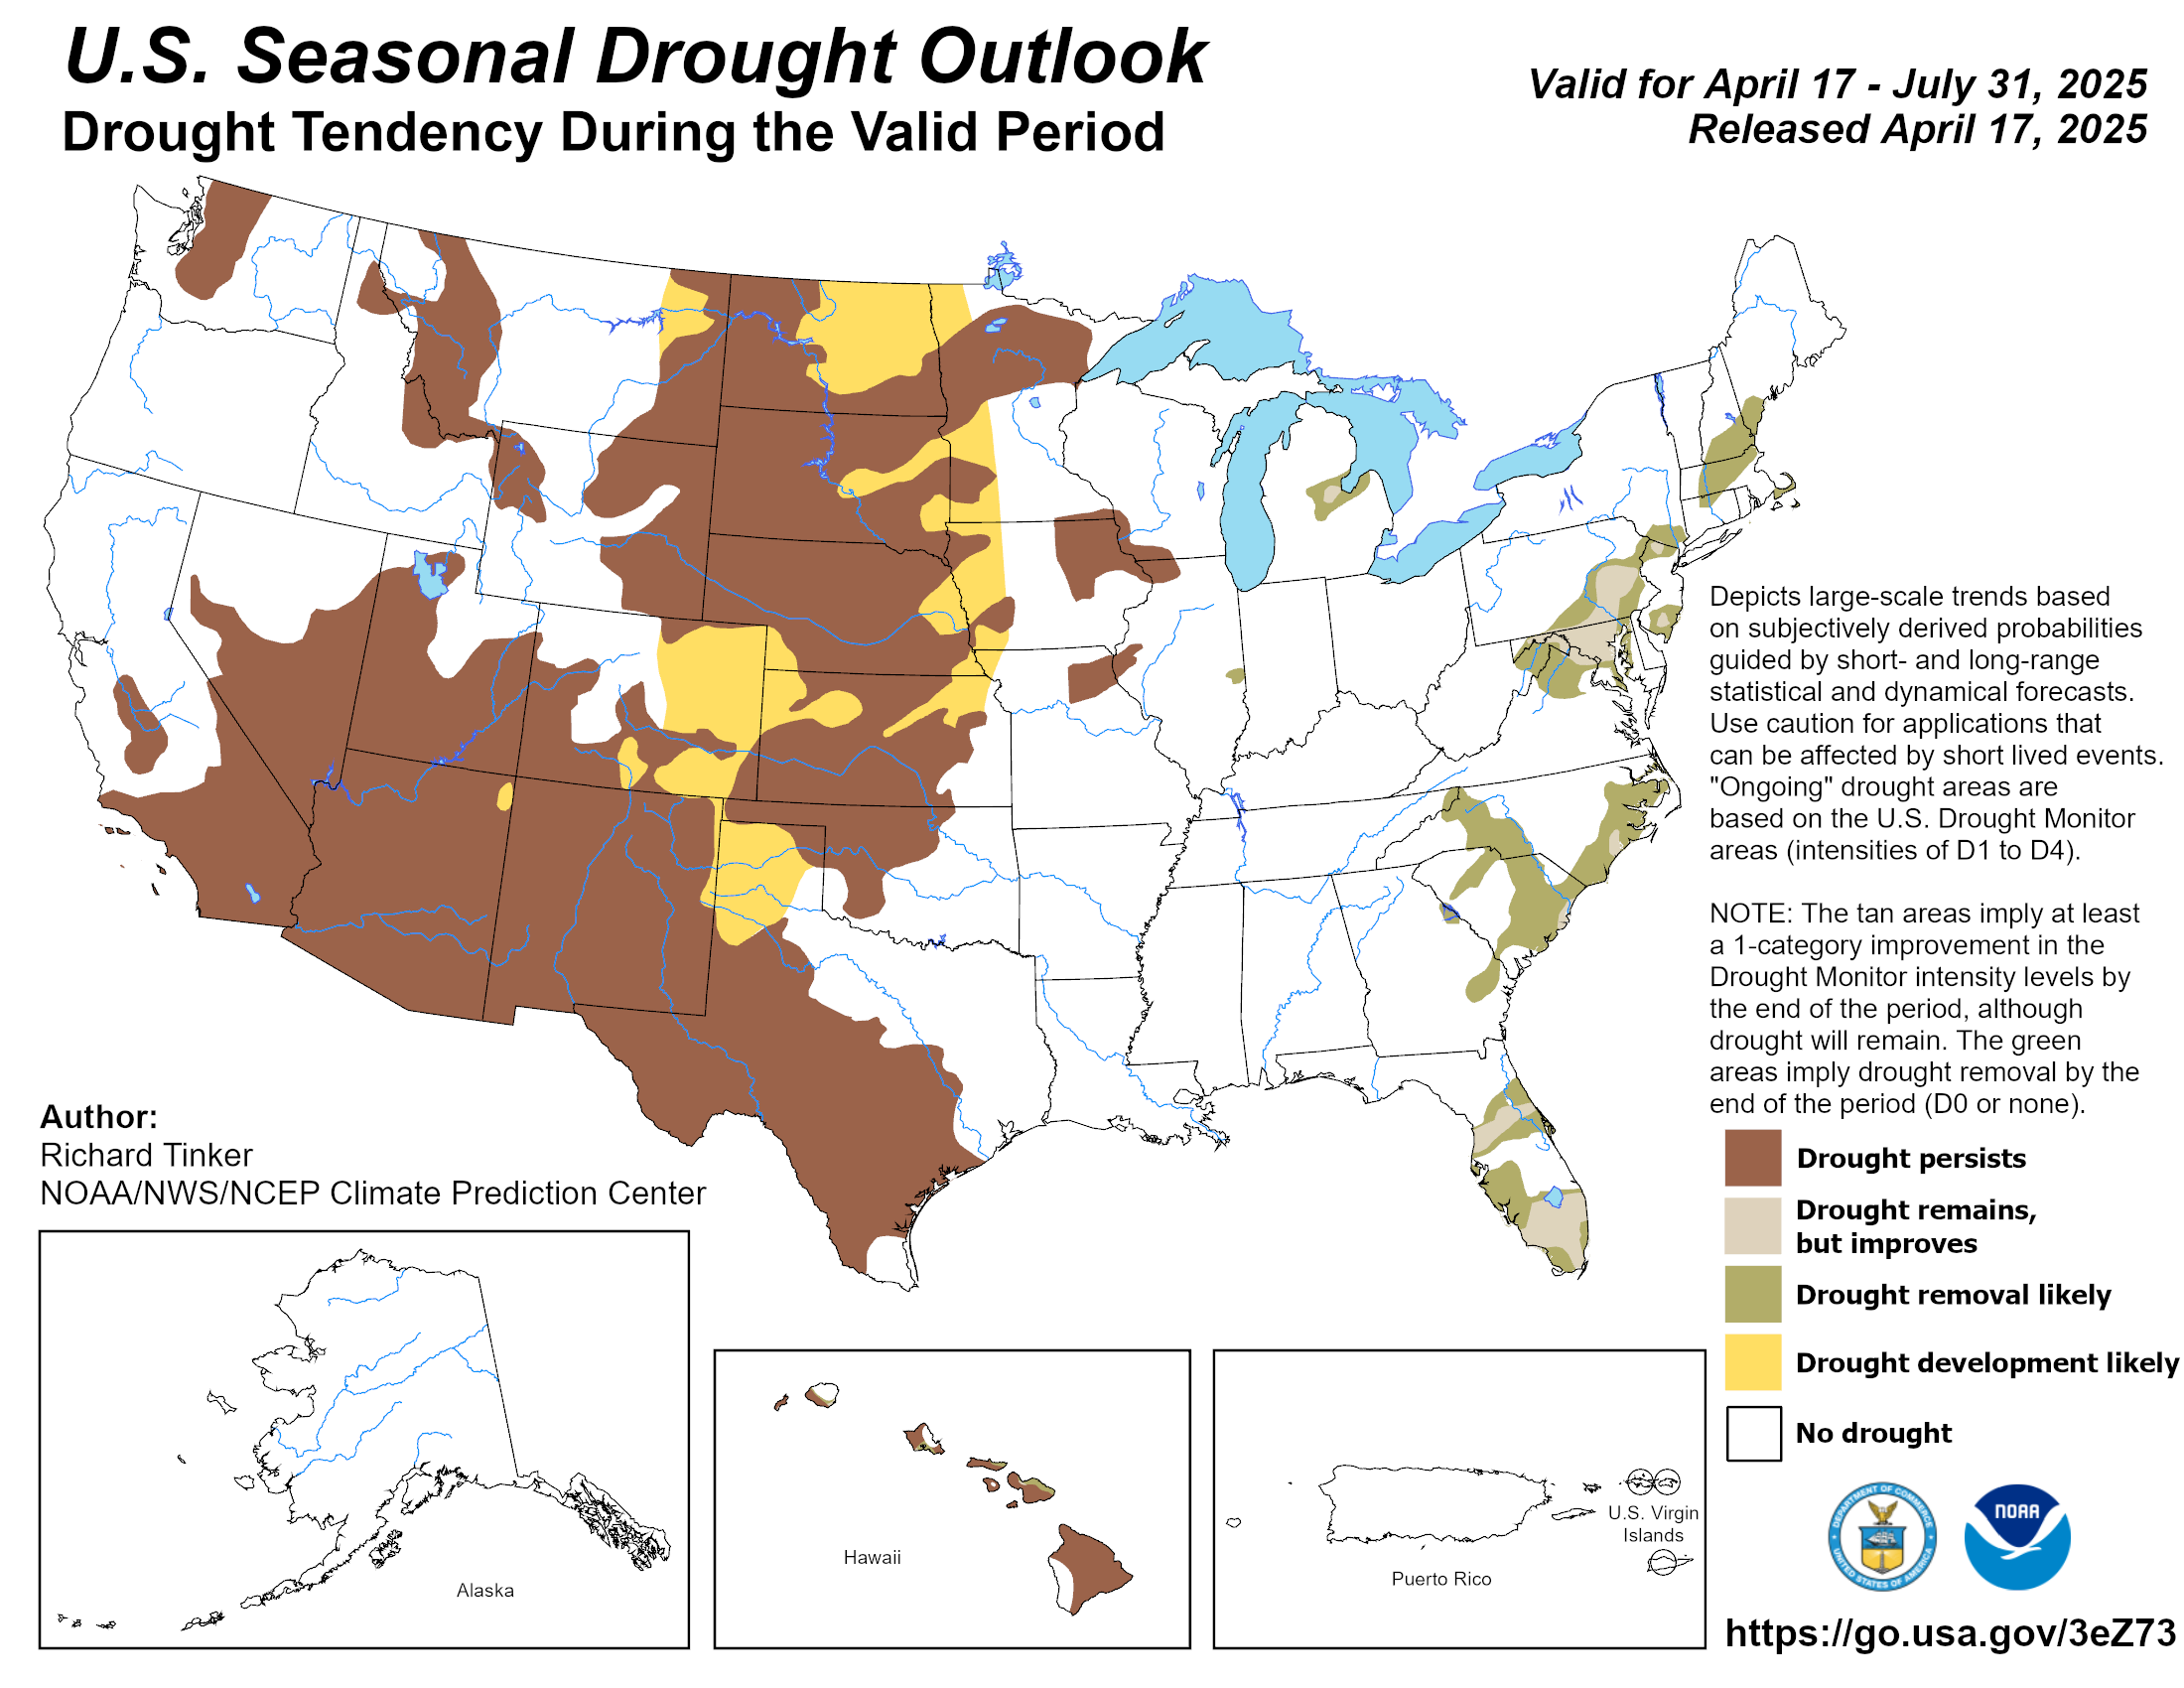
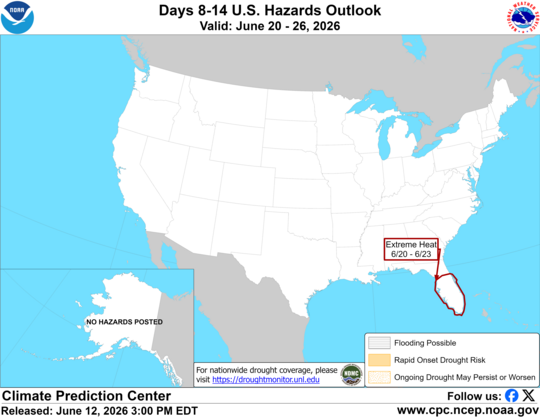
One Month and Three Month Rules What do CPC products not tell us? Click Here for CPC's 6-10 Day Outlook Interactive Map Click Here for the rules when interpreting CPC's 6-10 day outlook Click Here to go back to the Table of Contents Click Here for CPC's 8-14 Day Outlook Interactive Map Click Here for the rules when interpreting CPC's 8-14 day outlook Click Here to go back to the Table of Contents Click Here to go to the Weeks 3-4 Rules Click Here to go back to the Table of Contents Click Here for CPC's One Month Outlook Interactive Map Click Here for the rules when interpreting CPC's One Month outlook Click Here to go back to the Table of Contents Click Here for CPC's Three Month Outlook Interactive Map Click Here for the rules when interpreting CPC's Three Month outlook Click Here to go back to the Table of Contents Temperature: CPC's 6-10 day and 8-14 day temperature maps show the probability of the observed temperature (the average of the daily mean temperature of all the days in the period) will be in one of three different categories: above normal, near normal and below normal. The daily mean temperature is the 24hr average of all temperature observations for a given station on a given day. The 6-10 Day Average and 8-14 Day Average are the average of all the daily mean temperatures within either the 6-10 day period or 8-14 day period. Daily Mean Temperature = Sum of the Temperature Observation Values/Number of Temperature Observations in a 24hr period 6-10 Day Average = Sum of the Daily Mean Temperature Values (Days 6-10)/Number of Days in Period 8-14 Day Average = Sum of the Daily Mean Temperature Values (Days 8-14)/Number of Days in Period These maps show the probability of the 6-10 Day and 8-14 Day Average Temperature being above, near and below the 1991-2020 climate normal for the period. Precipitation: CPC 6-10 day and 8-14 day precipitation maps show the probability that the observed precipitation (the total precipitation of all days in the period) will be in one of three different categories: above normal, near normal and below normal. These maps show the probability of the 6-10 Day and 8-14 Day Total Precipitation being above, near and below the 1991-2020 climate normal for the period. Rules and Examples of Interpreting CPC's 6-10 Day and 8-14 Day Probabilistic Outlooks 1) If the probability of "above" or "below" temperature and/or precipitation is between 33.3% and 63.4%: - Probability of the opposite category declines by the difference between the higher probability category and 33.3%. - Probability of the middle category remains at 33.3%. Example 1: CPC's outlook shows a 40% probability of above normal temperatures during the 6-10 day period. Probability of Above Normal Temperatures = 40% Probability of Near Normal Temperatures = 33.3% Probability of Below Normal Temperatures = 100% - [40% + 33.3%] = 100% - 73.3% = 26.7% 2) If the probability of "above" or "below" temperature/precipitation is greater than 63.4%: - Probability of the opposite category reaches the minimum allowed value of 3.3% (it does not matter if the favored category is 70%, 80% or 90% as long as it is above 63.4% the opposite category will be 3.3% every time). - Probability of the middle category (near normal) decreases by the sum of "above" and "below." ***The probability of the non-favored category is NEVER zero*** Example 2: CPC's outlook shows an 80% chance of below normal precipitation during the 6-10 day period. Probability of Above Normal Precipitation = 3.3% Probability of Near Normal Precipitation = 100% - [80% + 3.3%] = 100% - 83.3% = 16.7% Probability of Below Normal Precipitation = 80% 3) If the probability of near normal is greater than 33.3%: - Probability of each of the other categories decreases by half of the amount that the middle category exceeds 33.3%. Example 3: CPC's outlook shows a 35% chance of near normal temperatures during the 6-10 day period. Probability of Near Normal Temperatures = 35% Probability of Above Normal Temperatures = 35% - 33.3% = 1.7% ---> 1.7%/2 = 0.85% ---> 33.3% - 0.85% = 32.45% (~32.5%) Probability of Below Normal Temperatures = 35% - 33.3% = 1.7% ---> 1.7%/2 = 0.85% ---> 33.3% - 0.85% = 32.45% (~32.5%) Click Here to go to the 6-10 Day Outlook Maps Click Here to go to the 8-14 Day Outlook Maps Click Here to go back to the Table of Contents Weeks 3-4 is the only category that has no "near normal" category. Weeks 3-4 has above normal, below normal and equal chances categories. Since there is no "near normal" category, the rules are more simple here. Daily Mean Temperature = Sum of the Temperature Observation Values/Number of Temperature Observations in a 24hr period Weeks 3-4 Average = Sum of the Daily Mean Temperature Values (Over the Weeks 3-4 Period)/Number of Days in Period Example 1: CPC's outlook shows a 60% chance of above normal temperatures in Weeks 3-4. Probability of Above Normal Temperatures = 60% Probability of Below Normal Temperatures = 40% Example 2: CPC's outlook shows an 80% chance of below normal precipitation in Weeks 3-4. Probability of Above Normal Precipitation = 20% Probability of Below Normal Precipitation = 80% Example 3: CPC's Outlook shows equal chances of above or below normal temperatures in Weeks 3-4. Probability of Above Normal Temperatures = 50% Probability of Below Normal Temperatures = 50%. Click Here to go to the Weeks 3-4 Outlook Maps Click Here to go back to the Table of Contents One Month and Three Month Rules Temperature: CPC's One Month and Three Month temperature maps show the probability of the observed temperature (the average of the daily mean temperature of all the days in the period) will be in one of three different categories: above normal, near normal and below normal. The daily mean temperature is the 24hr average of all temperature observations for a given station on a given day. The One Month Average and Three Month Average are the average of all the daily mean temperatures within either the One Month or Three Month period. Daily Mean Temperature = Sum of the Temperature Observation Values/Number of Temperature Observations in a 24hr period One Month Average = Sum of the Daily Mean Temperature Values (Over a 1-Month Period)/Number of Days in Period Three Month Average = Sum of the Daily Mean Temperature Values (Over a 3-Month Period)/Number of Days in Period Precipitation: CPC's One Month and Three Month precipitation maps show the probability that the observed precipitation (the total precipitation of all days in the period) will be in one of three different categories: above normal, near normal and below normal. Rules and Examples of Interpreting CPC's One Month and Three Month Probabilistic Outlooks 1) If the probability of "above" or "below" temperature and/or precipitation is between 33.3% and 63.4%: - Probability of the opposite category declines by the difference between the higher probability category and 33.3%. - Probability of the middle category remains at 33.3%. Example 1: CPC's outlook shows a 40% probability of above normal temperatures during the One Month period. Probability of Above Normal Temperatures = 40% Probability of Near Normal Temperatures = 33.3% Probability of Below Normal Temperatures = 100% - [40% + 33.3%] = 100% - 73.3% = 26.7% 2) If the probability of "above" or "below" temperature/precipitation is greater than 63.4%: - Probability of the opposite category reaches the minimum allowed value of 3.3% (it does not matter if the favored category is 70%, 80% or 90% as long as it is above 63.4% the opposite category will be 3.3% every time). - Probability of the middle category (near normal) decreases by the sum of "above" and "below." ***The probability of the non-favored category is NEVER zero*** Example 2: CPC's outlook shows an 80% chance of below normal precipitation during the Three Month period. Probability of Above Normal Precipitation = 3.3% Probability of Near Normal Precipitation = 100% - [80% + 3.3%] = 100% - 83.3% = 16.7% Probability of Below Normal Precipitation = 80% 3) If there are equal chances of above, below or near normal temperatures/precipitation: - The probability remains at 33.3% for all three categories (above normal, near normal and below normal). - Equal chances means that there is an equal chance of the odds tilting in any direction with no single direction being favored. Example 4: CPC's outlook shows "equal chances" of above normal, near normal or below normal temperatures during the Three Month period. Probability of Above Normal Temperatures = 33.3% Probability of Near Normal Temperatures = 33.3% Probability of Below Normal Temperatures = 33.3% 4) If the probability of near normal is greater than 33.3%: - Probability of each of the other categories decreases by half of the amount that the middle category exceeds 33.3%. Example 4: CPC's outlook shows a 35% chance of near normal temperatures during the One Month period. Probability of Near Normal Temperatures = 35% Probability of Above Normal Temperatures = 35% - 33.3% = 1.7% ---> 1.7%/2 = 0.85% ---> 33.3% - 0.85% = 32.45% (~32.5%) Probability of Below Normal Temperatures = 35% - 33.3% = 1.7% ---> 1.7%/2 = 0.85% ---> 33.3% - 0.85% = 32.45% (~32.5%) ***The near-normal category exists for the One Month and Three Month Outlooks. However it is RARELY used at these timescales.*** Click Here to go to the One Month Outlook Maps Click Here to go to the Three Month Outlook Maps Click Here to go back to the Table of Contents Tercile Examples via Visualization There are a few things the maps do not tell us: 1) Does not tell us if the favored category is possible on any given days or weeks in the period. 2) Does not tell us if the maximum or minimum temperatures lean more strongly into the favored category. 3) Does not give us the exact probability of any one point on the map. 4) Does not tell us that particular temperatures will happen or that we can expect those temperatures. 5) Does not tell us anything about the precipitation-type (i.e. snow vs. rain). 6) Does not tell us that any area will be wetter or drier than any other. 7) Does not tell us that particular precipitation totals will happen or that we can expect that precipitation. ***These are probabilistic outlooks which means these products only tell us which way the odds tilt.*** Hazardous Temperatures Outlook Hazardous Temperatures Outlook Rules Heavy Precipitation Outlook Rules Rapid Onset Drought Methodology ***Experimental*** Click Here to view CPC's 8-14 Day Hazards Interactive Map Click Here to go to the Composite Outlook Rules Click Here to go to Table of Contents Hazardous Temperatures Outlook Click Here to view CPC's 8-14 Day Hazards Interactive Map Click Here to go to the Hazardous Temperatures Outlook Rules Click Here to go to Table of Contents Click Here to view CPC's 8-14 Day Hazards Interactive Map Click Here to go to the Heavy Precipitation Outlook Rules Click Here to go to Table of Contents Click Here to view CPC's 8-14 Day Hazards Interactive Map Click Here to go to the Heavy Snow Outlook Rules Click Here to go to Table of Contents Click Here to view CPC's 8-14 Day Hazards Interactive Map Click Here to go to the High Winds Outlook Rules Click Here to go to Table of Contents - All hazards are combined on the composite map which allows users to see the potential for overlapping hazards and multiple time windows within the 8-14 day period. NOTE: Only moderate and high risk are included on the static composite map while all risk categories are displayed on the interactive map. - The composite map will also highlight areas of possible flooding and additional frozen precipitation that does NOT fall into the heavy snow category (i.e. freezing rain). Click Here to go to the Composite Outlook Click Here to view CPC's 8-14 Day Hazards Interactive Map Click Here to go to Table of Contents Hazardous Temperature Outlook Rules - Highlights areas with a slight (20%), moderate (40%) and high (60%) risk of temperatures that are deemed hazardous. - Much Below Normal = Daily minimum temperatures less than the 15th percentile and near or less than 32°F. - Much Above Normal = Daily maximum temperatures >85th percentile and 90°F or greater, or minimum temperatures greater than 80°F. - During the wind chill season (October - March) areas at risk of low wind chills may be outlined. - During the excessive heat season (April - September) areas at risk of high heat indices may be outlined. - All percentiles are in comparison to the 1991-2020 climate normal. Click Here to go to the Hazardous Temperature Outlook Click Here to view CPC's 8-14 Day Hazards Interactive Map Click Here to go to Table of Contents Heavy Precipitation Outlook Rules - Highlights areas with a slight (20%), moderate (40%) and high (60%) risk of heavy precipitation in the 8-14 day time window. - Heavy precipitation is defined as a 3-day total precipitation amount exceeding the 85th percentile and greater than 1 inch for the location and time of year. - All percentiles are in comparison to the 1991-2020 climate normal. Click Here to go to the Heavy Precipitation Outlook Click Here to view CPC's 8-14 Day Hazards Interactive Map Click Here to go to Table of Contents - Highlights areas with a slight (20%), moderate (40%) and high (60%) risk of heavy snowfall in the 8-14 day time window. - Heavy snow is defined as a 3-day total liquid equivalent precipitation amount exceeding the 85th percentile and greater than 0.5 inches for the location and time of year with temperatures that are conducive to snow. - All percentiles are in comparison to the 1991-2020 climate normal. Click Here to go to the Heavy Snow Outlook Click Here to view CPC's 8-14 Day Hazards Interactive Map Click Here to go to Table of Contents - Highlights areas with a slight (20%), moderate (40%) risk of sustained wind speeds exceeding the 85th percentile and at least 25-50 mph at any time over a 3-day period. NOTE: There is no high risk category for high winds. - All percentiles are in comparison to the 1991-2020 climate normal. Click Here to go to the High Wind Outlook Click Here to view CPC's 8-14 Day Hazards Interactive Map Click Here to go to Table of Contents Rapid Onset Drought Methodology ***Experimental*** - Rapid Onset Drought Products are experimental at this time and can be found in the 8-14 Day Composite Maps and 8-14 Day Interactive map. - This new product uses initial conditions such as antecedent dryness, and temperature and precipitation outlooks during the next 2 weeks to communicate the risk of rapidly developing drought during the next 2-3 weeks. - The primary tools used to define areas of rapidly developing drought are: 1) Abnormal Dryness (D0 on the current U.S. Drought Monitor), 2) Soil moisture below the 30th percentile (very dry soil), 3) 7-day positive temperature anomalies (warmer than normal temperatures) from the National Digital Forecast Database, 4) No precipitation forecast or forecast negative precipitation anomalies (no precipitation or below normal precipitation) from the Weather Prediction Center (WPC) and the CPC's 8-14 day outlooks, 5) Warm and/or dry conditions favored in the Week-2 outlook. Click Here to go to Heat Index Outlook Rules Click Here to go to Table of Contents Click Here to go to Wind Chill Outlook Rules Click Here to go to Table of Contents Click Here to go to Heat Index Outlook Rules Click Here to go to Table of Contents Click Here to go to Wind Chill Outlook Rules Click Here to go to Table of Contents - Issued from April 1st through September 30th. - Provides users with the probability that the heat index will be above the 1991-2020 average threshold for above-normal maximum heat index in the time range for a given location. - Dashed lines show the threshold for above-normal maximum heat index. - The shaded areas depict the probability of heat index higher than the threshold for above-normal maximum heat index during the forecast period. Click Here to go to the 6-10 Day Heat Index Outlook Click Here to go to the 8-14 Day Heat Index Outlook Click Here to go to Table of Contents - Issued from October 1st through March 31st. - Provides users with the probability that the wind chill will be below the 1991-2020 average threshold for below-normal minimum wind chill in the time range for a given location. - Dashed lines show the threshold for below-normal minimum wind chill. - The shaded areas depict the probability of wind chill lower than the threshold for below-normal minimum wind chill during the forecast period. Click Here to go to the 6-10 Day Wind Chill Outlook Drought Monitor Intensity Designations Click Here to go to Table of Contents Drought Monitor Intensity Designations D0 (Abnormally Dry) - Going into drought: short-term dryness slowing planting, growth of crops or pastures. - Coming out of drought: Some lingering water deficits; pastures or crops not fully recovered. D1 (Moderate Drought) - Some damage to crops, pastures; streams, reservoirs or wells low; some water shortage developing or imminent voluntary water use restrictions requested. D2 (Severe Drought) - Crop or pasture losses likely; water shortages common; water restrictions imposed. D3 (Extreme Drought) - Major crop/pasture losses; widespread water shortages or restrictions. D4 (Exceptional Drought) - Exceptional and widespread crop/pasture losses/fire risk; shortage of water in reservoirs, streams and wells creating water emergencies. Click Here to go to Table of Contents Click Here to go to Table of Contents The maps above show forecast drought conditions that are broken down into four categories: 1) Drought Persists (brown) 2) Drought remains but improves (i.e. going from D2 to D1) (peach) 3) Drought removal is likely (green) 4) Drought Development is likely (yellow) Tropical Hazards and Benefits Outlook Logistics - Outlook Period: Week 1 and Week 2. - Updates weekly on Tuesday. Identifies Areas Of: - Areas of potential tropical cyclone formation. - Rainfall in above average and below average categories. - Temperatures in above average and below average categories.
Temperature and Precipitation
8-14 Day Hazards
Heat Index/Wind Chill
Drought Information
Tropical Hazards and Benefits
WDTD Training Videos