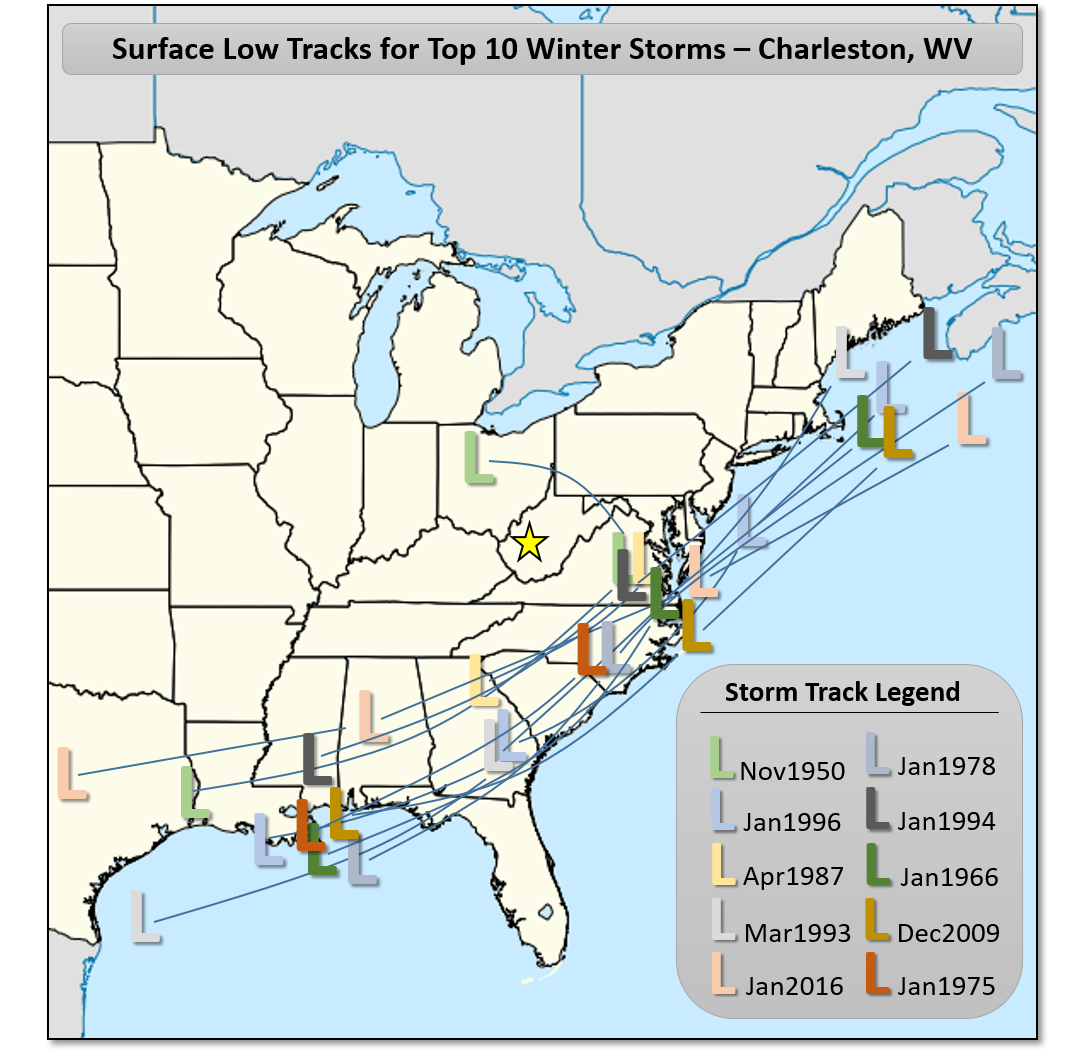
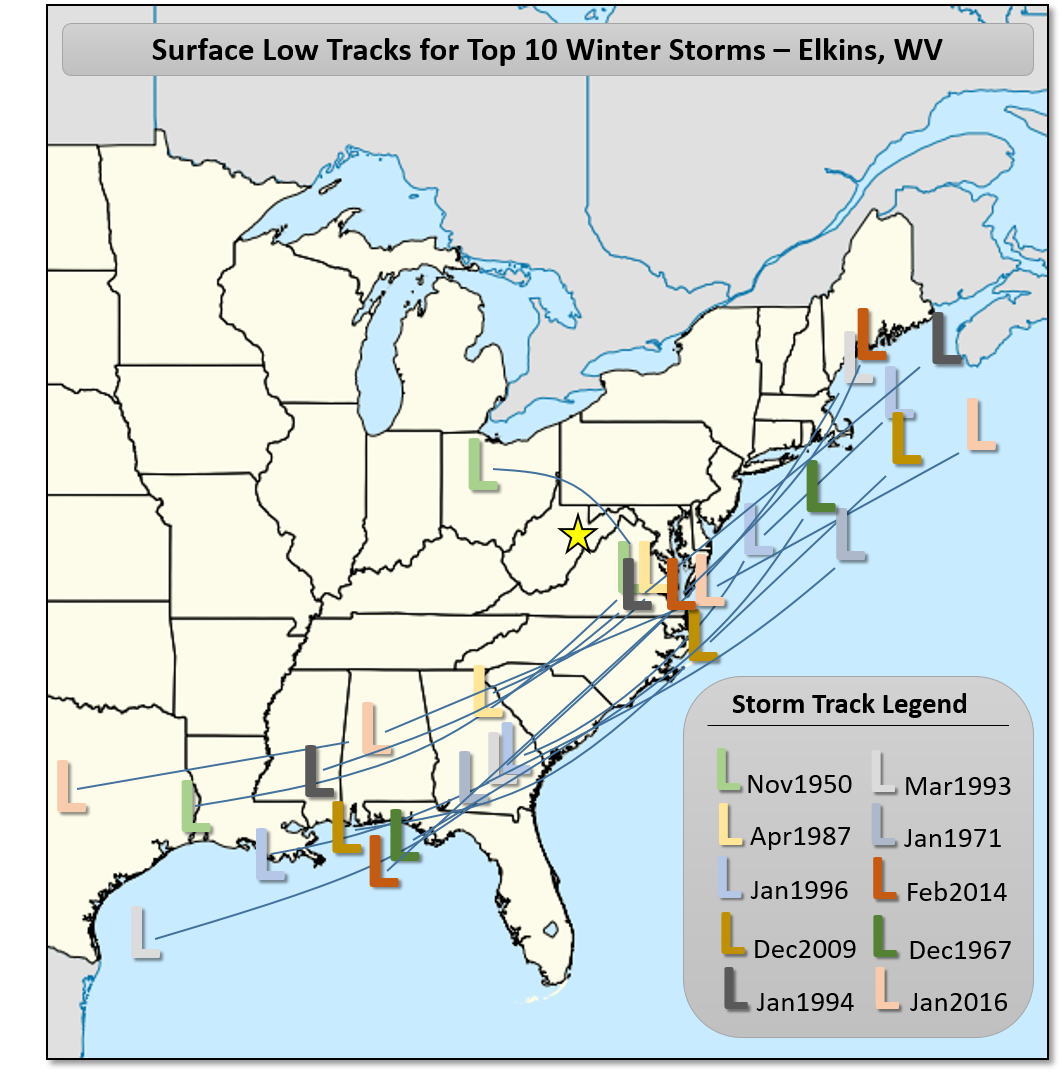
The following are the top 10 snow storms since 1950 for each official climate site in the NWS Charleston, WV County Warning Area. More detailed information for each storm, including a regional snowfall graphic and detailed meteorological analysis, can be accessed by clicking on the storms listed. Also included for each station is a composite surface low chart for the top 10 snow storms for that station.
| Charleston, WV | Huntington, WV | Parkersburg, WV | ||
| 1. 25.7" November 24-29, 1950 | 1. 22.6" March 12-14, 1993 | 1. 34.6" November 24-29, 1950 | ||
| 2. 23.3" January 6-8, 1996 | 2. 20.9" November 24-29, 1950 | 2. 20.3" March 12-14, 1993 | ||
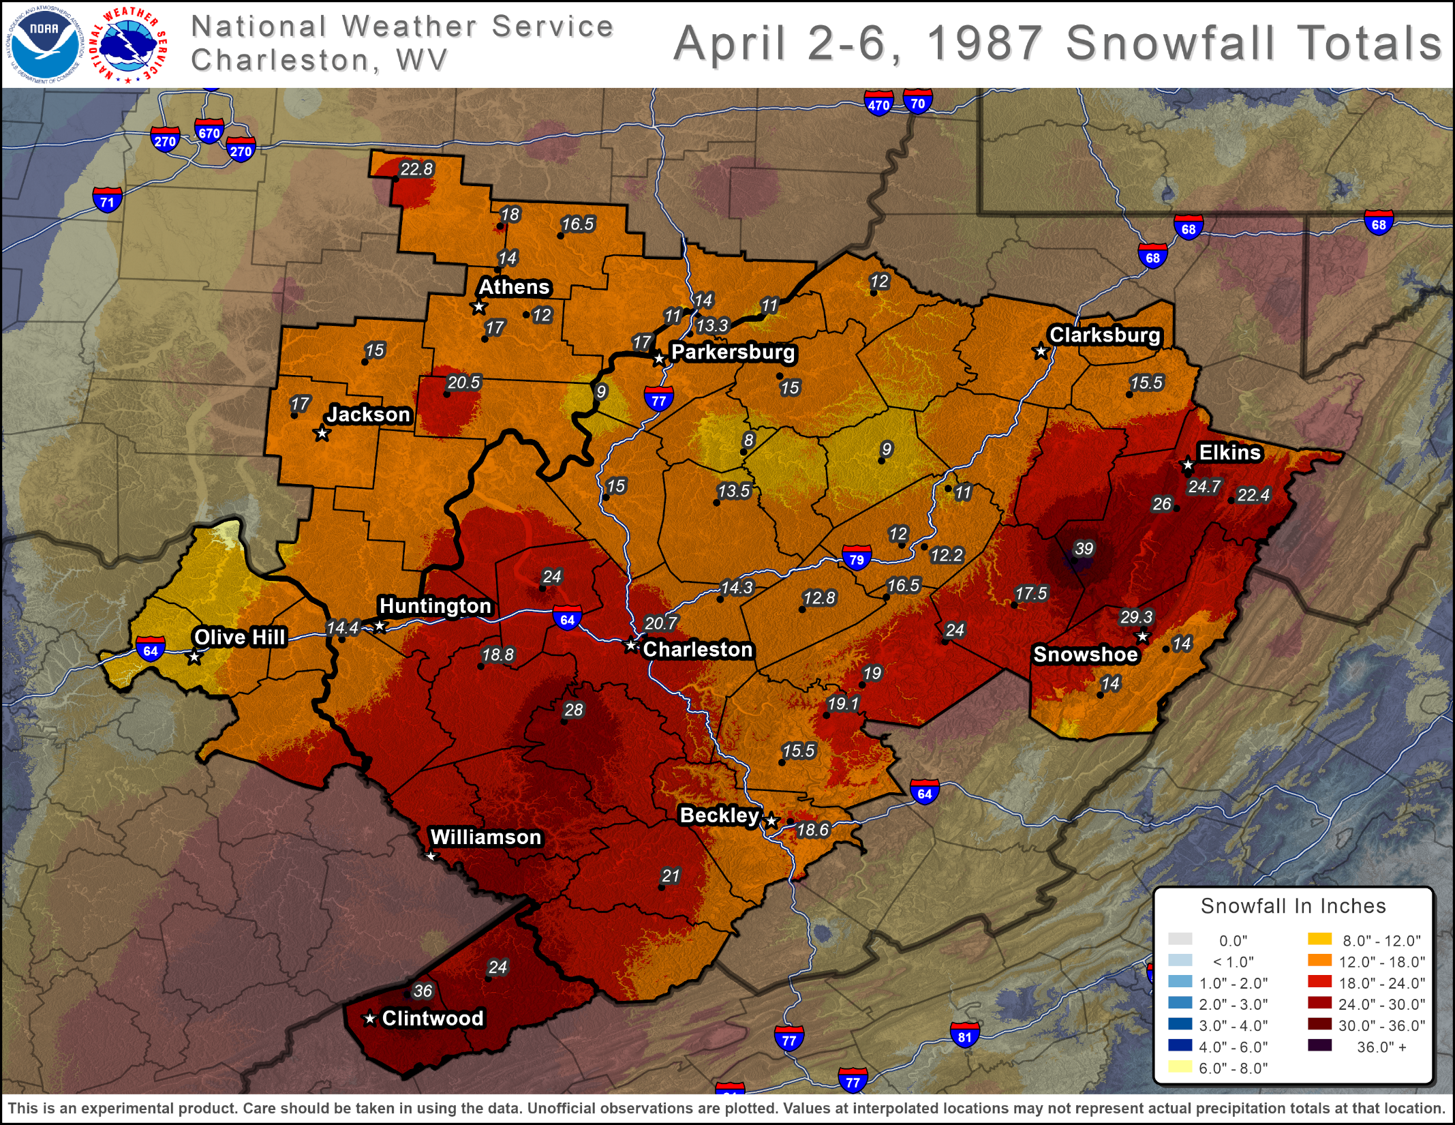
| 3. 20.7" April 2-5, 1987 | 3. 16.7" February 3-6, 1998 | 3. 18.0" January 17-18, 1994 | ||
| 4. 19.4" March 12-14, 1993 | 4. 14.4" April 2-5, 1987 | 4. 17.5" February 15-18, 2003 | ||
| 5. 18.7" January 21-23, 2016 | 5. 13.9" January 6-8, 1996 | 5. 17.0" April 2-5, 1987 | ||
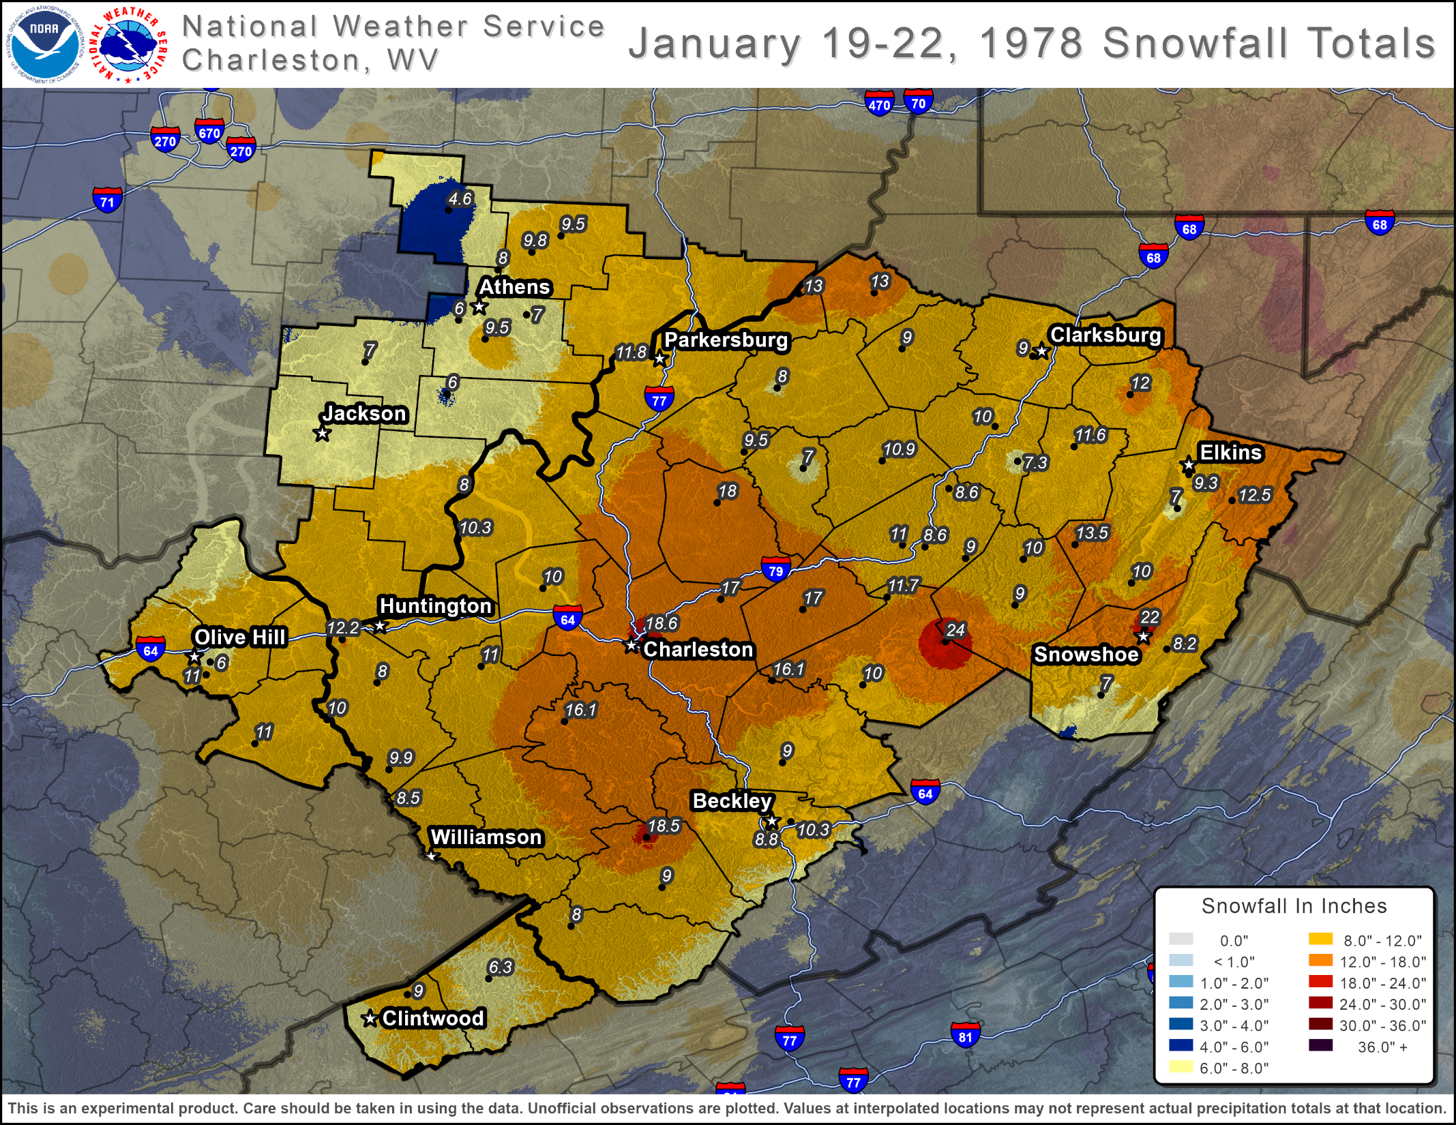
| 6. 18.4" January 19-21, 1978 | 6. 12.8" March 4-6, 2015 | 6. 15.4" January 3-5, 1994 | ||
| 7. 15.5" January 3-5, 1994 | 7. 12.2" January 19-21, 1978 | 7. 14.0" January 22-23, 1966 | ||
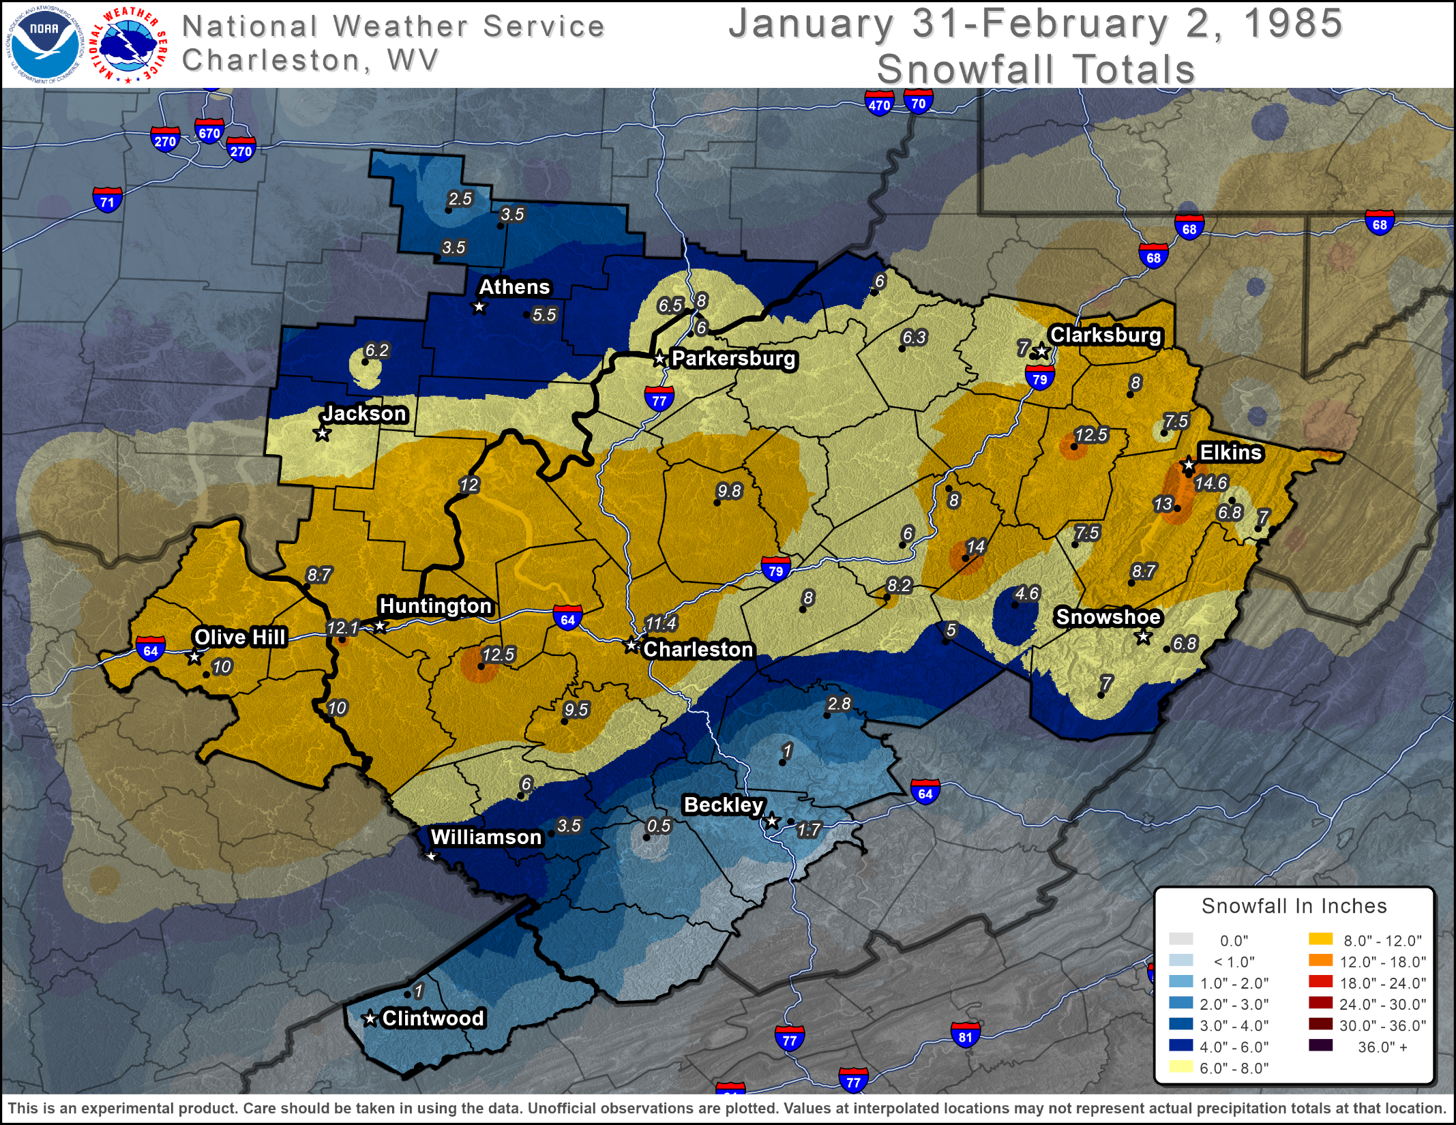
| 8. 13.5" January 22-23, 1966 | 8. 12.1" January 31-February 2, 1985 | 8. 13.0" January 21-24, 2016 | ||
| 9. 12.8" December 18-20, 2009 | 9. 11.6" January 21-23, 2016 | 9. 12.4" January 12-16, 1968 | ||
| 10. 12.6" January 12-14, 1975 | 10. 11.1" January 12-14, 1975 | 10. 11.8" January 19-22, 1978 | ||
| Surface Low Tracks - Charleston | Surface Low Tracks - Huntington | Surface Low Tracks - Parkersburg | ||
|
 |
 |
| Elkins, WV | Beckley, WV | Clarksburg, WV | ||
| 1. 34.7" November 24-29, 1950 | 1. 30.9" March 12-14, 1993 | 1. 33.0" November 24-29, 1950 | ||
| 2. 24.7" April 2-6, 1987 | 2. 27.9" December 18-20, 2009 | 2. 28.5" February 15-18, 2003 | ||
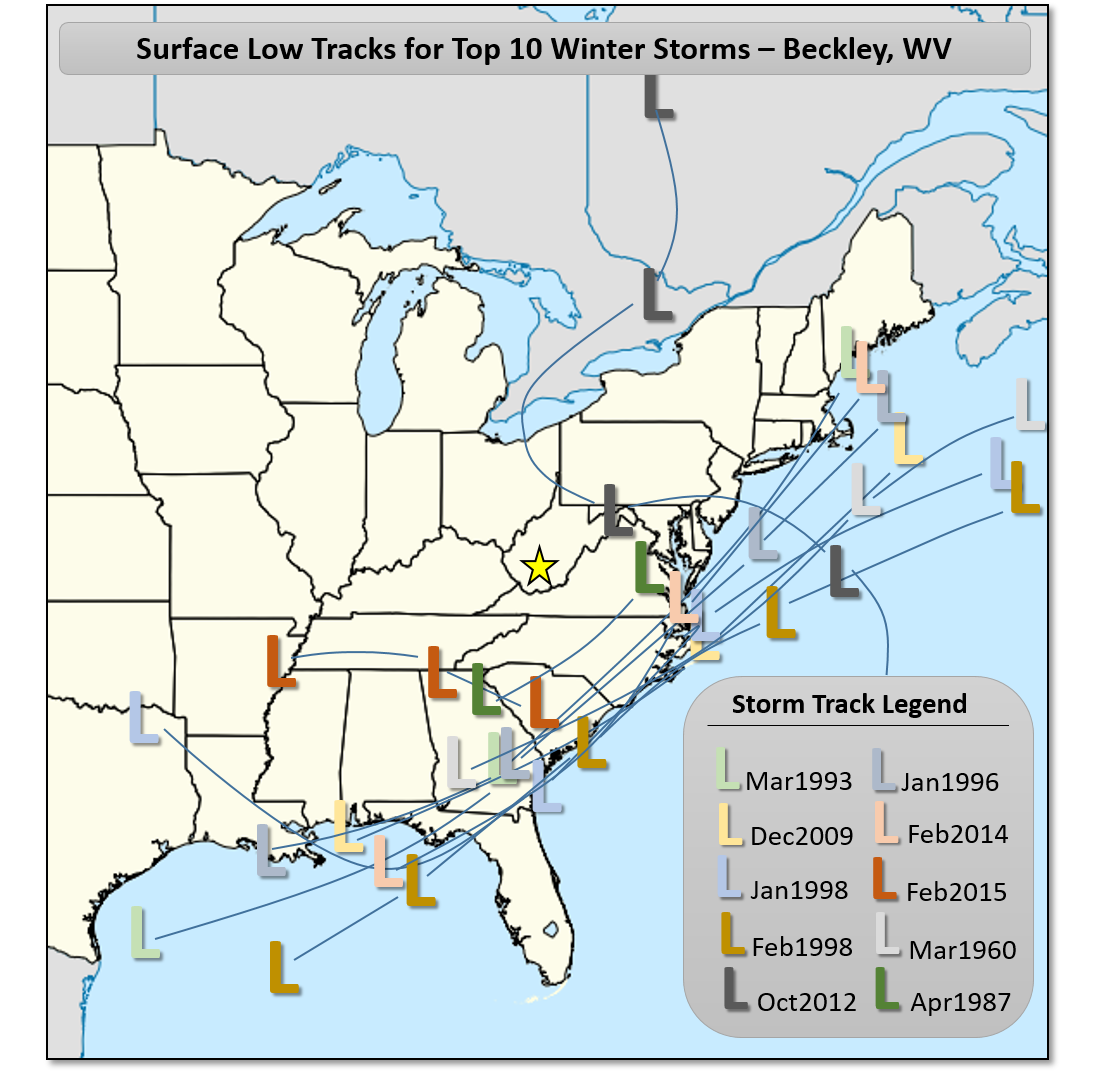
| 3. 24.6" January 6-8, 1996 | 3. 25.5" January 27-28, 1998 | 3. 26.0" January 22-24, 2016 | ||
| 4. 21.6" December 18-20, 2009 | 4. 25.3" February 3-6, 1998 | 4. 18.0" March 12-14, 1993 | ||
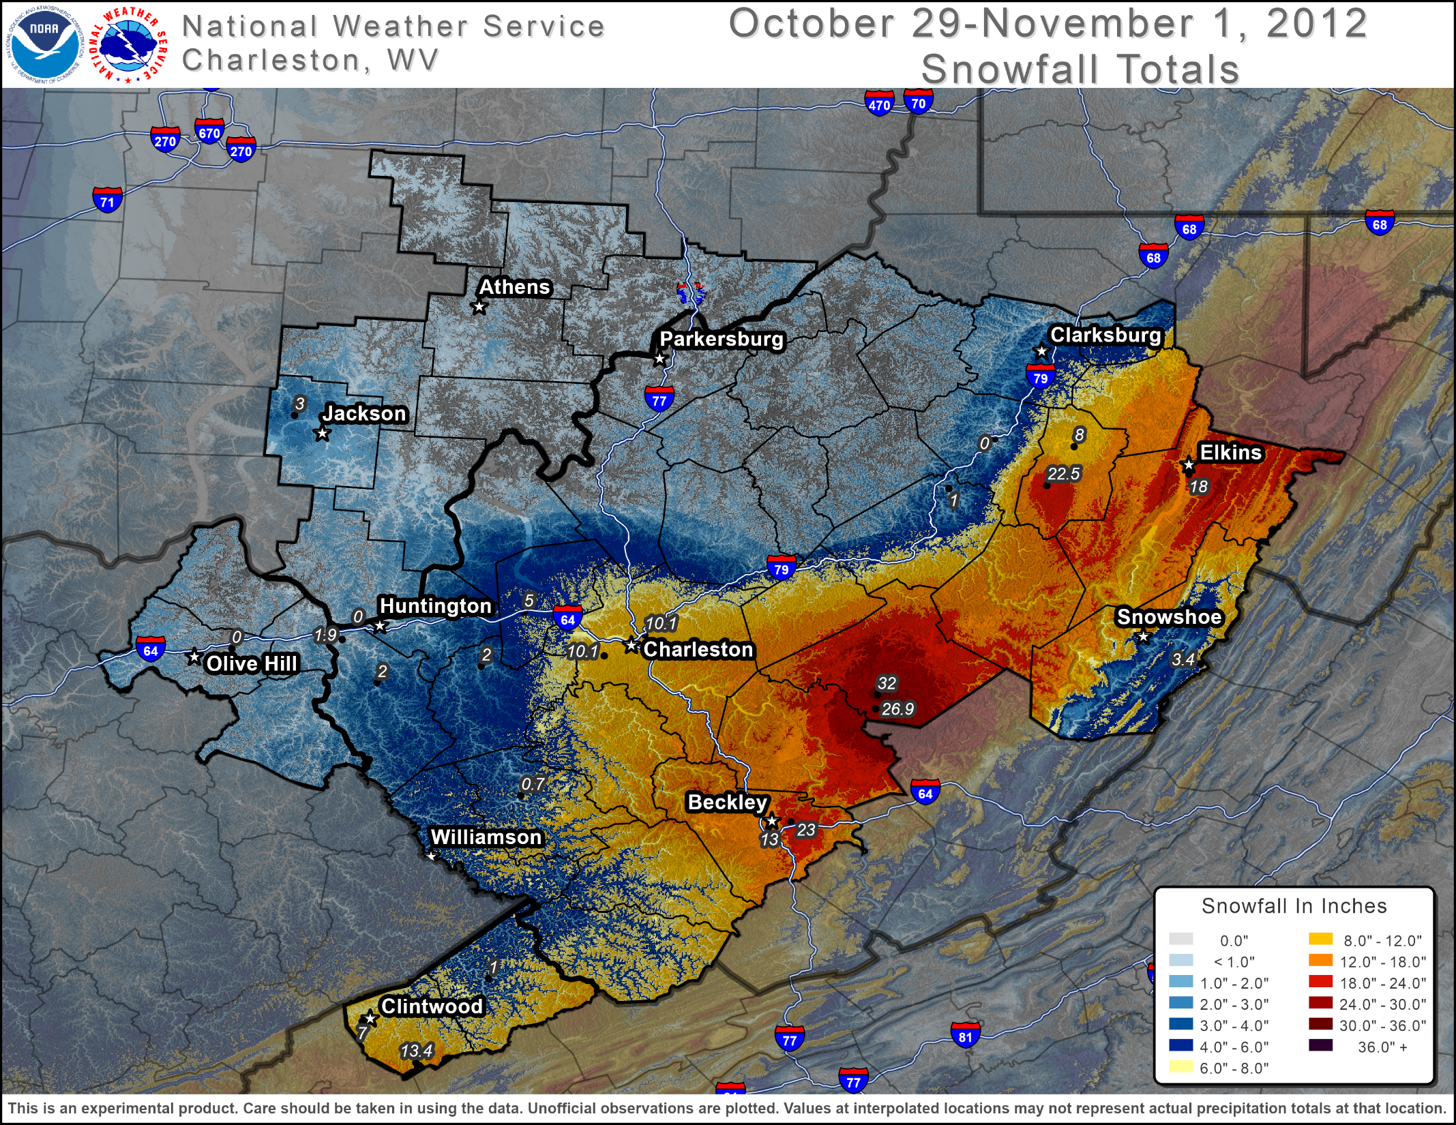
| 5. 21.1" January 3-5, 1994 | 5. 23.0" October 29-November 1, 2012 | 5. 16.0" January 6-8, 1996 | ||
| 6. 18.9" March 12-14, 1993 | 6. 22.4" January 6-8, 1996 | 6. 16.0" January 3-5, 1994 | ||
| 7. 18.7" Dec 31, 1970-Jan 1, 1971 | 7. 21.0" February 12-14, 2014 | 7. 16.0" January 22-23, 1966 | ||
| 8. 18.5" February 12-14, 2014 | 8. 20.0" February 21-22, 2015 | 8. 13.5" February 10-12, 1983 | ||
| 9. 18.0" December 28-29, 1967 | 9. 19.5" March 3-6, 1960 | 9. 13.0" December 18-20, 2009 | ||
| 10. 18.0" January 21-23, 2016 | 10. 18.6" April 2-6, 1987 | 10. 13.0" January 17-18, 1994 | ||
| Surface Low Tracks - Elkins | Surface Low Tracks - Beckley | Surface Low Tracks - Clarksburg | ||
 |
 |
 |
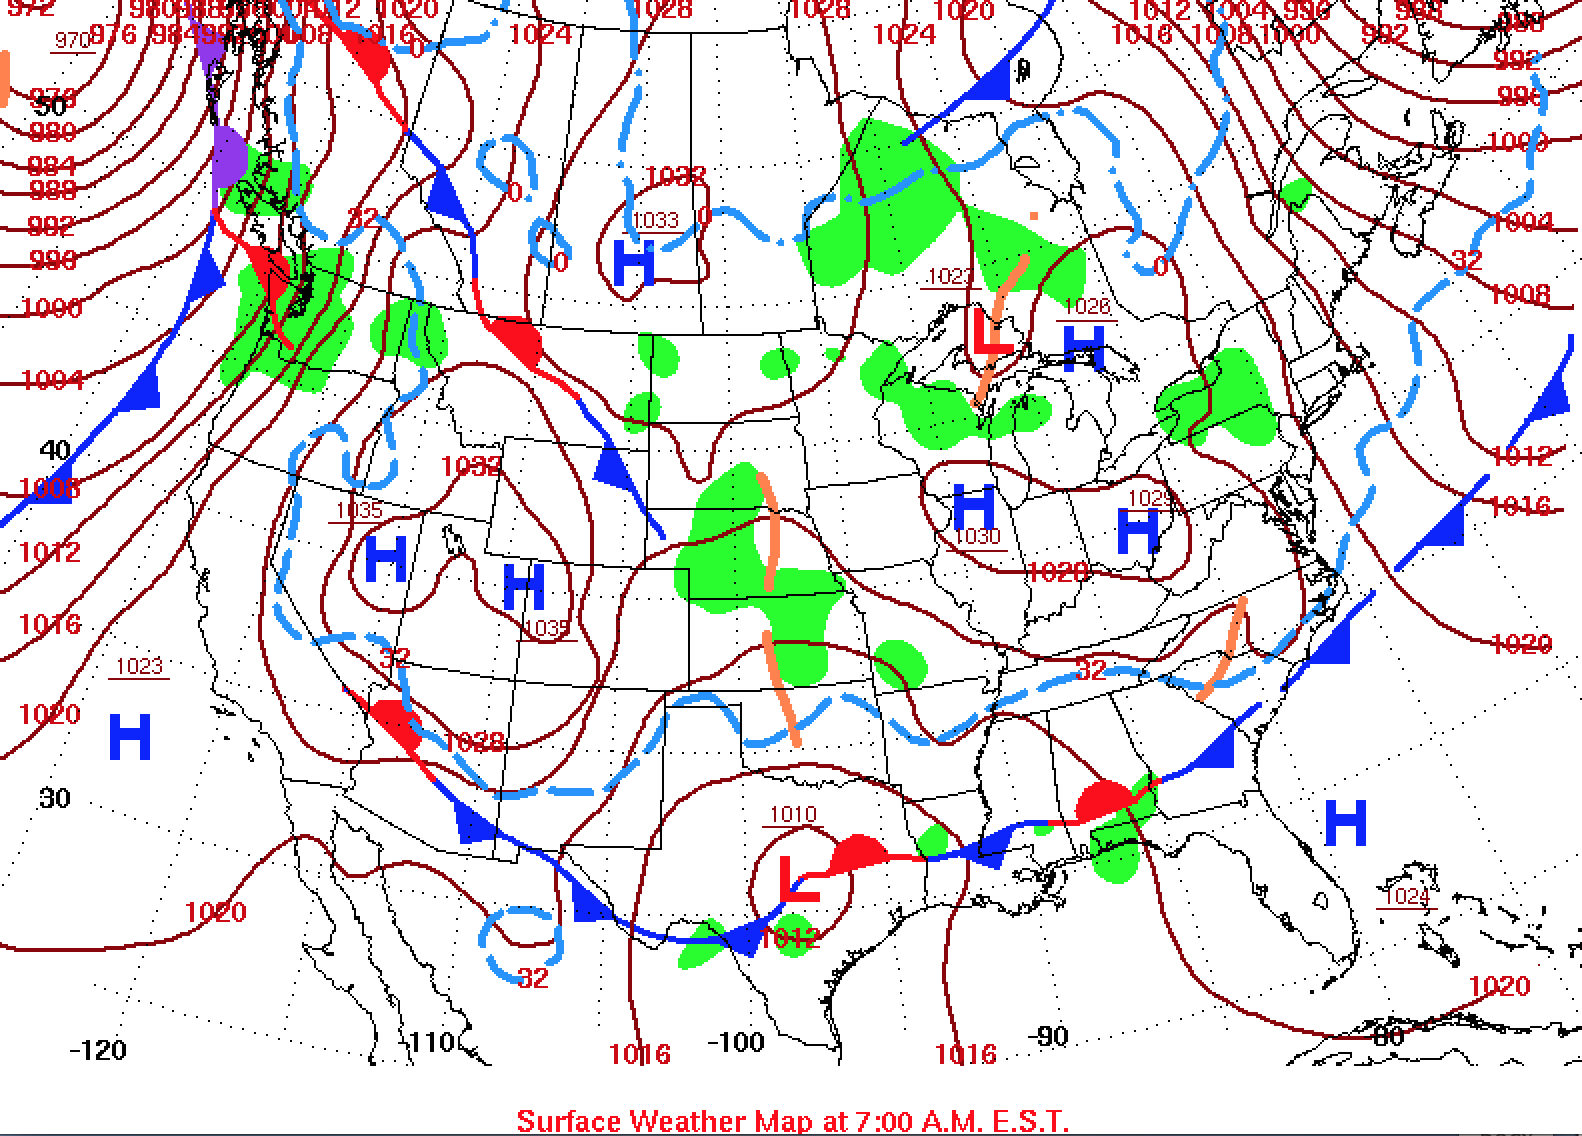
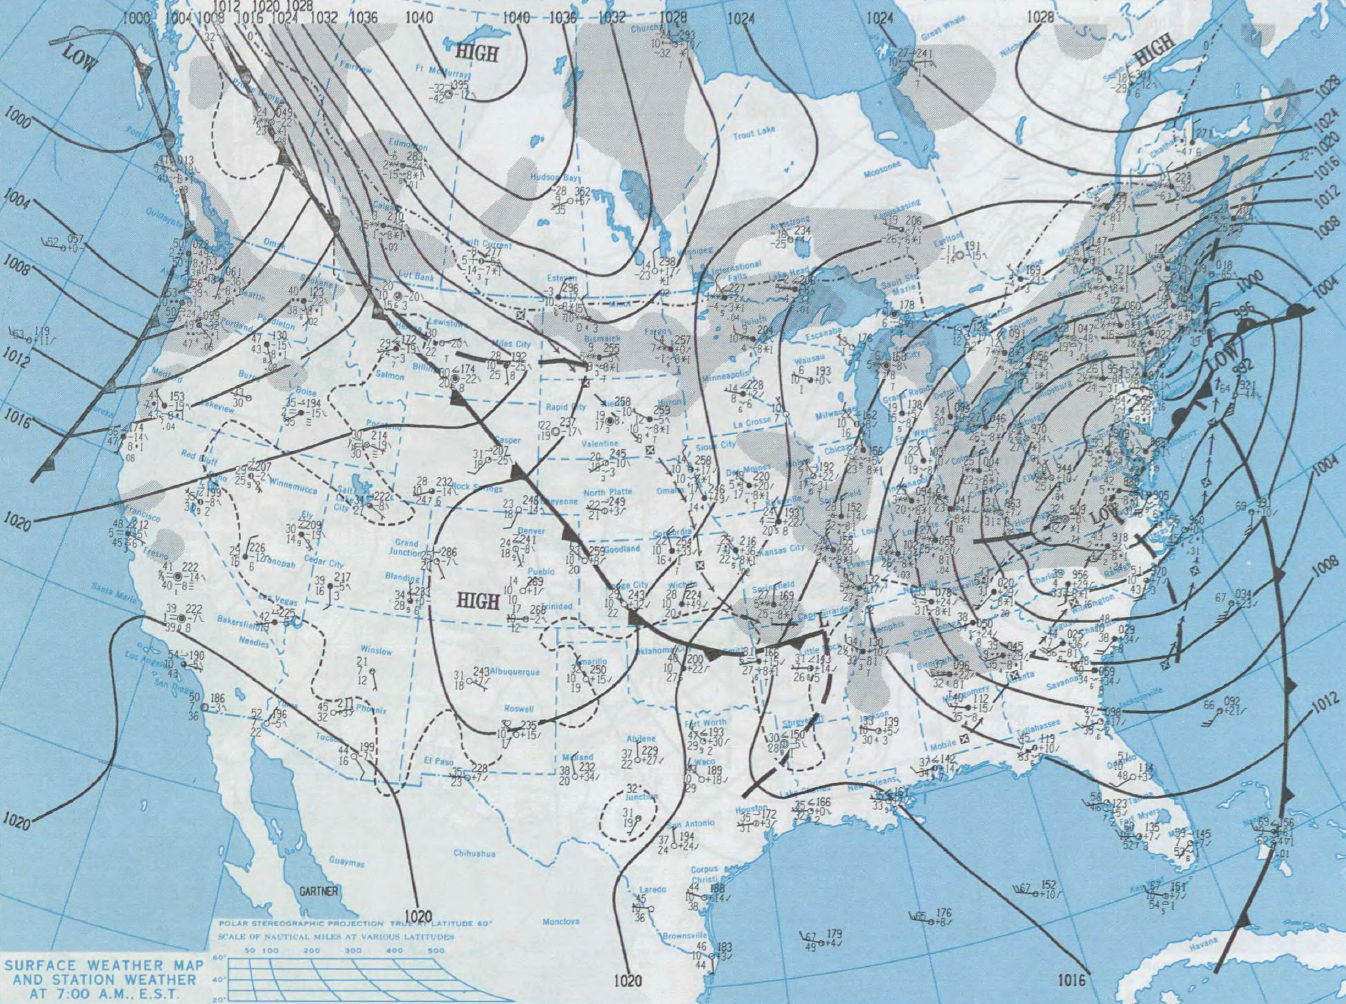
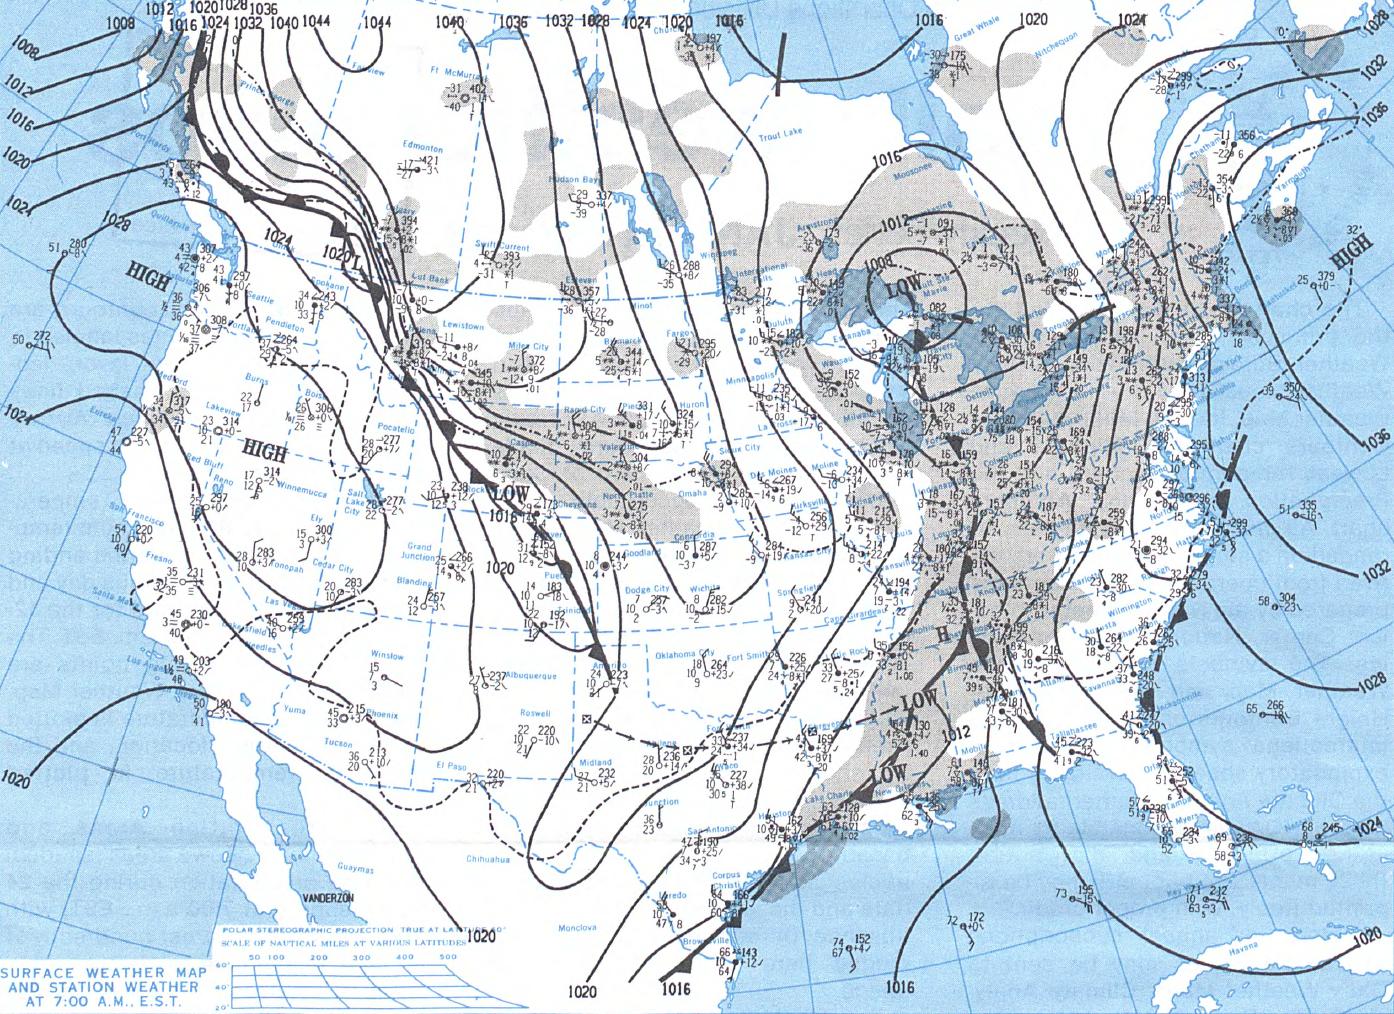
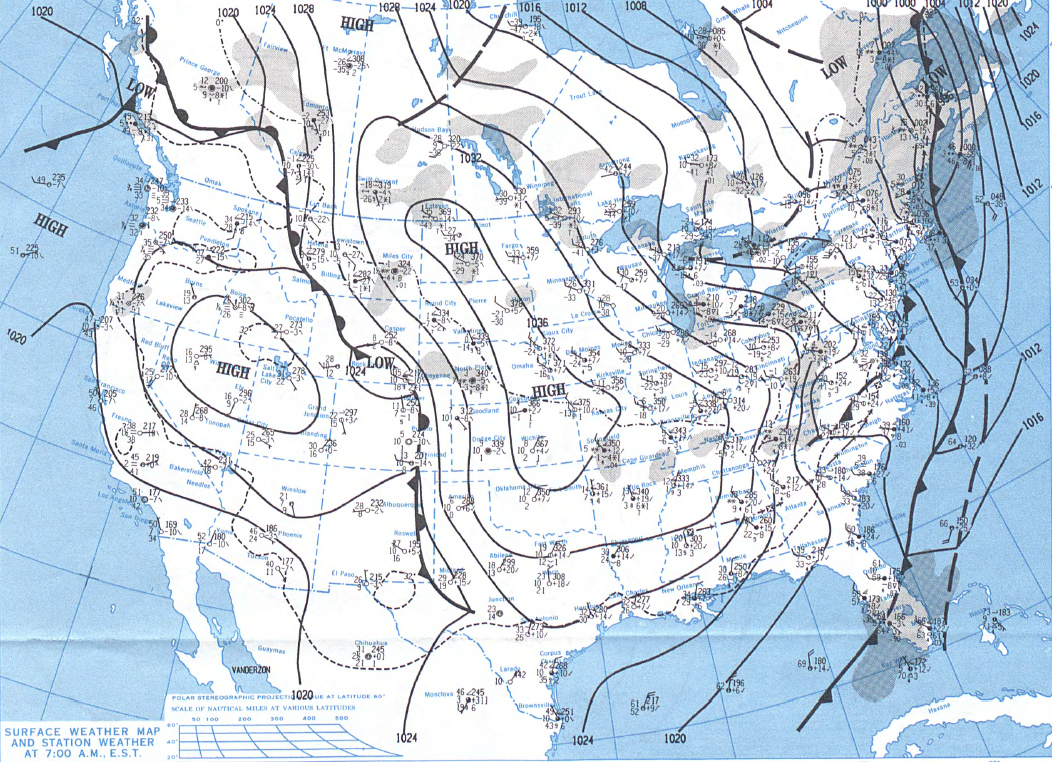
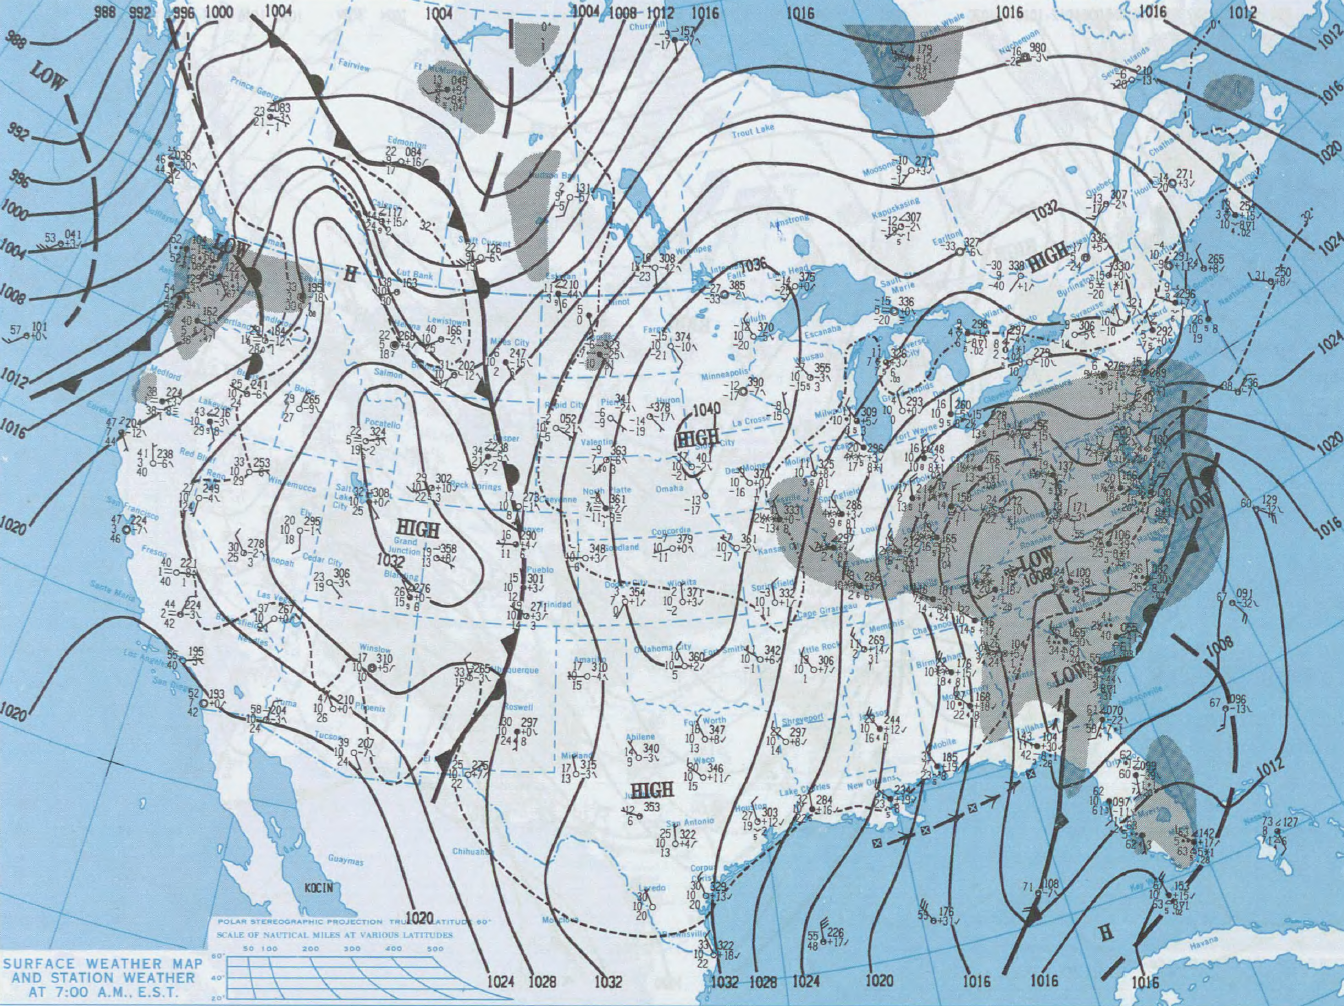
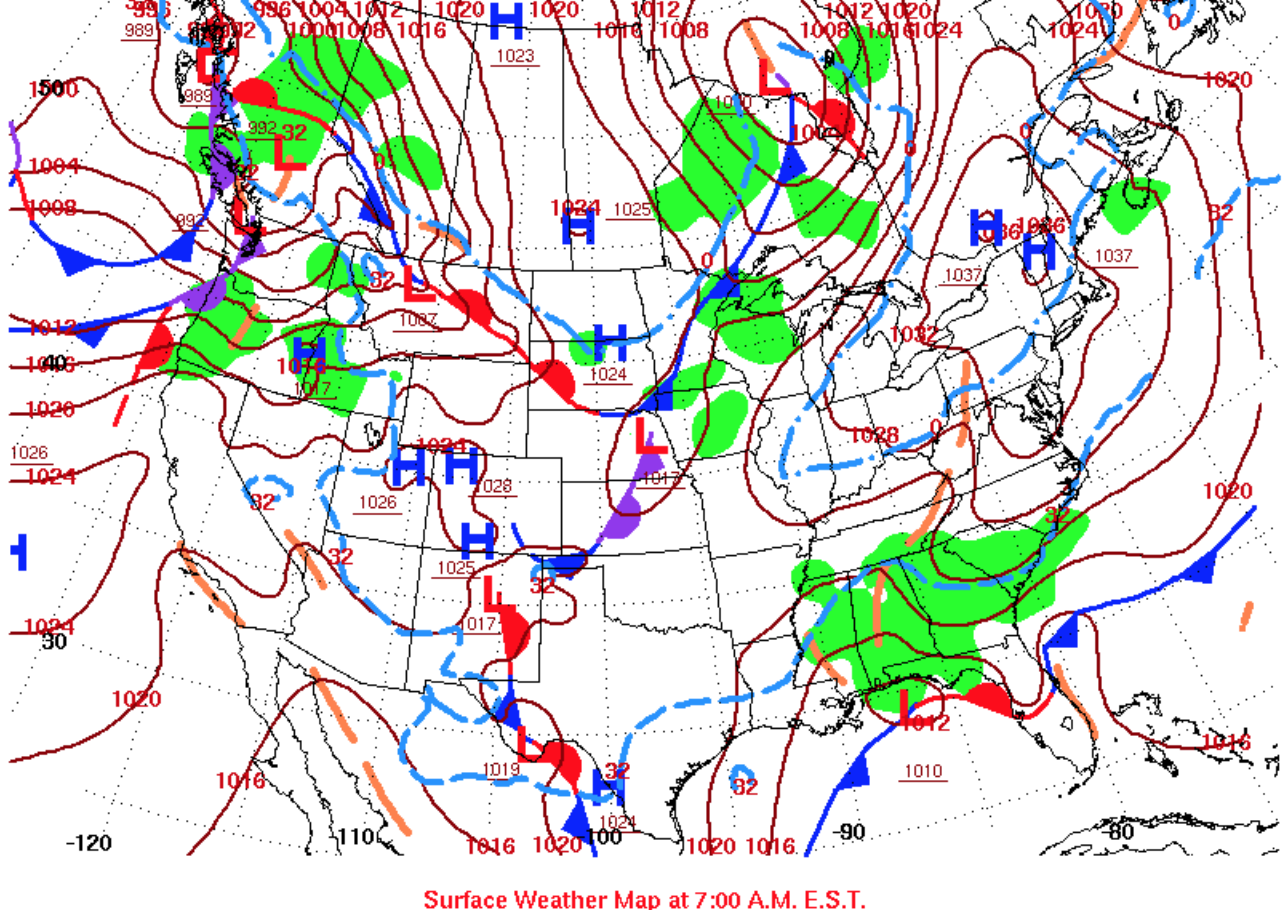
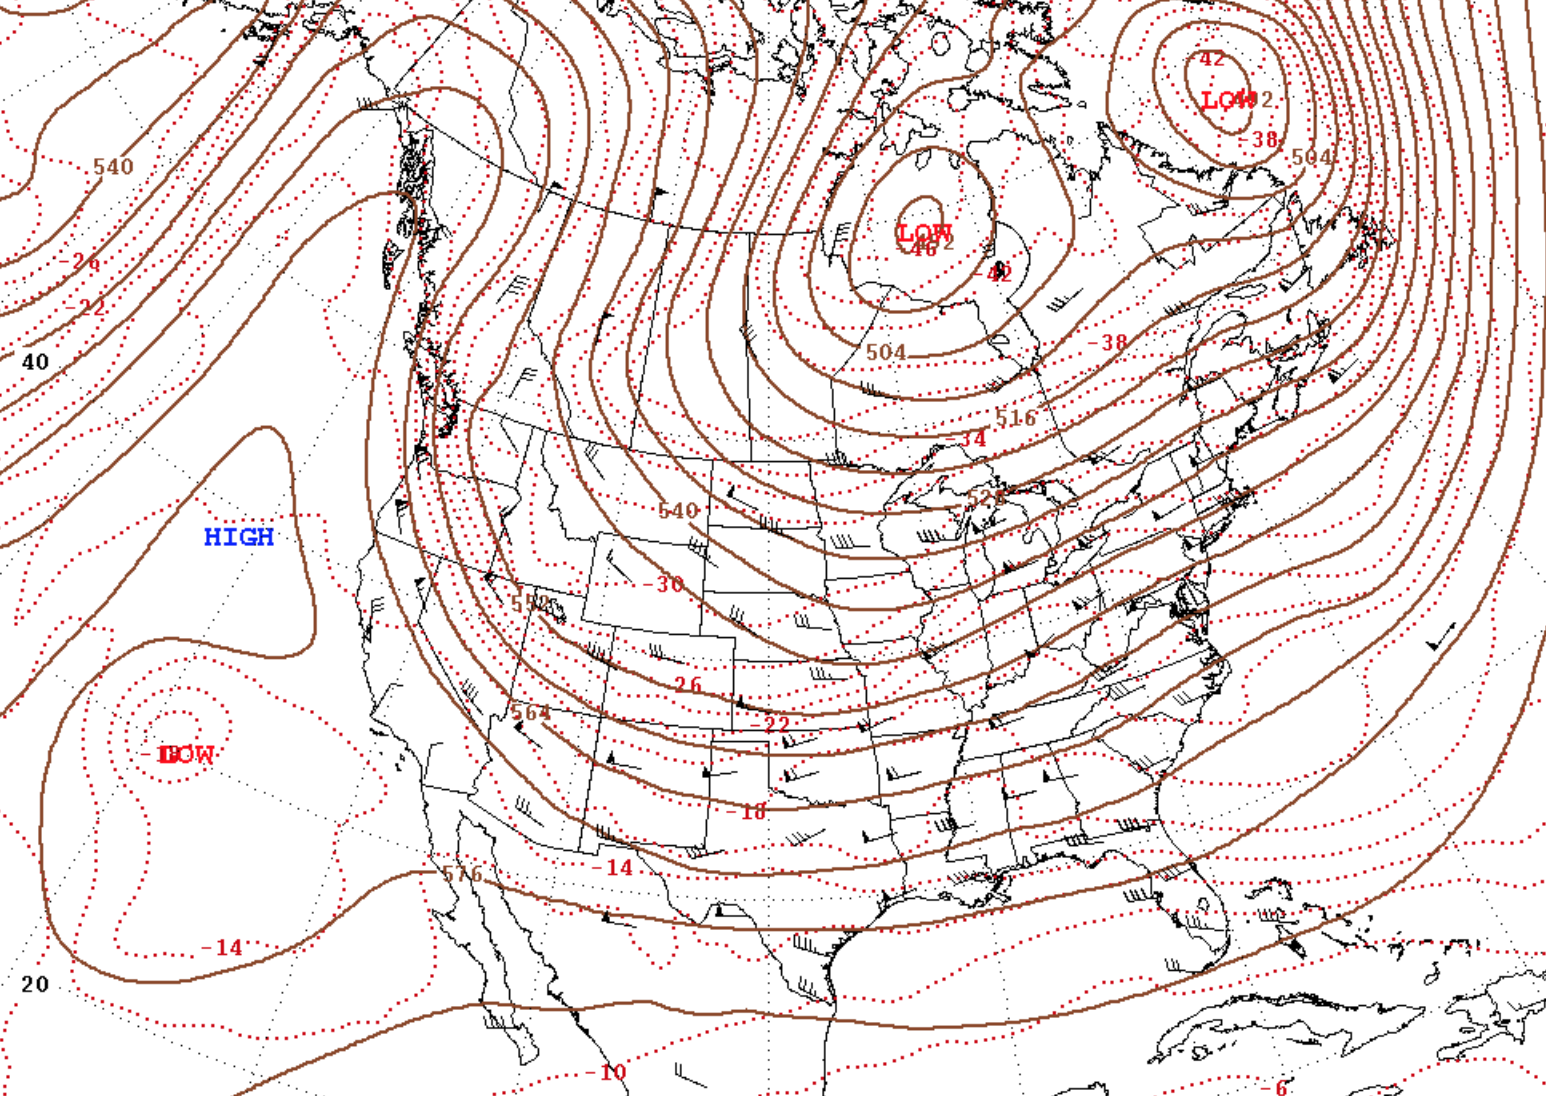
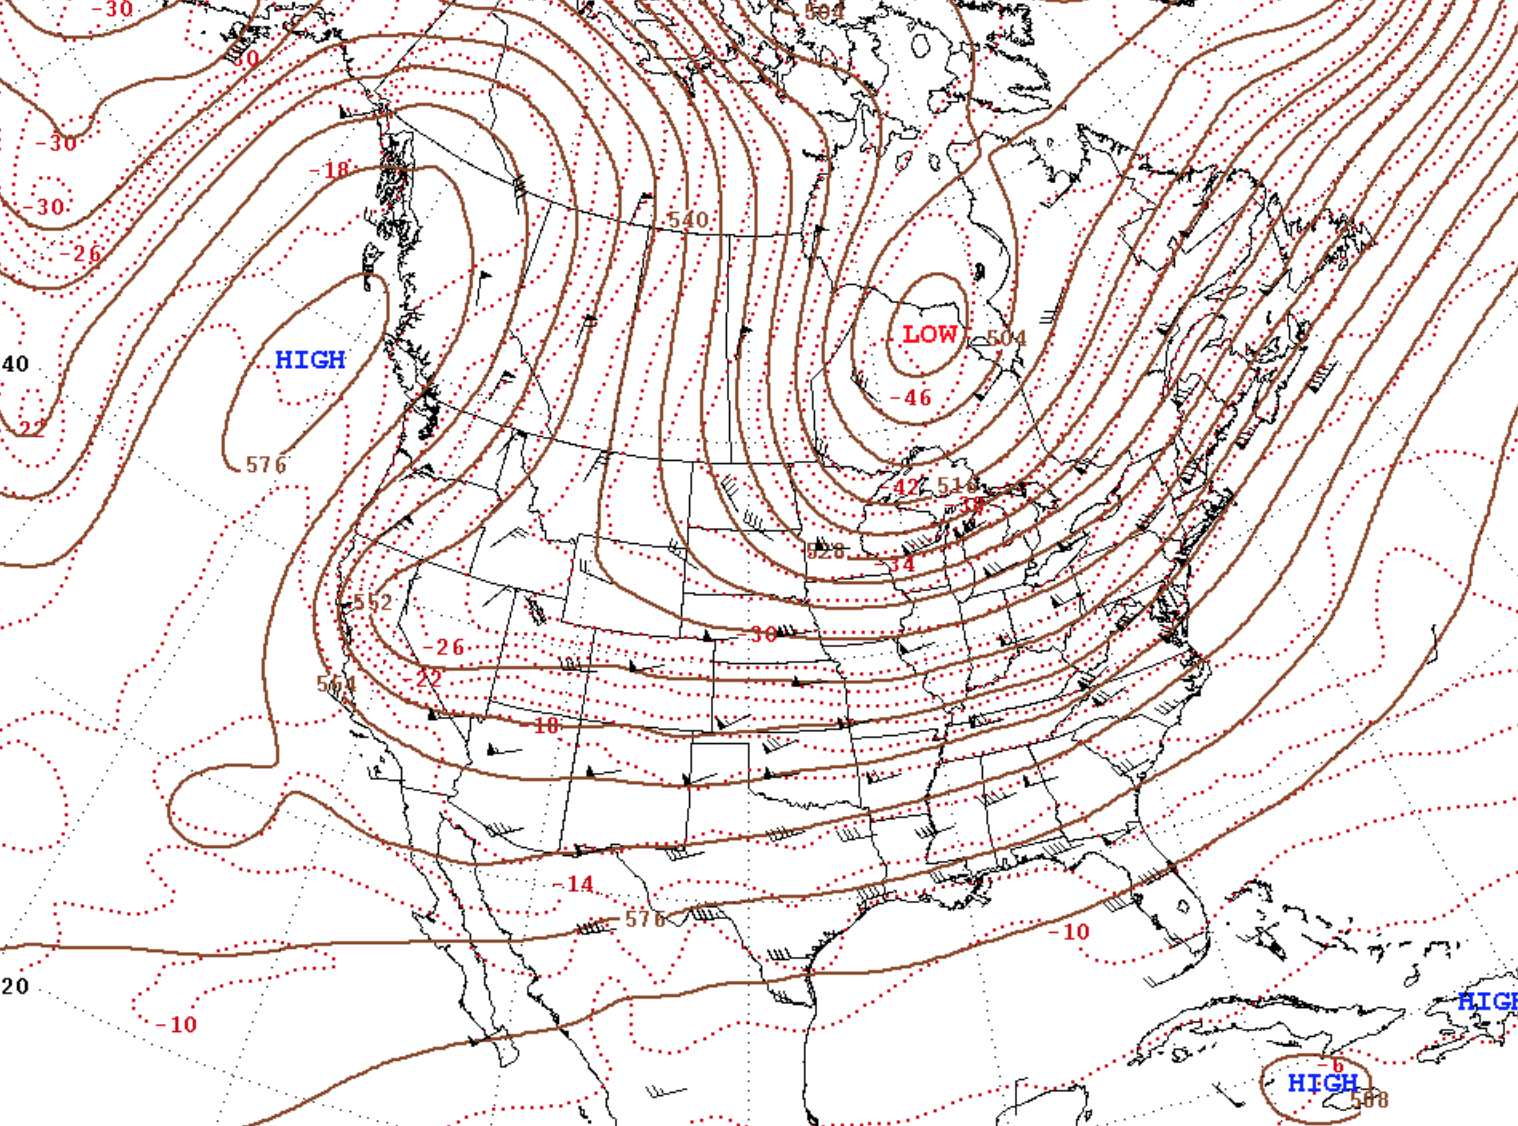
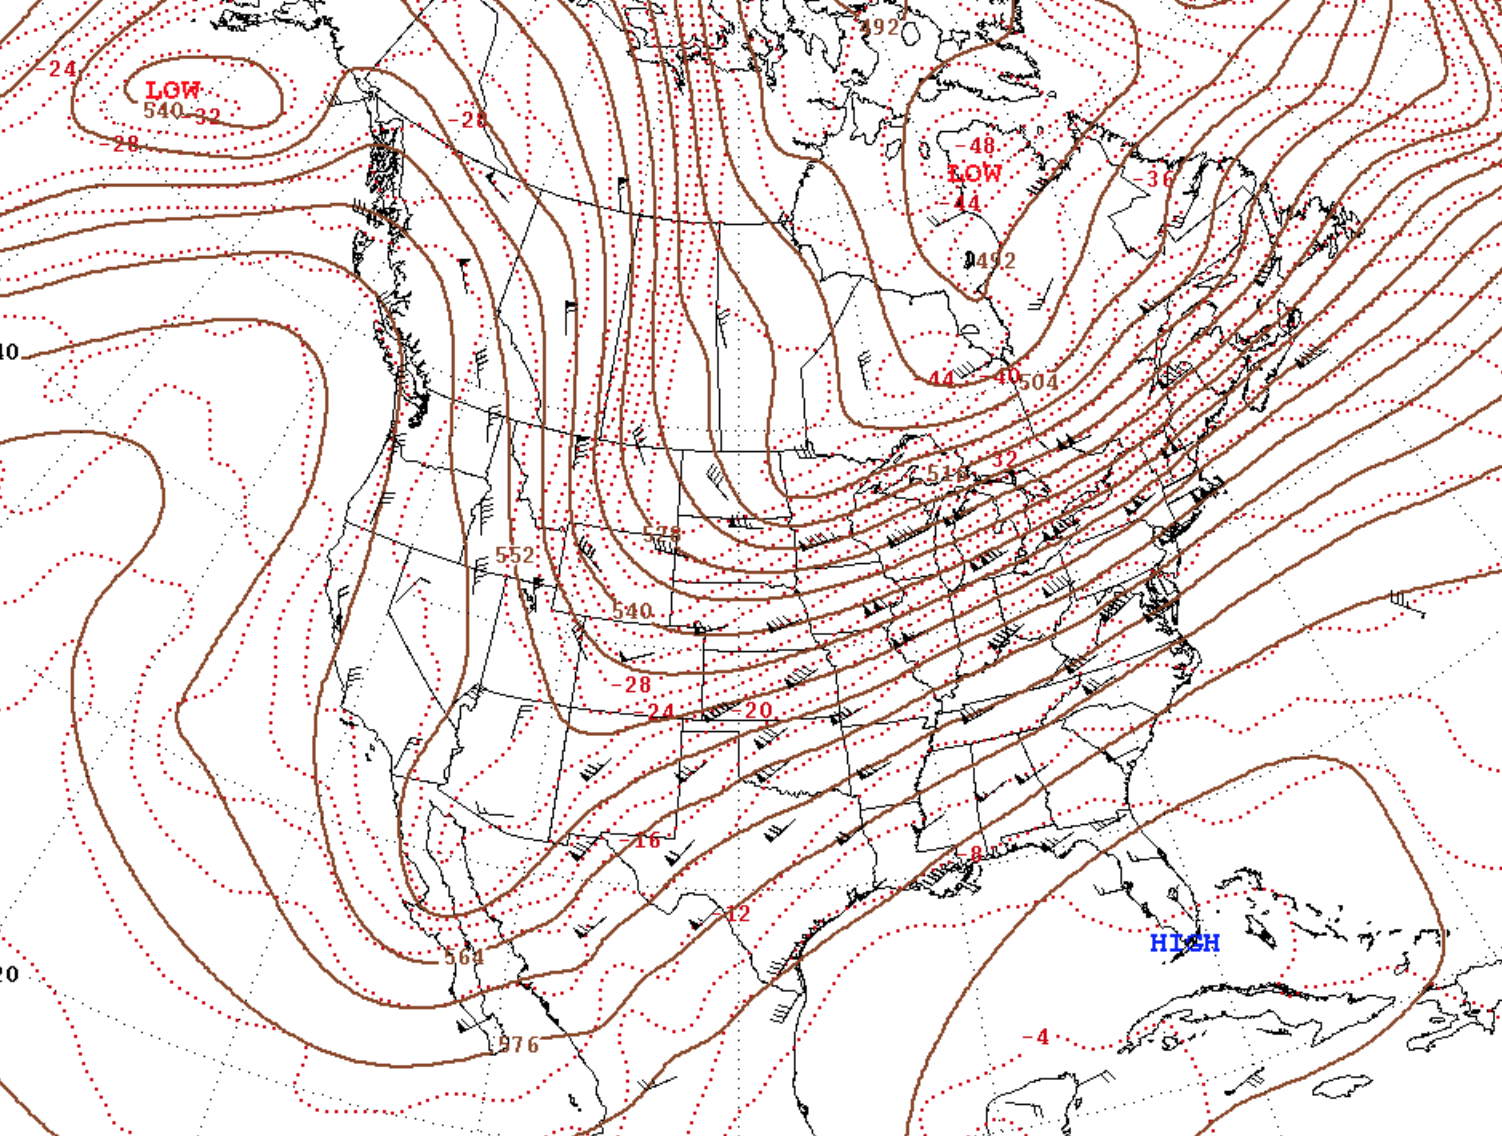
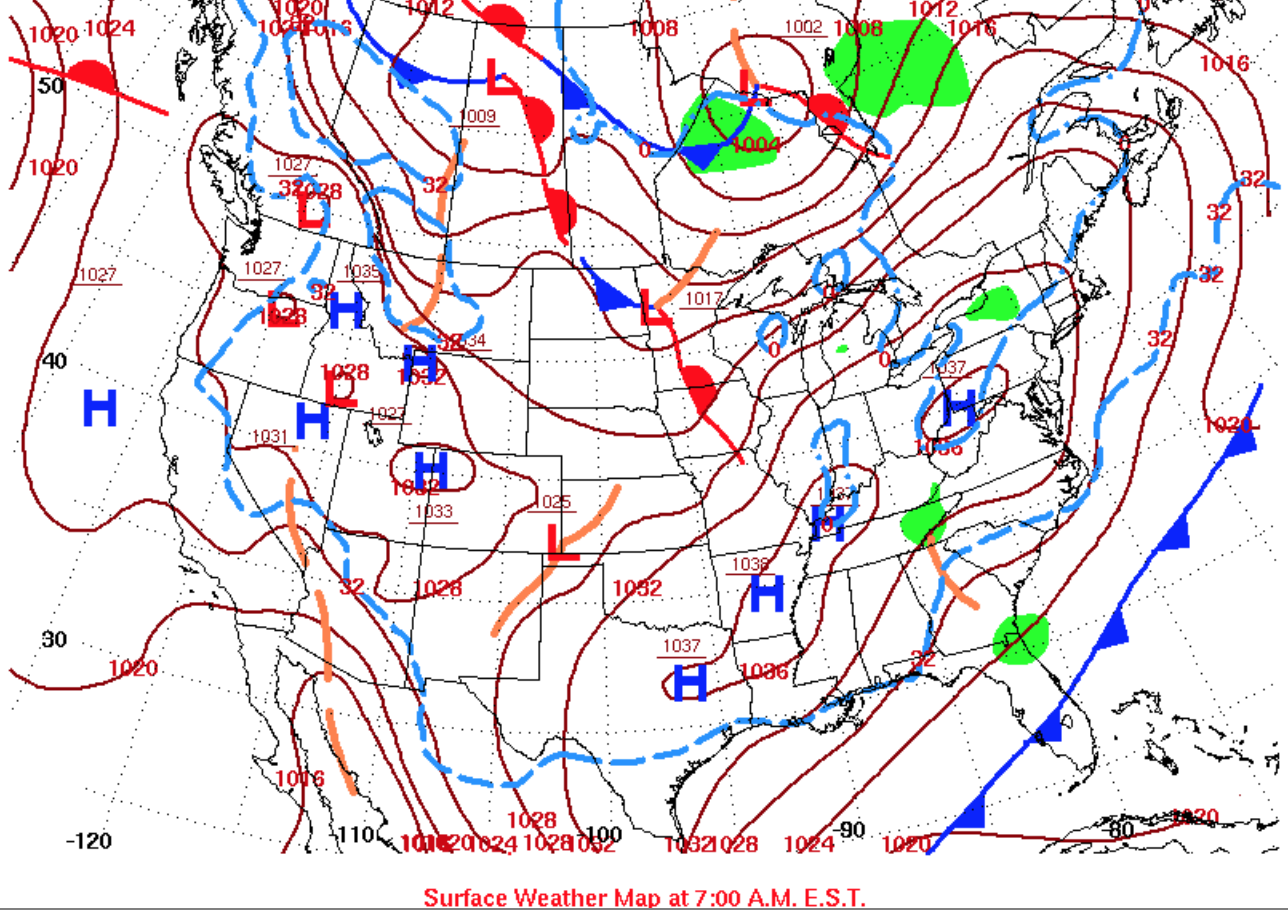
One of the most damaging and meteorologically unique winter storms to strike the eastern United States occurred on Thanksgiving weekend 1950. This slow-moving, powerful storm system is objectively the worst winter storm on record to affect the Ohio Valley. The snow fell for a week straight, with areas from western Pennsylvania southward deep into West Virginia blanketed with over 30 inches. Several locations received more than 50 inches of snow, and Coburn Creek, West Virginia, reported the greatest snowfall total—a staggering 62 inches! Strong winds along with the snow caused deep snow drifts and temperatures plummeted into the single digits. The precursor to the storm was the passage of an arctic cold front late on the 23rd into the 24th. Temperatures plunged from the 40s and 50s just ahead of the front to the teens just behind it. A thin but heavy band of snow accompanied the dramatic temperature drop behind the front. The record setting arctic airmass behind the front sent temperatures to all-time monthly lows across the Upper Midwest and Ohio Valley. Low pressure quickly developed on the arctic front over the Carolinas on the 25th. The low tracked northwestward into Ohio by midday on the 26th with a shield of heavy snow expanding back to the northwest as it did so. The storm slowly wound down as it spun in place over Lake Erie on the 27th and 28th before it finally weakened and exited into Canada on the 29th and 30th. More information on this storm can be found in the article The Great Appalachian Storm in Historical Context courtesy of the National Centers for Environmental Information. 12Z November 24, 1950 On 12Z November 24, a deep upper level trough extends southward from the Great Lakes to the Gulf Coast, bringing a blast of arctic air across the region. Meanwhile, a 110+ kt upper level jet is in place across the Southeast US, supporting upper level divergence and strong upward vertical motion throughout the Ohio Valley and central Appalachians. At the surface, low pressure in the Great Lakes pushed a sharp arctic cold front through the region, sending temperatures plummeting to well below normal values. The combination of large scale forcing for ascent and the presence of the exceptionally cold air mass led to periods of moderate to heavy snow through the afternoon and evening. Charleston received 12.6" of snow and Elkins received 11.2" on this day. 12Z November 25, 1950 On 12Z November 25, the upper level trough has shifted slightly to the east and a closed upper level low is centered right over the central Appalachians. This feature maintains strong cold air advection with 850mb temperatures dropping to values as low as -15C to -20C as shown in the 850mb analysis. The high temperature for the day in Elkins was just 10F, Charleston 12F, and Huntington 15F, each nearly 40 degrees below normal! In addition, the upper level pattern is beginning to show indications of the development of an omega-blocking pattern with strong downstream ridging around Newfoundland & Labrador and upstream ridging across the Intermountain West. Meanwhile, surface analysis reveals that low pressure is generally moving to the northeast along and ahead of the north-to-south oriented frontal boundary that stretches from the western NY and into the mid-Atlantic region. Wrap around moisture interacting with the presence of a TROWAL across the area and strong upper support contributed to continued moderate and heavy snow throughout the area. In fact, Clarksburg received a whopping 24” of snow on this day and this is the highest daily snowfall total on record. Parkersburg received 15.7", their 3rd highest daily snowfall total. 12Z November 26, 1950 Downstream and upstream ridging continues to amplify further and the upper level low remains nearly stationary from its previous position with only a slight northward movement from just 24 hours ago. Both the upper air and surface analysis show that the system is gradually becoming vertically stacked as surface low pressure retrogrades into Ohio. While 850mb temperatures have moderated slightly, they still remain at or just below -10C with highs around 20 to 25 degrees below normal for the day. In addition, snow continues as a contribution of moisture from the Atlantic and the Great Lakes pivots through the area. A combination of the upper low, moisture within the cold air advection regime, and terrain-enhanced flow was sufficient enough to produce bands of light to moderate snow through the day with many areas still receiving respectable daily snowfall totals. 12Z November 27, 1950 The weather pattern remains incredibly stagnant with upper ridging in Newfoundland & Labrador and also across the Intermountain West. As a result, the nearly stationary and increasingly occluded low pressure system continues to meander in the Great Lakes region. Highs continue to remain well below normal with values around 20 degrees Fahrenheit below normal or less. In addition, bands of light to moderate snow continue to develop around the circulation of this extremely slow moving and large upper low in the Great Lakes. The majority of the snow at this point is likely driven primarily by upslope flow in the presence of continued cold air advection and sufficient moisture/lift within the Dendritic Growth Zone. While this system did linger even several more days after this date, any additional snowfall totals were generally light and continued to be upslope dominant. 12Z November 28, 1950 Cyclonic flow is in control across the area as the system remains nearly stationary in the Great Lakes region due to the strength of the very persistent downstream blocking. As a result, the circulation around the occluded system continues to maintain upslope snow throughout the area with many locations still receiving measurable snowfall. In addition, temperatures continued to remain around 20 degrees below normal. 12Z November 29, 1950 The strong blocking upper level pattern finally started to show sings of changing by 12Z November 29. Upper air analysis shows that the upper level trough across the region started to weaken and shift eastward as persistent downstream ridging in eastern Canada started to break down and also shifted further east. However, with cold air advection still continuing with 850mb temperatures at -10C or lower and the flow still favorable for upslope precipitation, many areas did still experience another day of measurable snow, but daily totals were certainly on a decreasing trend. While there were indications that this slow-moving and powerful storm system was finally coming to an end, this storm remains widely known as “The Great Appalachian Storm of 1950” for its historic snowfall and impacts across the central Appalachians and Ohio Valley.
Overview
Analysis


In early March 1960, a prolonged period of exceptionally cold temperatures and daily snowfall accumulation was attributed to a combination of a brutally cold air mass in the northern Plains and a major nor’easter moving up the East Coast. On March 3rd, a low pressure system in the Ohio Valley merged with a secondary low across the southeast US, which eventually became the dominant low as this low moved up the coast. Given the brutally cold temperatures in place ahead of the arrival of this system, conditions were favorable for significant snowfall across much of the area and amounts of 8 to 12 inches were observed for areas near the I-79 corridor and 1 to 2 foot totals were common in the WV mountains with even some isolated locations receiving as much as 3 feet. The relatively slow northward movement of this system tracking up the East Coast as well as the deep feed of arctic air from the north led to a prolonged stretch of measurable snowfall as the city of Beckley recorded at least 3 consecutive days from the 3rd to the 5th where amounts exceeded 4 inches with daily high temperatures stuck in only the teens. 12Z March 3, 1960 At 12Z March 3, surface analysis shows an area of low pressure across the Ohio Valley, which is associated with an upper level trough that extends from the Upper Midwest towards the Gulf Coast. Meanwhile, a secondary area of low pressure develops across the Southeast US and lifts to the NNE through the day. Eventually, these two features merge together as the area of low pressure across the Southeast US becomes the dominant low. In addition, an exceptionally cold airmass begins to build into the area as surface high pressure builds southward from the Northern Plains. With temperatures around 20 degrees below normal as Beckley reached a high of just 27 degrees, widespread moderate to heavy snow occurred throughout the area as moisture advection increased throughout the day. 12Z March 4, 1960 At 12Z March 4, the aforementioned low pressure system is moving northeastward offshore of the coast of New England. Meanwhile, a massive surface high across the Northern Plains continues to build into the area with strong cold air advection occurring across the central Appalachians and Ohio Valley. In fact, 850mb temperatures between -15C to -20C are present throughout the region and Beckley reached a high of just 18 degrees; 30 degrees below normal. With moisture wrapping around the departing low and additional contribution from the Great Lakes in the presence of an exceptionally cold airmass, numerous bands of snow developed throughout the day in the upslope flow regime. By the end of the day, Beckley received 4 inches of snow and additional snow would fall in the coming days. 12Z March 5, 1960 Upslope flow continues by 12Z March 5 as strong cold air advection maintains frigid 850mb temperatures between -15C to -20C. In addition, bands of light to moderate snow continue to impact the region throughout the day due to lingering moisture and orographic lift. As a result, Beckley received an additional 4.5” by the end of the day. 12Z March 6, 1960 While the prolonged period of upslope snow continued by 12Z March 6, the massive arctic high continues to approach the Ohio Valley and central Appalachians so precipitation coverage and intensity decreased. In addition, despite temperatures remaining well below normal, this airmass did help to bring drier air into the region by the end of the day and precipitation eventually tapered off.
Overview
Analysis


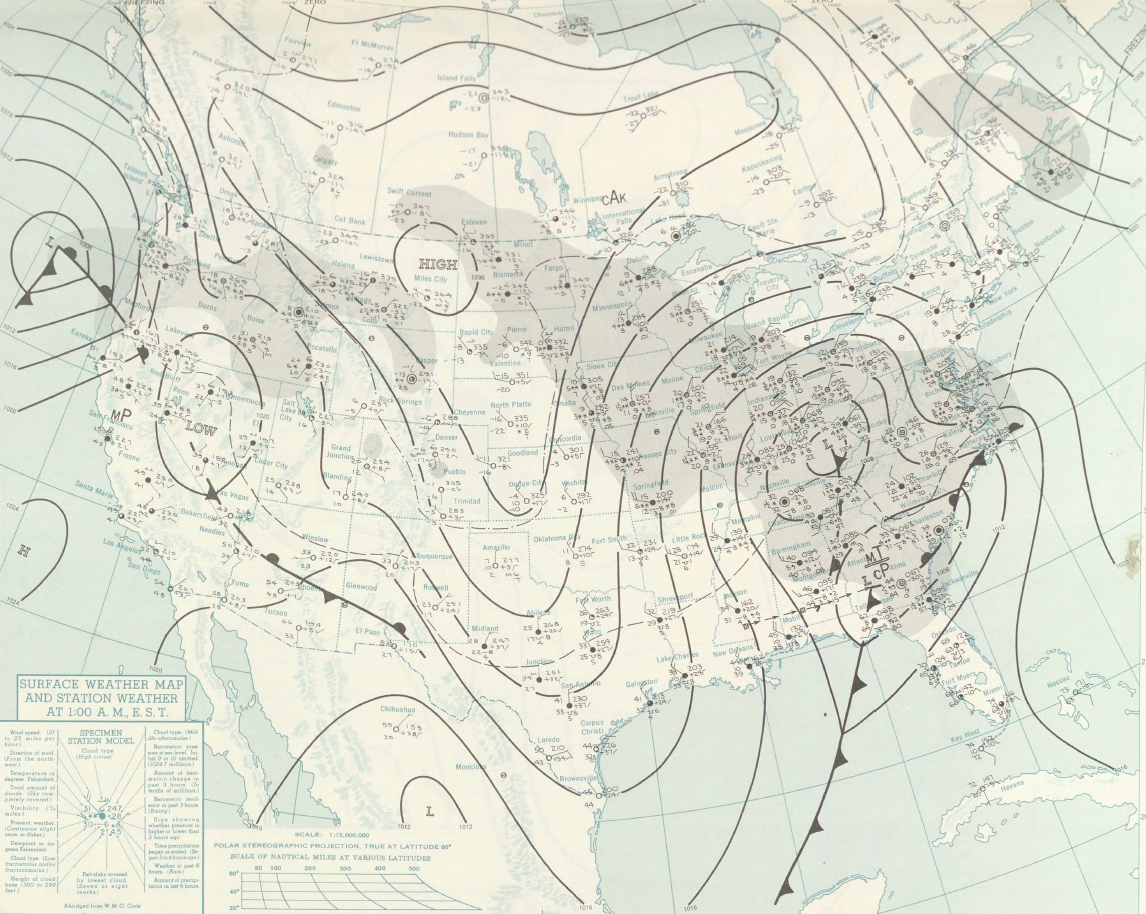


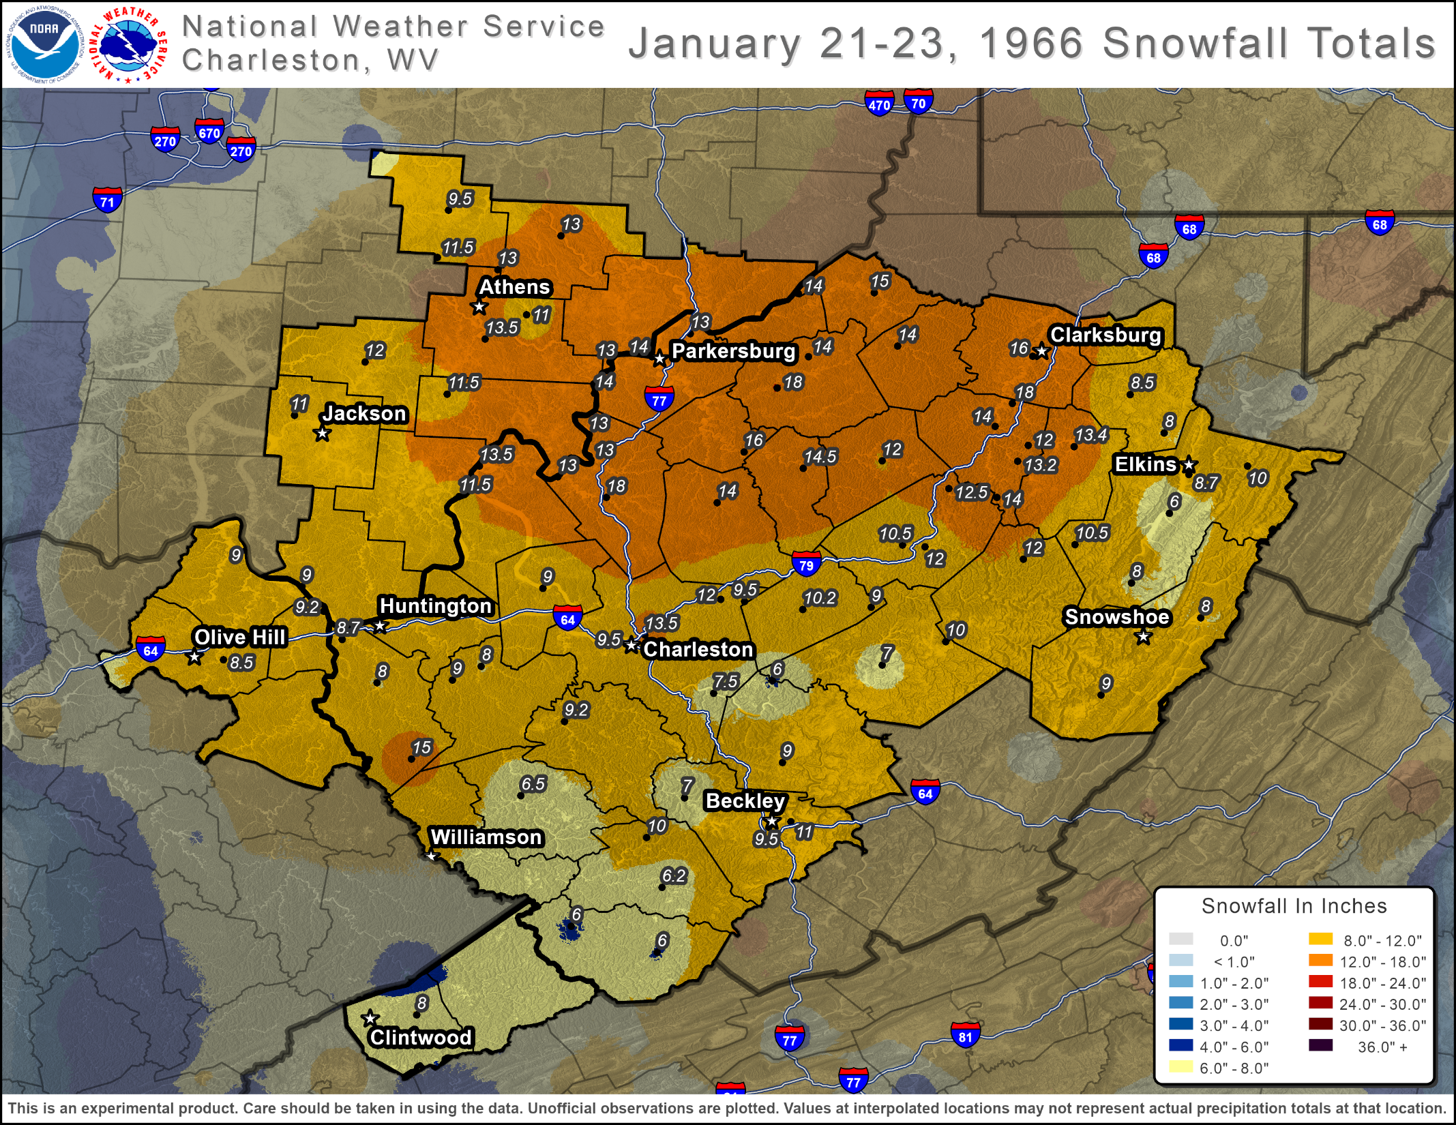
A low pressure system that initially developed in the Gulf of Mexico on January 22nd quickly became a strong nor’easter in the following days as it strengthened and moved northeastward along the East Coast. The storm deposited very heavy snow to the west of the system across a large area stretching as far south as the Tennessee Valley and as far north as the interior Northeast and much of New England. Due to the track of this storm and the location of embedded bands of heavier snow that developed, the greatest snow totals with this system across the region occurred right in the middle Ohio Valley rather than the mountains. By the end of the event, a foot to a foot and a half totals were common across much of north central WV and portions of southeast OH and 8 to 12 inches occurred for much of the remainder of the area. 12Z January 22, 1966 At 12Z January 22, upper air analysis shows a broad mid/upper level trough across the central US and a 130+ kt jet streak is in place across the southeast US. With upper level divergence in the right entrance region of the jet streak, and a potent shortwave moving through the base of the trough, strong upward vertical motion is present in the Gulf of Mexico and cyclogenesis is occurring. The surface low will move to the northeast through the day along the east side of the upper trough, and precipitation greatly increased in coverage across the Ohio Valley and central Appalachians by the end of the day. Parkersburg received 13" of snow and Clarksburg received 11†of snow on this day. 12Z January 23, 1966 The entire region is in a favorable environment for large scale ascent due to strong jet dynamics and shortwave support. As a result, the surface low continues to deepen as it moves northeastward along the east coast and a TROWAL to the northwest of the system’s track supports widespread snow throughout the region. While accumulations were less than the previous day, Clarksburg still received and appreciable 5†of snow. The snow did taper off by the end of the day as the low pressure system continued to move further northward along the coast and high pressure eventually built into the area. 12Z January 24, 1966 By 12Z January 24, the low pressure system has moved further offshore into the North Atlantic, but even colder air continues to filter into the area with as 850mb temperatures drop as low as -15C. Given the continued cold air advection and northwest flow, upslope snow continued through the day with additional snow accumulation across the area. However, any additional snow accumulations were minor and impacts become more localized.
Overview
Analysis


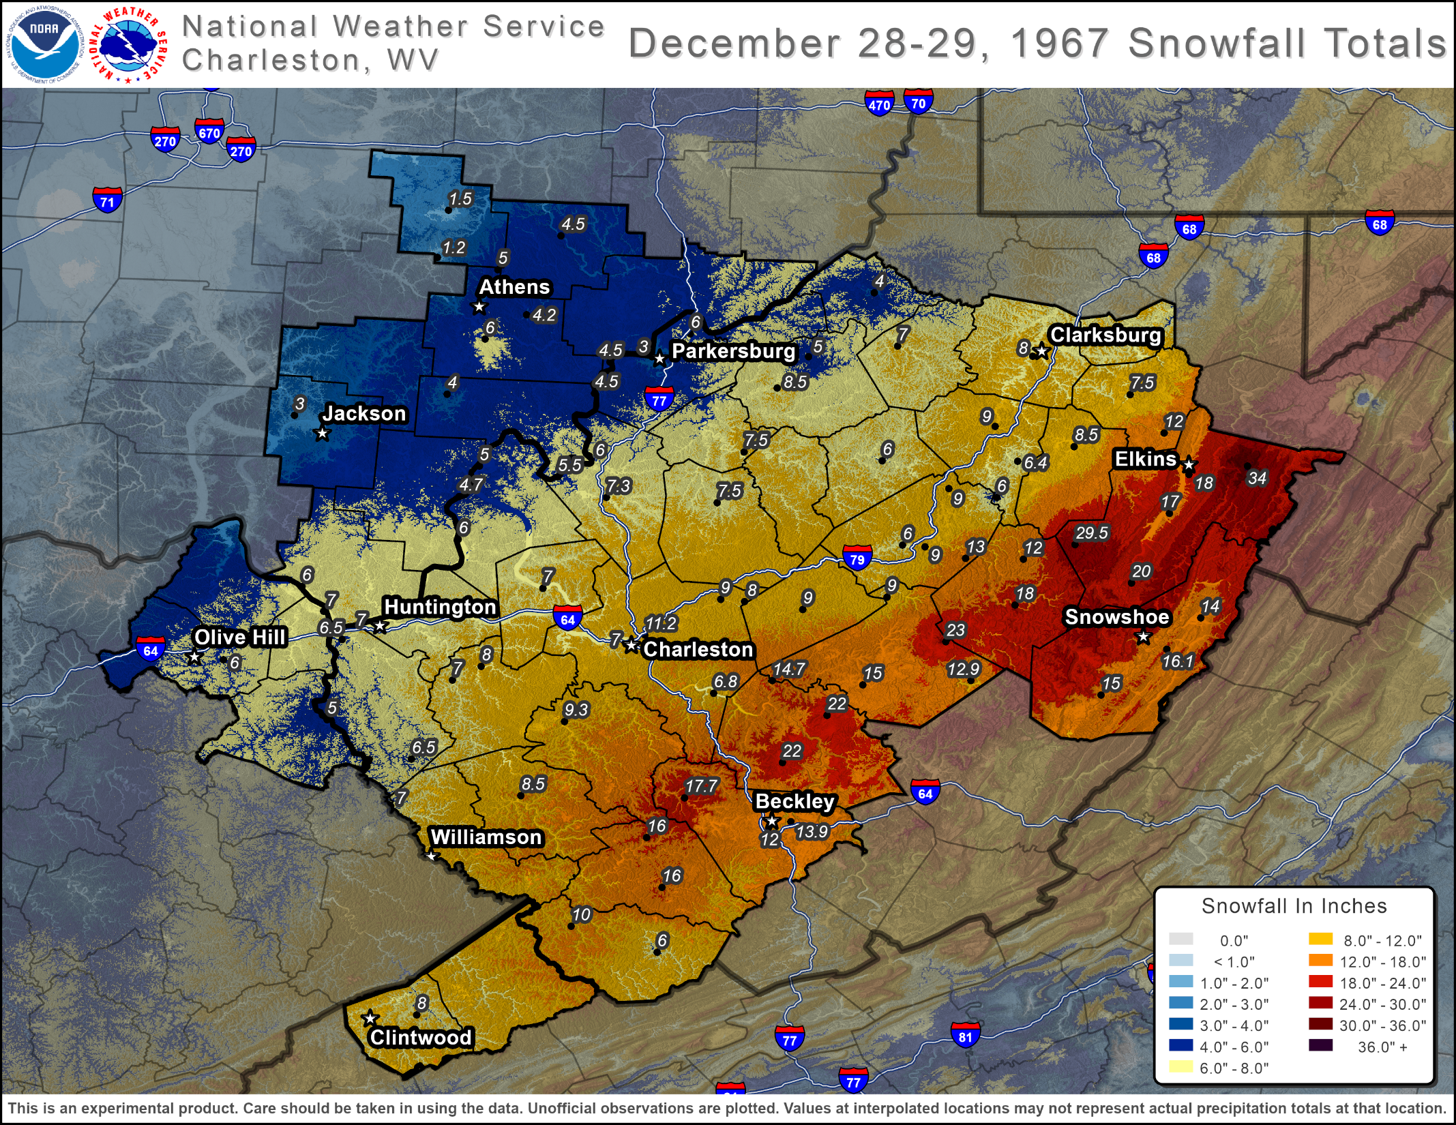
In late December 1967, a very amplified upper level pattern developed across much of North America and this led to the development of a strong low pressure system in the Gulf of Mexico on December 28th . Abundant moisture associated with this system streamed northward into the central Appalachians, Ohio Valley, and Mid-Atlantic region, which led to widespread snow and very impressive snow totals across much of WV. In fact, in just one day on the 28th , Elkins received 17.8” and this is among some of the snowiest days on record for the city. In addition, snowfall totals as high as 3 feet occurred in the northern WV mountains and amounts of 5 to 7 inches were observed as far west as the Ohio River. 12Z December 28, 1967 At 12Z December 28, an extremely amplified pattern is place across North America with a pronounced upper level ridge in the eastern Pacific that extends northward into Alaska and a broad longwave trough nearly enveloping the entire Contiguous United States. A mid level shortwave is rotating through the base of the trough across the Gulf Coast region, resulting in the development of a surface low near the AL/FL border. Meanwhile, an inverted trough axis extends northward from the surface low across the Ohio Valley and central Appalachians with widespread snow increasing in coverage from south to north. In fact, very heavy snowfall occurred in Elkins with 17.8” falling on just day alone, which makes this the 4th highest daily snowfall on record. 12Z December 29, 1968 Broad upper troughing remains in place across much of the Contiguous United States with temperatures around 10 degrees below normal as Elkins reached a high of just 40F. Meanwhile, the aforementioned low pressure system is now quickly moving offshore of the Mid-Atlantic region, but a lingering TROWAL axis across the central Appalachians did support additional snowfall during the afternoon and evening. However, any additional snowfall amounts were much lighter than the previous day as Elkins received just 0.2” of snow, but gusty northeast winds combined with the heavy snow from the previous day still created hazardous travel conditions throughout the region.
Overview
Analysis


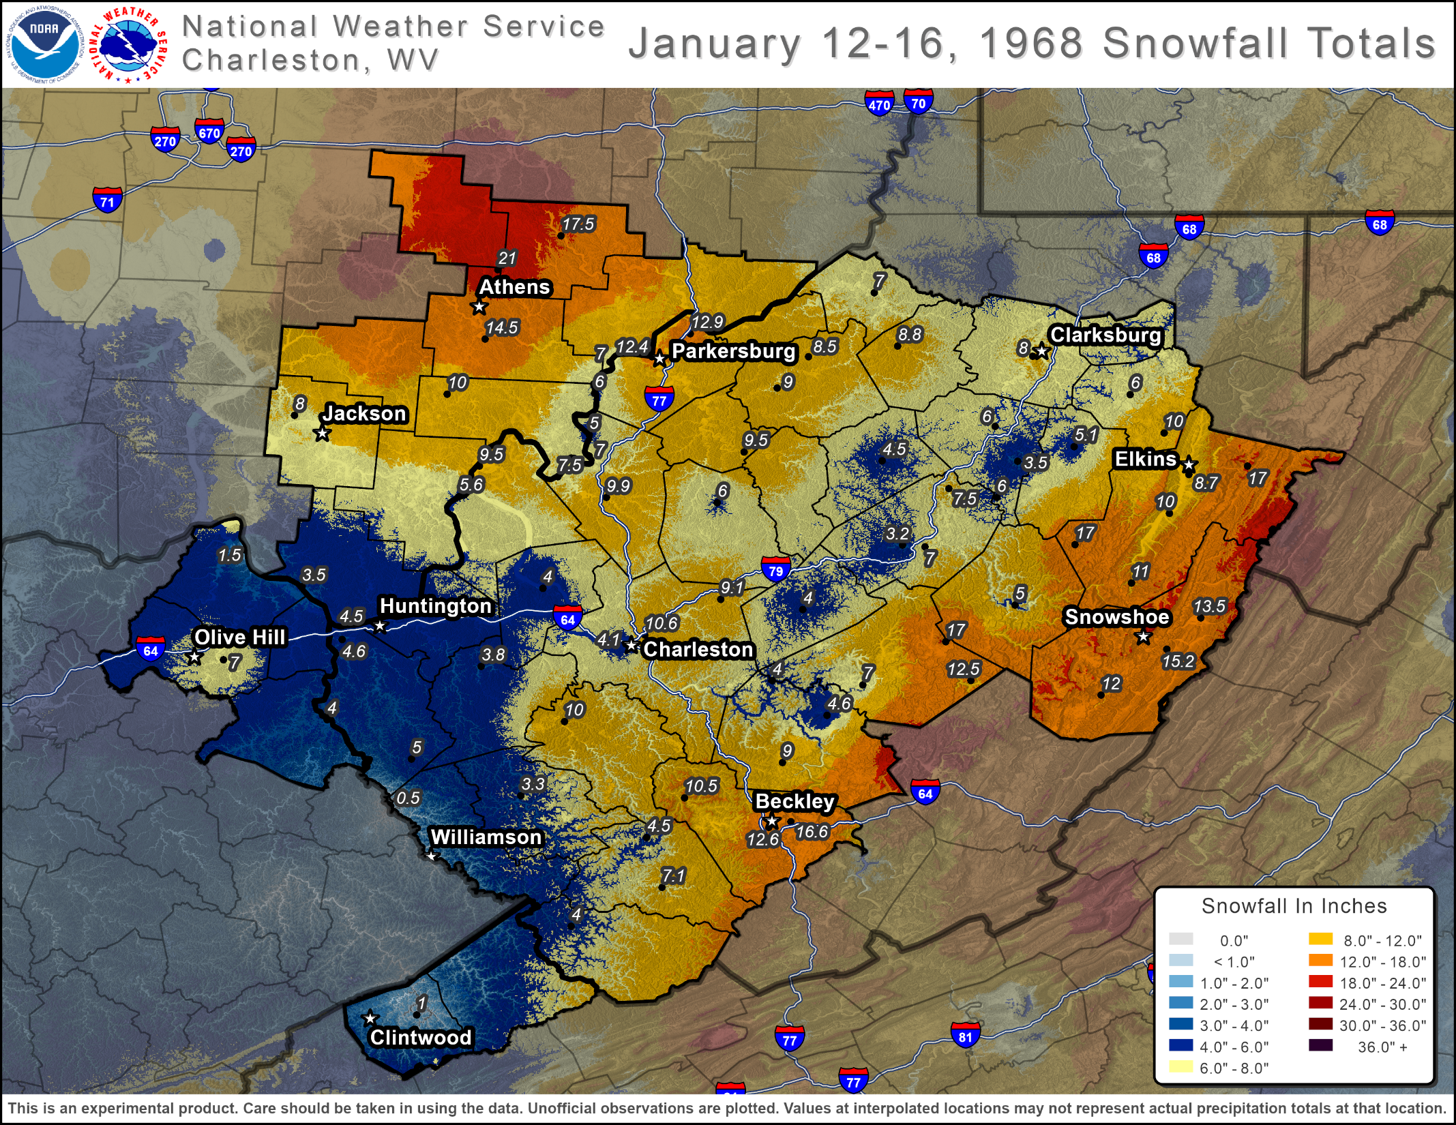
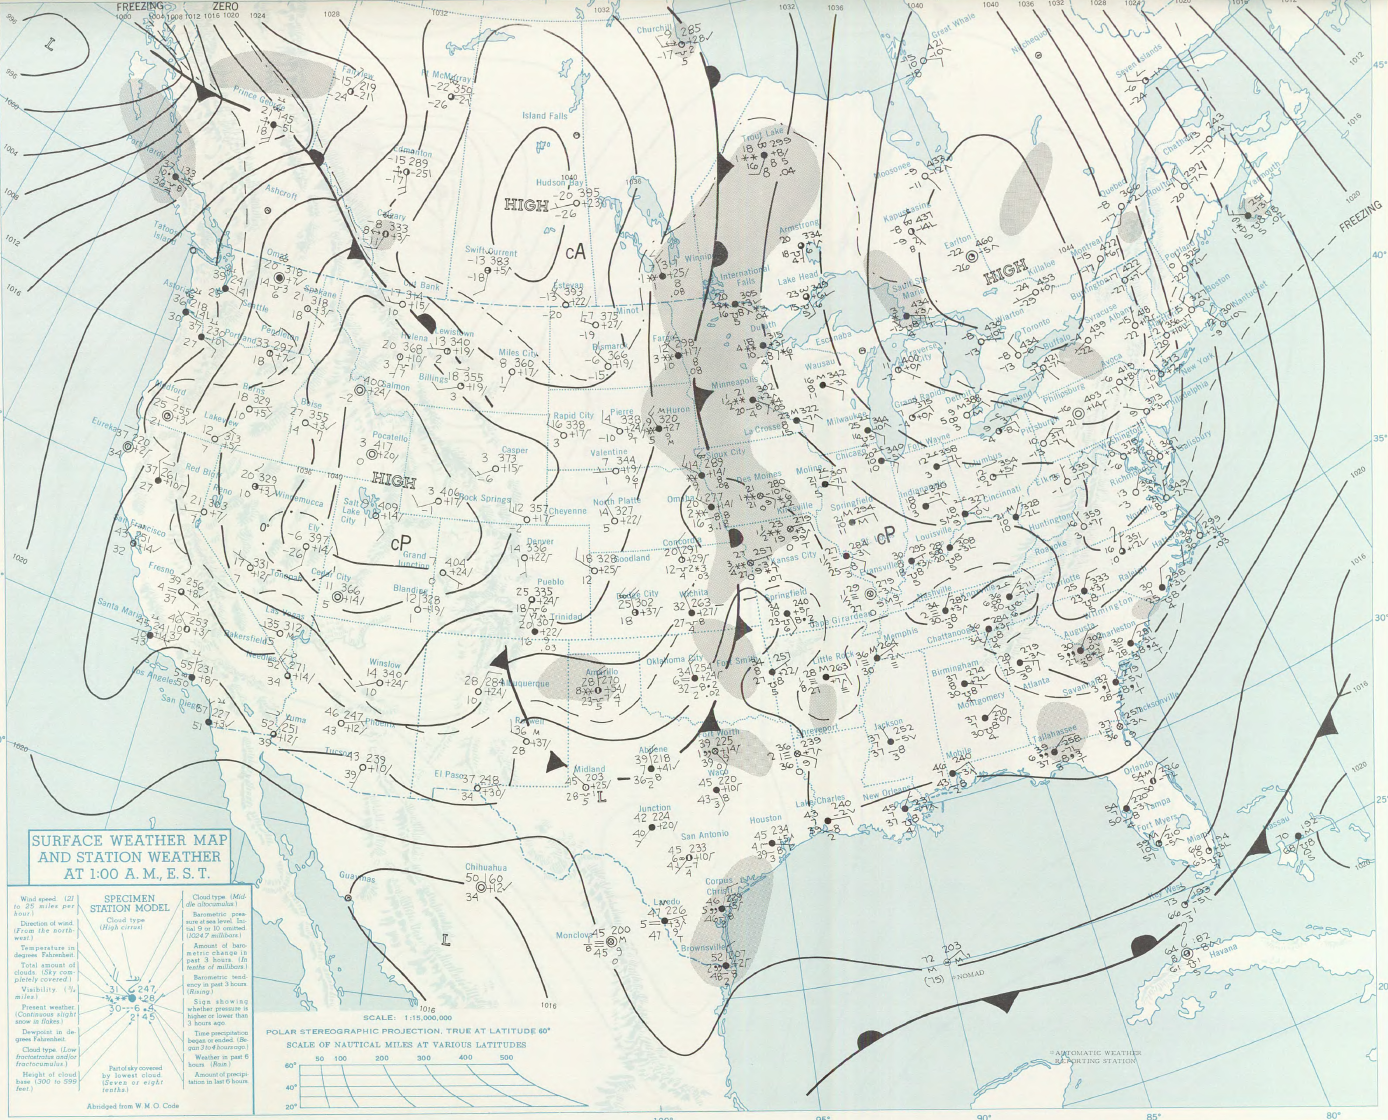
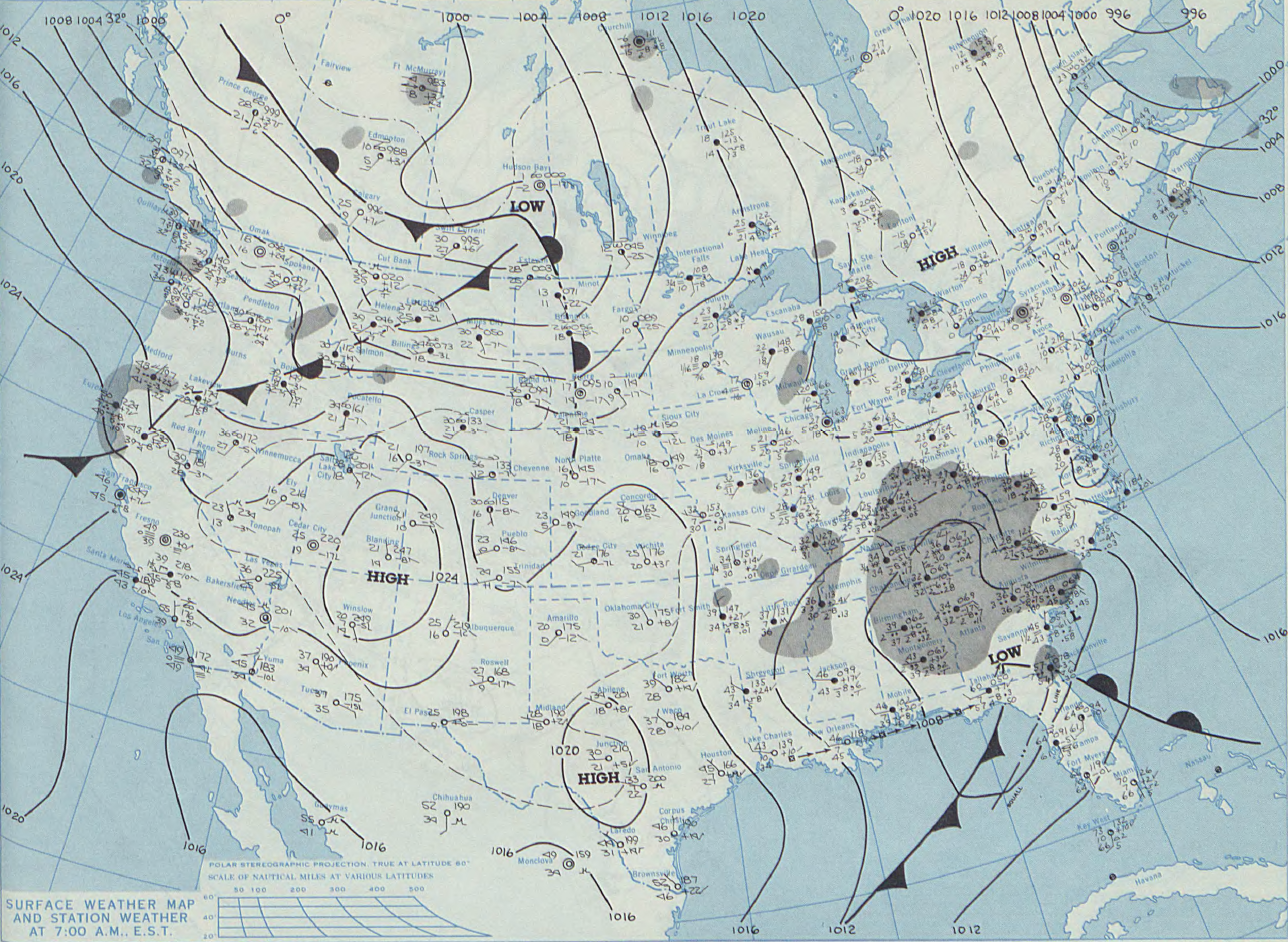
A closed upper level low across the Gulf Coast on January 12th slowly moved northeastward across the Ohio Valley over the following days before eventually weakening into an open wave by the 16th in eastern Canada. Due to the slow movement of this feature, multiple days of snow occurred across the Ohio Valley and central Appalachians with plenty of areas receiving between 8 to 12 inches, particularly north of Interstate-64. The city of Parkersburg was hit hard as 9” of snow fell on the 13th and additional minor accumulations continued to occur over the following days as strong cold air advection developed in the wake of the departing system. 12Z January 12, 1968 At 12Z January 12, a sharp upper level trough is in place across the Central US with strong upper level ridging further downstream across the Great Lakes and into central Canada. Meanwhile, surface analysis shows an expansive surface high in Ontario and a low pressure system developing across the Southern Plains. This system will move towards the central Appalachians and Ohio Valley in the coming days. 12Z January 13, 1968 By 12Z January 13, an upper level low begins to develop across the Lower Mississippi Valley and the associated surface low continues to strengthen across the region. Southerly flow ahead of these features is transporting plenty of moisture northward into the central Appalachians and Ohio Valley with widespread snowfall developing throughout the area. By the end of the day, Parkersburg received 9” of snow. 12Z January 14, 1968 The upper level closed low approaches the region by 12Z January 14 and with large scale lift in place, periods of light to moderate snow continued throughout the day. However, snow amounts in Parkersburg were lighter than the previous day with an additional 1.7” falling. In addition, temperatures were colder as the upper low crossed the region amid a fresh snow pack with highs just getting above the freezing mark. 12Z January 15, 1968 By 12Z January 15, the upper level low started to shift east of the area and flow became more favorable for upslope precipitation. As a result, the event began to transition into an upslope regime and additional bands of light to moderate snow continued throughout the area. In addition, cold air advection strengthened in the wake of the departing upper level low and Parkesburg reached a high of just 31F, which is about 10 degrees below the average for mid January. Otherwise, additional snow in Parkersburg was minor as the city received 1.4” of snow, but at this point there was more than a foot of snow on the ground. 12Z January 16, 1968 Upslope snow continued by 12Z January 16, but coverage and intensity of additional precipitation was diminishing. Thus, Parkersburg only reported a trace of snow for the day and conditions were improving. However, temperatures continued to fall as a reinforcing frontal boundary plowed through the region and as a result, Parkersburg reached a high of just 27F in the afternoon. Eventually, high pressure in northern Ontario continued to bring drier air into the area and the snow tapered off by the end of the period.
Overview
Analysis


December 31, 1970-January 1, 1971
A new year brings new beginnings and a fresh start for us, but the end of 1970 and start of 1971 was a time that many residents in the central Appalachians also welcomed a significant winter storm system to the region. On December 31, a low pressure system across the southeast US quickly shifted up the Eastern Seaboard and brought widespread snow to areas northwest of the storm system’s track. This means that the central Appalachians were in a favorable position relative to the system’s track to receive heavy snow across portions of the area and thus, the city of Elkins was hit hard as over a foot and a half of snow fell in just 2 days. There was also a very tight snowfall gradient with this system as some areas received over 2 feet of snow in the WV mountains but amounts quickly decreased for areas further west as about 8 to 12 inches occurred along the I-79 corridor and only about 1 to 3 inches fell for areas near the Ohio River. 12Z December 31, 1970 At 12Z December 31, a sharp mid/upper level shortwave trough is digging across the lower Mississippi Valley. Ahead of this feature, a strengthening surface low develops across the Southeast US and begins to lift to the northeast along the east side of the trough. As the low pressure system lifts northeastward through the day, widespread moderate to heavy snow spreads across the central Appalachians and Ohio Valley from south to north along a TROWAL axis to the northwest of the storm’s track. In Elkins, 12.2” of snow occurred on this day but additional snow would fall as the system continued to track along the coast. 12Z January 1, 1971 By 12Z January 1, the aforementioned low pressure system passes offshore of the Mid-Atlantic region and the lingering TROWAL axis continues to support additional periods of light to moderate snow across the central Appalachians. While snow amounts were less than the previous day, Elkins still received 6.5” and the continued cold air advection kept temperatures around 10 degrees below normal with a high of just 27F. However, snow tapered off from west of east across the region by the end of day as the low pressure system moved further offshore and high pressure moved into the area.
Overview
Analysis


After a mild stretch of January weather with temperatures in the 50s and even low 60s, a strong cold front swept across the eastern US on January 12th and sent temperatures plummeting to values of 15 to 20 degrees below normal in the following days. In addition to the cold, moderate to heavy snow developed across parts of the area with the majority of the snow occurring on the 12th. Snowfall totals were generally confined to a narrow but substantial swath of 8-12 inches that occurred along the entire stretch of the I-79 corridor in WV and much of the Metro Valley and into eastern KY. 12Z January 12, 1975 At 12Z January 12, a deep longwave trough extends from the Upper Midwest towards northern Mexico and a strong shortwave is rotating through the base of the trough across the southern Plains. This sets the stage for the development of a low pressure system across the northern Gulf Coast. Meanwhile, a deep moist southwesterly flow ahead of the trough sends abundant moisture northward across much of the eastern US. As the low pressure system strengthens and moves to the northeast along the east coast, large scale forcing for ascent increases across the central Appalachians and Ohio Valley, aided by a 110+ kt jet streak aloft. This results in widespread snow developing across the area later in the day with moderate to heavy snowfall rates later in the period. 12Z January 13, 1975 At 12Z January 13, much colder air started to filter into the area as surface high pressure in central Canada brings a supply of arctic air southward with 850mb temperatures dropping into the -5C to -10C range. Meanwhile, widespread snow continued across the region as the low pressure system moved northward along the coast and upper level support from troughing over the area. 12Z January 14, 1975 By 12Z January 14, temperatures dropped to around 20 degrees below normal area-wide with 850mb temperatures around -15C. The continued cold air advection, northwest flow, and moisture contribution from the Great Lakes helped maintain bands of upslope snow through the day. While many areas only experienced minor additional accumulations by this point, impacts were still felt across the region given the effects of the frigid airmass in place.
Overview
Analysis


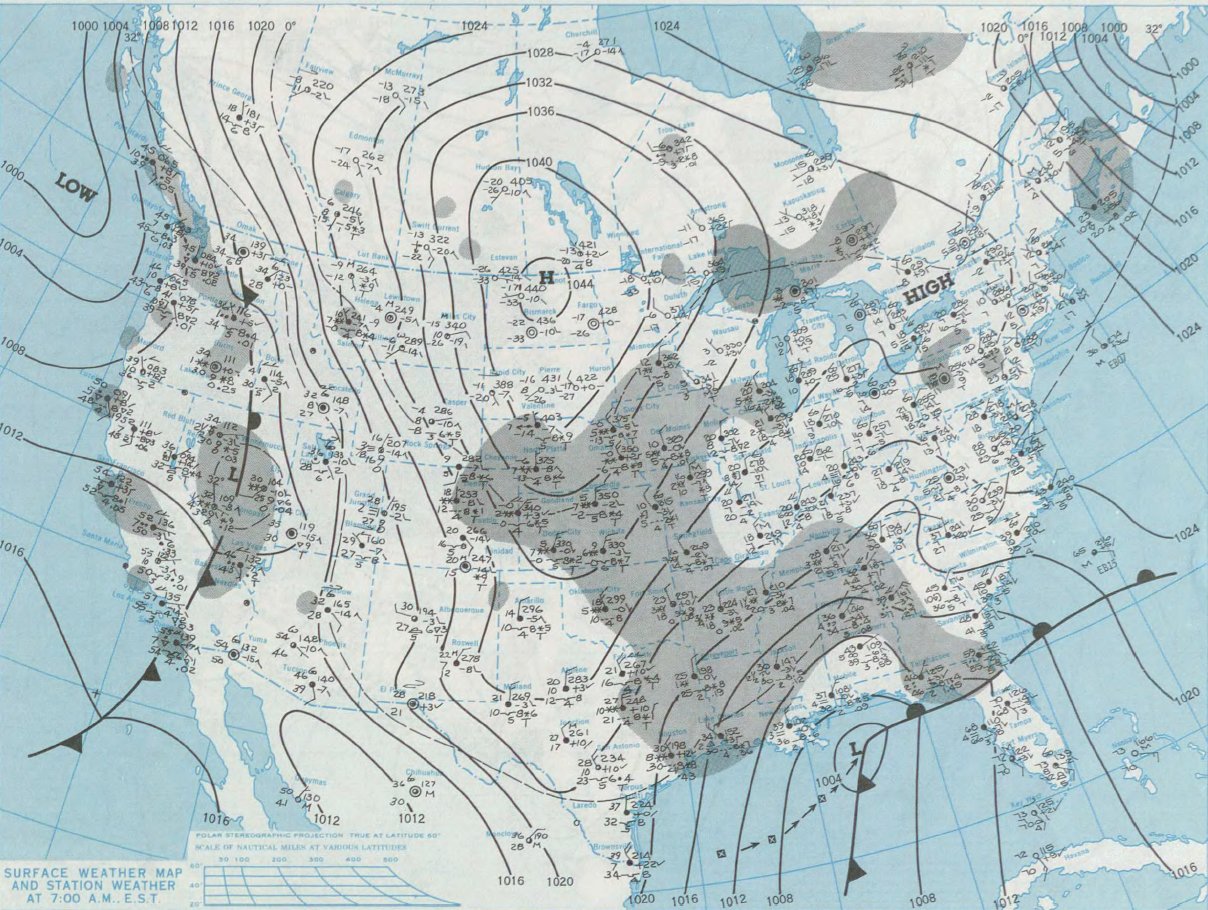
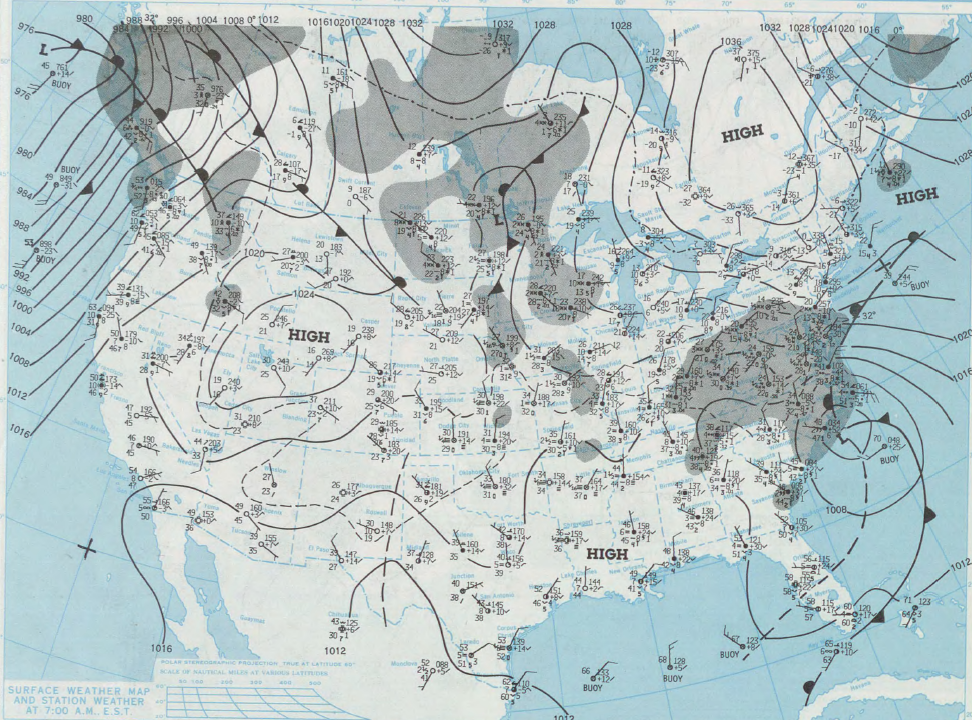
A massive arctic high pressure system became established across the northern plains on January 19 th and built eastward through the next several days towards the Canadian Maritimes. As a result of this feature, sub-freezing daily high temperatures were in place across the central Appalachians and the Ohio Valley with highs generally about 20 degrees below normal. Meanwhile, a surface low that originally developed in the Gulf of Mexico on the 19 th rapidly strengthened as it moved up the eastern seaboard through the next several days and widespread moderate to heavy snow occurred to the northwest of the system’s track. The highest snowfall amounts associated with this system occurred across western Maryland and the northern West Virginia mountains where nearly 30 inches of snow occurred, but widespread amounts of 10-20 inches were common across the lowlands too. 12Z January 19, 1978 At 12Z January 19, a sharp mid/upper level trough is digging across the lower Mississippi Valley and a potent shortwave rotates through the base of this feature that extends into the Gulf of Mexico. In response, a surface low develops over the Gulf and begins to pull to the northeast with time. Meanwhile, a massive surface high centered over the Northern Plains will supply the entire area with arctic air with temperatures at least 20 degrees below normal throughout the Ohio Valley and central Appalachians. This combined with increased forcing for ascent due to a 130+kt upper level jet streak in the northern Ohio Valley and an inverted trough axis extending into the region allowed precipitation coverage to greatly increase throughout the period. Parkersburg received 5.3" of snow by the end of the day. 12Z January 20, 1978 By 12Z January 20, rapid deepening of the low pressure system is occurring in the Mid Atlantic region in an enhanced region of strong upward vertical motion. This region of upward vertical motion is aided by the coupled jet structure that is displayed on the 200mb analysis which shows a strong jet streak over Atlantic Canada and another jet streak across the southern US. Widespread moderate to heavy snow occurred area-wide along the TROWAL west of the low pressure system and interacted with the large scale forcing and moisture transport into the region. With high pressure at the surface and aloft positioned in the Great Lakes, the northward progression of the low pressure system was impeded and this allowed widespread moderate to heavy snow to occur across the entire area. Charleston received just under a foot of snow with a daily total of 11.7” on this day. Parkersburg received 5.6" of snow. 12Z January 21, 1978 The majority of additional snow at this point has transitioned to more of an upslope event as the low pressure system exits the Mid Atlantic region and moves towards the Canadian Maritimes. Meanwhile, strong cold air advection continues in its wake and with increased moisture contribution from the Great Lakes combined with the terrain enhancement, bands of snow continued throughout the region for the remainder of the day. As the expansive surface high across the central US continued to build into the area, snow gradually tapered off by the end of the day and drier air continued to build into the area. However, most areas did receive a few inches of additional accumulation and temperatures remained below normal given the influence of the arctic airmass. 12Z January 22, 1978 By 12Z January 22, the aforementioned arctic high drifted eastward across the Ohio Valley through the day and as a result, any lingering precipitation across the region gradually tapered off by the end of the period. In fact, Parkersburg only reported a trace of snow on this day, but continued to remain around 10-15 degrees below normal as the frigid airmass moved in.
Overview
Analysis


In mid February 1983, a low pressure system developed across the lower Mississippi Valley in response to potent mid level energy moving across the area. This system tracked across the southeast US over the following day and eventually offshore of the Northeast US by February 12th . Moisture wrapping around this system and strong forcing in place led to widespread snowfall across the central Appalachians and Ohio Valley. Snowfall totals of 1 to 2 feet occurred across the WV mountains and many areas in north central WV received a foot from this system. 12Z February 10, 1983 At 12Z February 10, a mid-level shortwave trough and associated surface low is moving across the lower Mississippi Valley. As the day progresses, the low pressure system moves to NNE along the east side of the trough axis as it tracks through the Southeast US. While precipitation coverage increases from south to north through the day across the Ohio Valley and central Appalachians along an inverted trough axis, precipitation chances will increase more substantially in the days ahead as the storm system moves along the coast. 12Z February 11, 1983 By 12Z February 11, a 110 kt upper level jet is in place across the Southeast US and the low pressure system moving through the Mid-Atlantic region continues to deepen in the left exit region of the jet streak. Meanwhile, widespread moderate to heavy snow developed to the northwest of the surface low along a TROWAL axis across the central Appalachians. As a result, Clarksburg received 5” of snow on this day, but even heavier snow is expected before the end of the event. 12Z February 12, 1983 Strong cold air advection arrived by 12Z February 12 as the system pulled northward offshore of the New England Coast. As a result, temperatures only reached a high of 26F for the day in Clarksburg, which is around 15 degrees below normal. In addition, the greatest snowfall totals of this event occurred on this day as Clarksburg received 8.5” of snow with a lot of the precipitation activity enhanced by upslope. By the end of the day, the snow did taper off as high pressure moved into the area and allowed conditions to improve.
Overview
Analysis


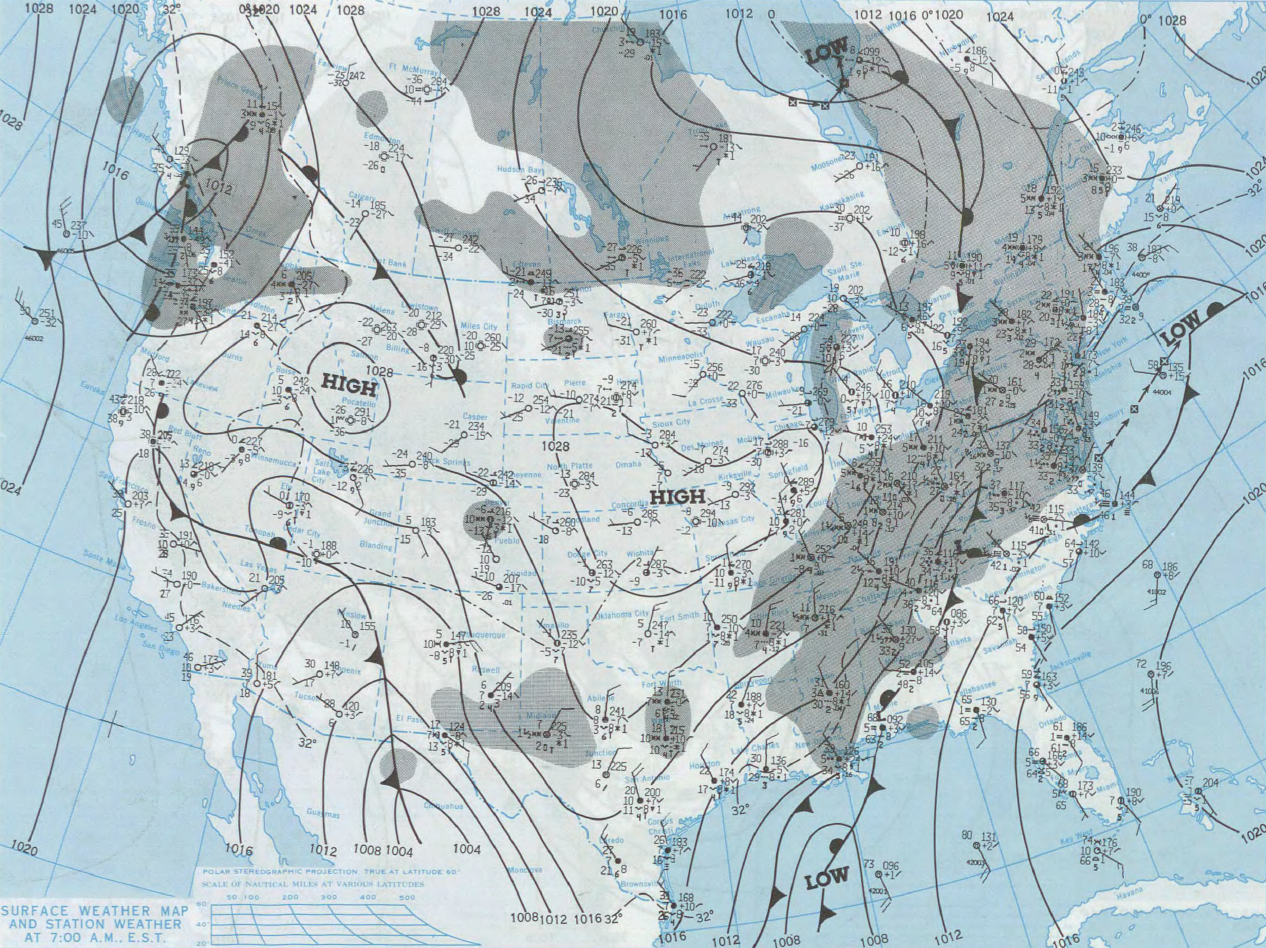
As the month of January 1985 came to a close and the calendar turned to February, an arctic airmass across the central US dropped temperatures to values as low as 20 to 25 degrees below normal across the central Appalachians and Ohio Valley. This airmass moved into the area in the wake of a strong cold front that plowed across the region earlier in the period. However, the arrival of arctic air was not the only concern since widespread snow also accompanied the frontal passage and by the end of the event, a large swath of 8-12 inches fell across much of the region. The Tri-State region was among one of the hardest hit areas from this system as the city of Huntington received over one foot of snow, but there were locations in the northern WV mountains that received even higher amounts than that. 12Z January 31, 1985 At 12Z January 31, a sharp southwest to northeast oriented frontal boundary stretches from the Great Lakes into southern TX and marks the edge of an arctic high centered in the Central US. Aloft, a broad upper level trough is in place across most of the Continental US with a strong upper level jet on the east side of the trough axis, supporting large scale ascent across the Ohio Valley and central Appalachians. As a result, precipitation increased in coverage from west to east as the frontal boundary approached the area with mainly rain initially, but precipitation quickly transitioned to snow as colder air moved in. 12Z February 1, 1985 By 12Z February 1, the cold front is plowing across the eastern US with strong cold air advection developing in its wake and as a result, the transition from rain to snow continues from west to east. Meanwhile, strong upper support continues with a 130+ kt upper level jet across the Ohio Valley and Central Appalachians with periods of moderate to heavy snow across the region. On this day, Huntington received 6.7” of snow with a high temperature of 31F, more than 10 degrees below normal. 12Z February 2, 1985 Moist southwest flow aloft continues between a broad upper trough across the Intermountain West and a Subtropical Ridge building in the Southwest Atlantic. Meanwhile, an arctic high centered in the Upper Midwest continues to build towards the Ohio Valley with very cold air spreading across the region as Huntington only reached a high of just 19F, which is about 25 degrees below normal. While an additional 3.1” of snow occurred in Huntington on this day, the snow started to taper off by the end of the day as high pressure continued to build into the area.
Overview
Analysis


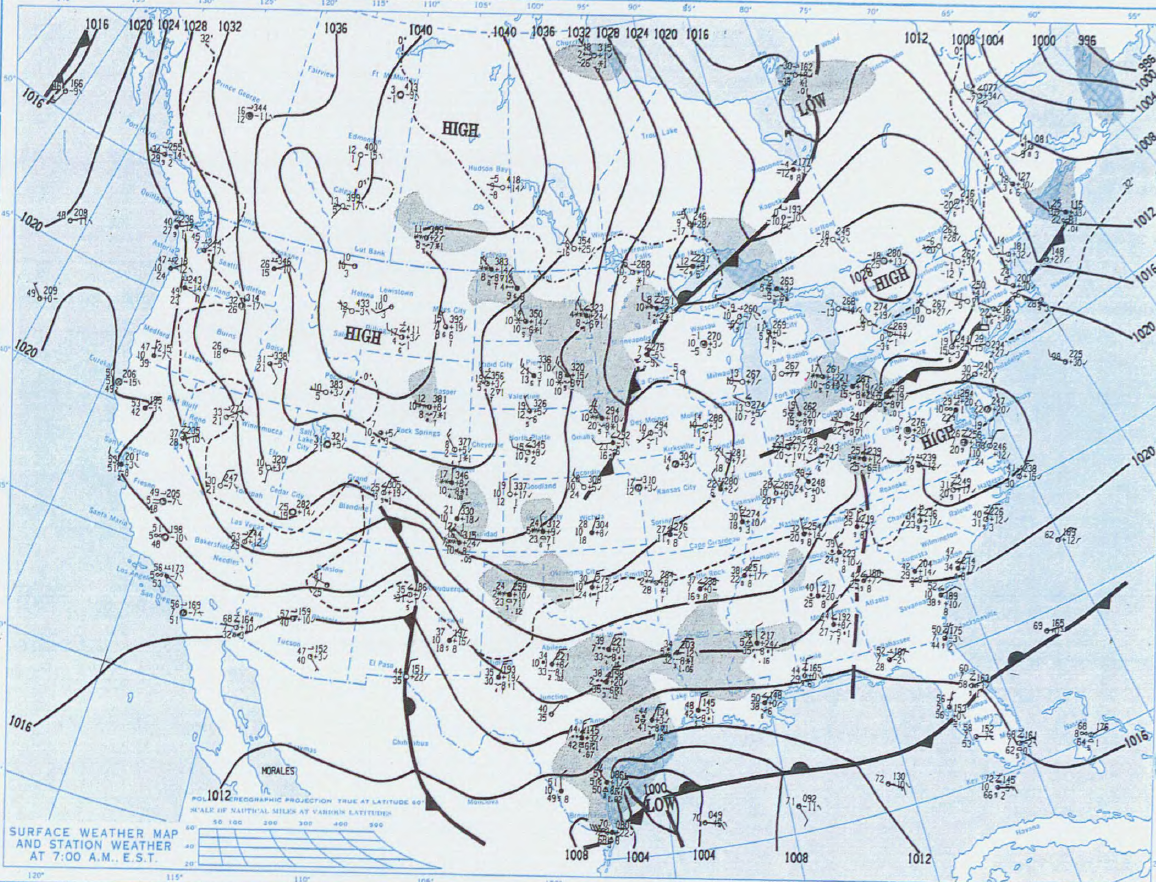
The month of April for residents in the central Appalachians and Ohio Valley might feature the occasional cold snap or light snowfall, but in most cases it is a month that spring really starts to make its presence felt. Thus, it would be hard to imagine that a snow event in April could become one of the most significant snow storms to impact the area on record, but this is exactly what happened in April 1987. On April 2, a strong arctic cold front plowed across the region and sent temperatures plummeting to around 30 degrees below normal over the following days. In addition to the record breaking cold temperatures, a low pressure system developed across the southeast US and tracked northeastward along the eastern seaboard but eventually retrograded towards the central Appalachians and meandered for several days. This system brought a significant late season snowstorm across the region with plenty of areas receiving over 2 feet of snow and even isolated amounts of closer to 3 feet were also observed. 12Z April 2, 1987 At 12Z April 02, a broad mid/upper trough is positioned across the central and eastern US with its base extending southward into the Gulf Coast. This feature is in-between an upper ridge that extends into western Canada and an upper ridge downstream in the North Atlantic. At the surface, a low pressure system is centered over the Great Lakes and its associated cold front extends to the SSW through the central/southern Appalachians and towards the Gulf Coast. Bands of light snow did develop across the region in the wake of the cold front that pushed through, which generally allowed for minor accumulations across the central Appalachians and Ohio Valley. However, this was only the initial phase of this system and much greater impacts are expected to follow in the days ahead. 12Z April 3, 1987 By 12Z April 03, a shortwave moving across the lower Mississippi Valley caused the mid/upper level trough axis to sharpen as this feature begins to phase with the Subtropical jet stream across the southern US. Ahead of this upper trough axis, a surface low develops in the southeast US and begins to shift northeastward along the east coast. Meanwhile, a combination of isentropic lift and an inverted trough axis led to widespread snow across the central Appalachians and Ohio Valley, which increased in coverage from south to north through the afternoon and evening hours. It was also exceptionally cold for this time of the year as Charleston reached a high of just 35 degrees; nearly 30 degrees below normal as cold air advection began to really ramp up. 12Z April 4, 1987 At 12Z April 04, a deepening surface low is centered over the Mid Atlantic region and the circulation around this system is supporting strong cold air advection throughout the region. As a result, 850mb temperatures range from -5C to -10C throughout the central Appalachians and Ohio Valley and this led to frigid cold for early April standards as highs only reached 32F in Charleston; more than 30 degrees below normal. In addition, widespread moderate and heavy snowfall occurred area-wide along a deformation zone/TROWAL axis to the northwest of the low pressure system. On just this day, Beckley received 13.1" of snow, Charleston 10.9”, and Parkersburg 9.6", – each setting highest daily snowfall records for the month April. 12Z April 5, 1987 The system is now becoming increasingly occluded and vertically stacked as it meanders over the central Appalachians. A lingering deformation zone over the region and wrap-around moisture feeding into the arctic air continues to support additional snow, but precipitation intensity is not as extreme as it was 24 hours ago. However, many areas still received several inches of snow on this day and the well-below normal temperatures continued, so the impacts of the late season snowfall continued to be felt across the area. Eventually, this slow moving system pulled away from the area and conditions did warm in the days ahead amid the strong April sun angle.
Overview
Analysis


If a particular storm is devastating enough to earn the title of “The Storm of the Century” it must have been a rather extraordinary storm! In March 1993, that type of storm occurred and brought significant impacts all across the eastern US, and the Ohio Valley and central Appalachians were right in the center of this devastating system. On March 12, a surface low developed in the western Gulf of Mexico and over the next several days the storm intensified rapidly as it tracked across the southeast US and eventually along the US East Coast. Very heavy snow and strong winds combined to bring treacherous travel and whiteout conditions across the Ohio Valley and central Appalachians with many areas receiving 1-2 feet of snow across the lowlands and 2-3 feet in the WV mountains. While a few winter storms before this system and after it have attempted to match its fury, it continues to hold the title of "storm of the century" because of its major impacts for many residents across the Eastern US. 12Z March 12, 1993 At 12Z March 12, a broad northern stream upper level trough is in place across much of the northern US. This feature is downstream of a highly amplified upper ridge that is positioned across the west coast. A surface high diving southward from the northern Rockies combined with the broad upper troughing across the northern US allowed arctic air to spread across the central Appalachians and Ohio Valley. Meanwhile, a southern stream upper trough is digging across northern Mexico as shortwave energy rotates through the base of the trough axis. In response, surface analysis shows a low pressure system developing in the western Gulf of Mexico. After this point, the impacts that occurred across the entire eastern US in the days ahead were ultimately responsible for this storm to forever be known as the “1993 Storm of the Century.” 12Z March 13, 1993 The northern and southern stream began to phase by 12Z March 13, and the surface low was rapidly deepening across the southeast US due to the robust jet dynamics in place. This intense low pressure system was moving northeastward along/near the coast on the east side of the sharp upper trough. Meanwhile, the strong circulation around the system led to intense moisture transport ahead of the surface low and with strong isentropic ascent and a TROWAL axis over the central Appalachians and Ohio Valley, widespread moderate to heavy snow occurred on this day. Beckley received a whopping 27.7" of snow, Huntington 21.1", Parkersburg 20.1", and Charleston 17.1" on this day alone, easily setting records for highest daily snowfall on record at those observing sites. Elkins also received 16.9" of snow. In addition, the extremely tight pressure gradient over the area led to very strong north to northeast winds, creating blizzard conditions throughout the region. 12Z March 14, 1993 By 12Z March 14, a deep upper trough axis was in place over the central Appalachians and Ohio Valley. Meanwhile, the intense cyclone has bombed out off the coast of New England and the combination of the upper troughing in place and the cyclonic flow sent 850mb temperatures plunging to around -15C to -20C. In addition, bands of snow continued to impact the region along the lingering TROWAL over the area amid the strong cold air advection. The high for the day in Charleston was just 29 degrees, which is more than 20 degrees below the climatological normal value. By the end of the day, Clarksburg received 14” of snow, but impacts from the 1993 Storm of the Century began to lessen by the end of the period. However, the storm’s wide-reaching effects and massive size is something many people won’t forget.
Overview
Analysis


Just a few days after the year 1994 began; a massive nor’easter brought widespread impacts to many residents across the eastern US, immobilizing millions of people from West Virginia to Maine. The nor’easter first developed early on January 3rd across the southeast US and over the next couple of the days the system moved northward along the coast and brought historic snowfall to many areas of West Virginia. Since much of the state was blanketed in at least a foot of snow with many higher amounts in localized areas, the state was brought to a standstill with nearly all businesses shut down other than emergency services. The storm was so intense that the city of Charleston received their second highest daily snowfall total on record after the city received 15.5” on January 4th . Meanwhile, cities such as Parkersburg and Elkins received 15.2” and 16.2” respectively on January 4th , which are all extremely impressive for snow totals in a single day. 12Z January 3, 1994 A mid/upper level longwave trough across the central US extends southward into the Gulf of Mexico and a pronounced upper ridge centered off the Baja California Peninsula extends northward along the west coast. At the surface, a double-barrel low pressure system is developing over the lower Mississippi Valley and off the coast of the Southeast US. Light snow begins to spread into the central Appalachians and Ohio Valley late in the period as moist southwesterly flow sets up and interacts with an inverted trough axis throughout the area. However, greater impacts are expected in the days ahead as this system continues to organize and move northward along the coast. 12Z January 4, 1994 At 12Z January 4, a deep longwave trough is in place across the central and eastern US with a coupled jet structure of two separate jet streaks on the east side of the trough. This type of jet stream orientation would favor strong upward vertical motion in the Mid Atlantic region and as a result, a broad low pressure system continues to strengthen just off the east coast. The combination of cold air advection around the large circulation of this system and a TROWAL/deformation zone did support widespread moderate to heavy snow throughout the area. In fact, there were significant winter weather impacts in Charleston on this day as 15.5” of snow fell, which makes this the 2nd highest daily snowfall total on record. Parkersburg received 15.2" of snow, their 4th highest daily snowfall total. Elkins received 16.2" of snow and Clarksburg received 7" of snow on this day. 12Z January 5, 1994 While precipitation coverage and intensity substantially decreased by 12Z January 5 as the low pressure system moved towards the Canadian Maritimes, the remainder of the event began to transition to more of an upslope snow scenario. As cold air advection continued in the wake of the departing low pressure system, additional moisture contribution from the Great Lakes and orographic lift did support additional snowfall accumulations across parts of the region, with Clarksburg receiving an additional 9" of snow. However, most of the additional accumulations were minor by this point across the lower elevations and the snow would eventually taper off by the end of the period as moisture depth becomes increasingly shallow.
Overview
Analysis


One of the most brutally cold air masses on record moved into the central Appalachians and Ohio Valley in mid January 1994 in the wake of a strong cold front that swept across the region. Overnight low temperatures ranged from -10 to -25 degrees across the area and the city of Parkersburg dropped down to a frigid -15F on January 18th and -24F on January 19 th , which is the coldest temperature on record for the city. In addition to these brutally cold temperatures, this cold front also brought widespread snow across the area as much of the middle Ohio Valley received a whopping 18 to 24 inches of snow and about 10 to 14 inches fell across much of the WV lowlands. 12Z January 17, 1994 At 12Z January 17, an amplified upper level ridge is centered off the California coast and the ridge axis extends northward into northwestern Canada. Further downstream, a deep upper level trough is in place across the central US with a 130+ kt upper level jet streaming across the Ohio Valley. Meanwhile, a low pressure system is moving eastward across Ontario with a cold front extending southward from the surface low. Strong moisture transport ahead of the system and large scale forcing lead to widespread moderate snow throughout the central Appalachians and Ohio Valley. Parkersburg received 18" of snow on the day, the 2nd highest daily snowfall total on record. Clarksburg received 4†of snow on this day, but additional amounts were expected before the system moved out of the area. 12Z January 18, 1994 Moderate to occasional heavy periods of snow continued by 12Z January 18 as the upper trough axis swings through the region and strong cold air advection and upslope flow developed in the post-frontal environment. As a result, Clarksburg received 9†of snow on this day, but conditions did improve by the end of the period as an expansive area of high pressure across the central US builds into the area.
Overview
Analysis


In early January 1996, one of the most severe Nor’easters of all time affected much of the eastern United States with historic snowfall and true blizzard conditions in many areas and thus, the storm is commonly known as the “Blizzard of ‘96.” On January 6, a low pressure system across the southeast US rapidly deepened as it moved northeastward off the coast of the Carolinas and eventually offshore of the northeast US by January 8. Widespread heavy snow occurred to the northwest of the system’s track as it moved along the US East Coast, and very cold arctic air was filtered into the area as a large arctic high became established in the Upper Midwest. By the end of the storm, widespread snowfall totals of 1-2 feet were common in the West Virginia lowlands with amounts of 2-3 feet in the mountains. However, isolated amounts in the West Virginia Mountains were even higher as Snowshoe, WV recorded a whooping 48” of snowfall by the end of the event. 12Z January 6, 1996 On January 6, 1996 at 12Z, a highly amplified upper level pattern is in place with upper ridging extending into western Canada and an upper level trough digging southward into the southern Plains and northern Mexico. Just ahead of this upper level trough, a strong jet streak is present across the Southeast US with winds at 200mb greater than 130 kts. This supports strong upward vertical motion across the Gulf Coast region and results in the development of a surface low. Surface analysis shows an inverted trough extends northward from the surface low into the central Appalachians and the Ohio Valley. Meanwhile, an expansive surface high centered across the Upper Midwest delivers a feed of arctic air into the region. As a result, snow develops across the area and begins to increase in coverage from south to north through the afternoon and evening hours. Beckley received 11.7" of snow on this day. 12Z January 7, 1996 By 12Z January 07, a sharpening upper trough is digging across the Gulf Coast as a potent shortwave rotates through the base of this feature. Ahead of the upper trough, a rapidly deepening surface low off the coast of the Carolinas is moving northeastward along a frontal zone. The circulation around this strengthening low pressure system is leading to significant moisture transport with precipitation water anomalies pivoting into the central Appalachians and Ohio Valley. The deep moisture transport combined with a TROWAL/deformation axis to produce bands of heavy snowfall north and west of the center of the surface low. This led to widespread snow throughout the entire region with Elkins receiving 18.1", Charleston 12.9", Beckley 9.7", Clarksburg 7", and Huntington 6.5” of snow on just this day. 12Z January 8, 1996 By 12Z January 08, the upper level trough axis is shifting east of the region and strong cold air advection continues in the wake of the departing trough with 850mb temperatures generally ranging from -10C to -15C. Surface analysis reveals that the center of the strong cyclone is just off the coast of New Jersey and wrap-around moisture continues to swing through the central Appalachians and Ohio Valley. As a result, bands of snow continued through this day along the lingering TROWAL axis amid the cold air advection regime. Eventually, the snow tapered off from west to east by the end of the day as upper trough continues to depart the area and low pressure off the east coast continues to move further offshore. In addition, this storm went on to become the Blizzard of ’96 throughout the Mid-Atlantic and northeastern United States.
Overview
Analysis


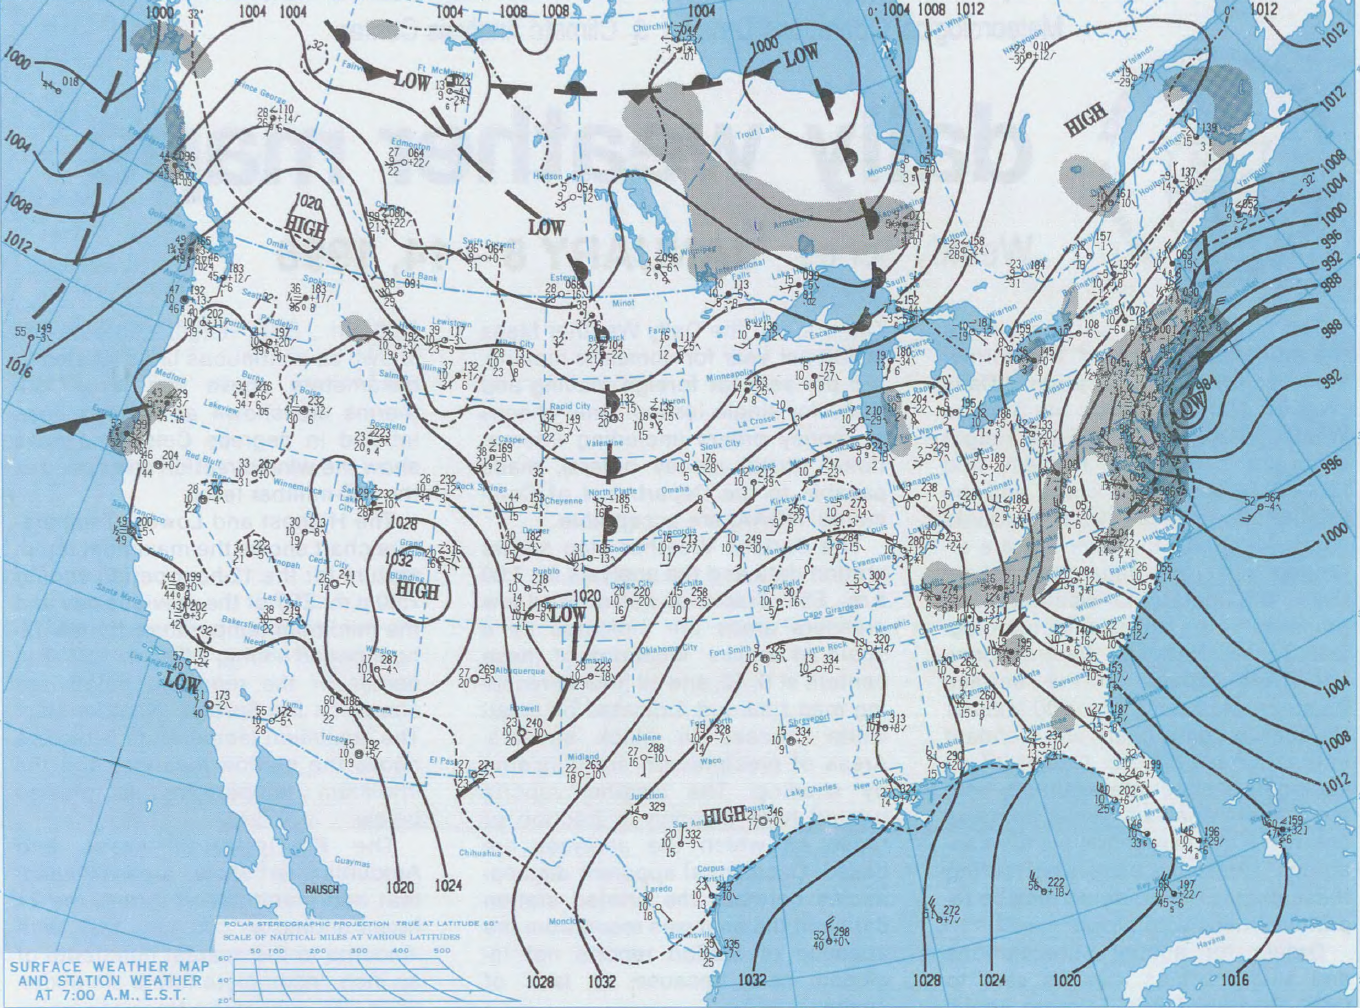
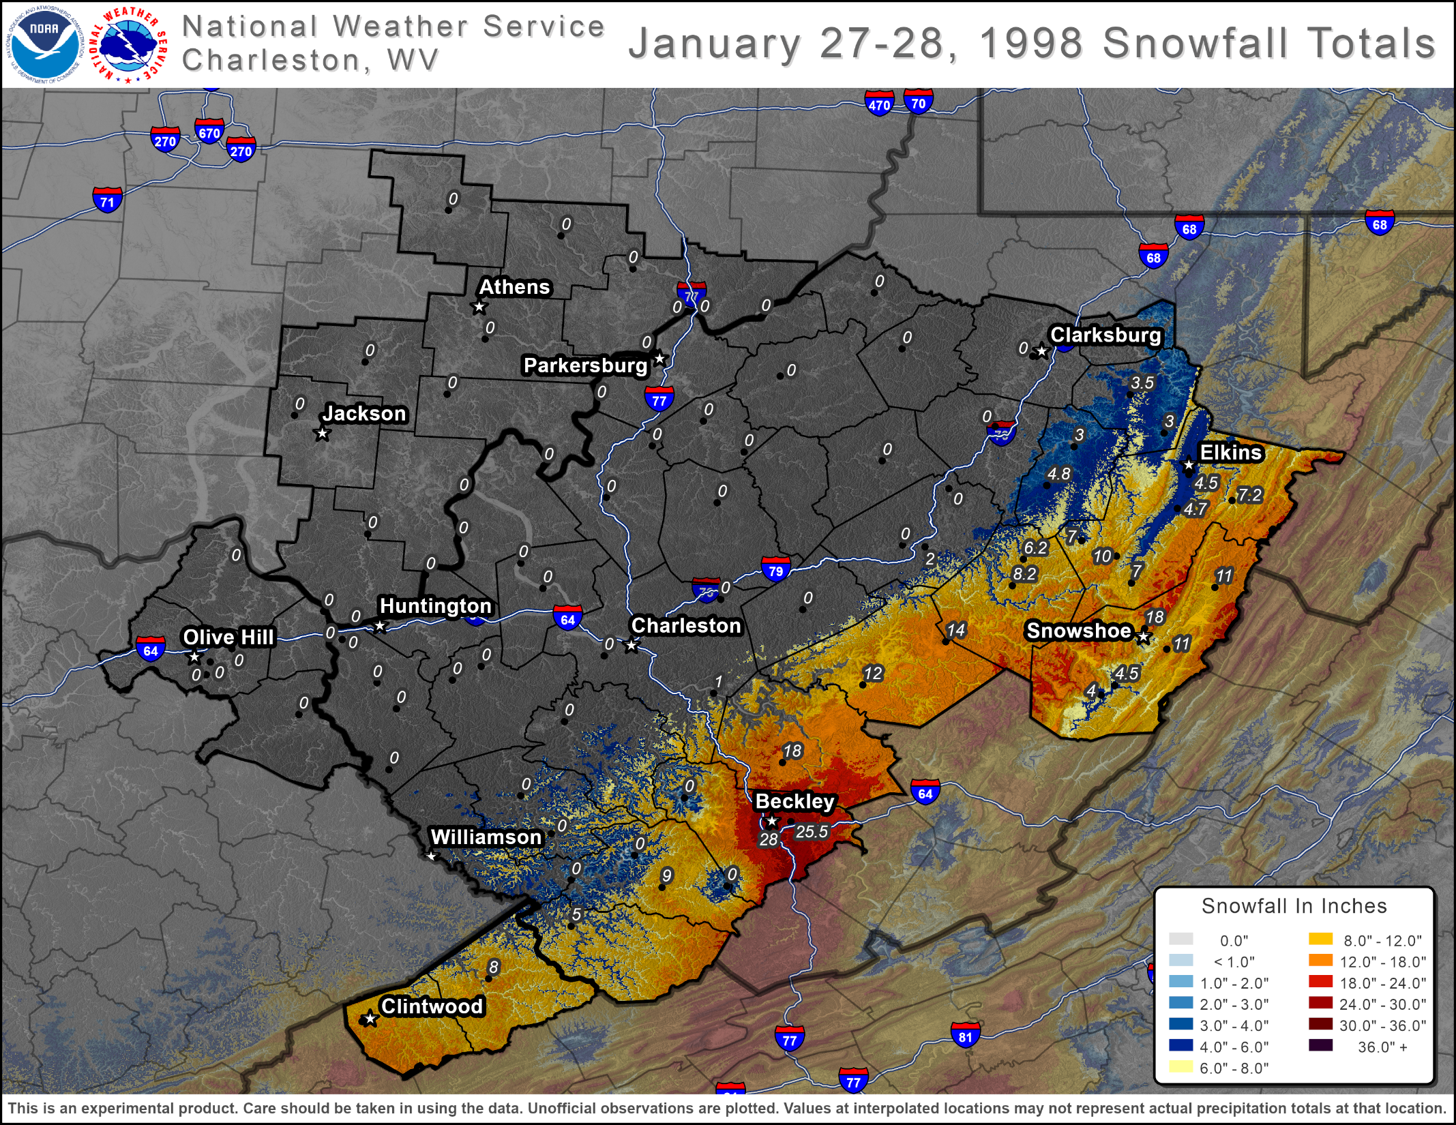
A vigorous upper level shortwave spawned a surface low across the southeast US on January 27th and as this system moved up the Mid-Atlantic coast, moderate the heavy precipitation occurred across the central Appalachians. With marginally cold temperatures in place, there was an incredibly sharp snowfall gradient based on elevation with no snow at all across the lowlands but amounts of 2 to 3 feet occurring along the Appalachian chain from TN/NC northward into WV and VA. Thus, it is quite remarkable that cities such as Beckley received record-breaking snow during the two-day event with over 2 feet but cities such as Charleston did not receive any snow as temperatures remained mild in the 40s and even low 50s. Due to the progressive nature of the system, the snow tapered off by the end of the period as the system moved further offshore. 12Z January 27, 1998 At 12Z January 27, a mid level shortwave is rotating through the base of an upper trough across the Gulf Coast region. In response, a surface low quickly develops across the Southeast US and begins to lift to the NNE along the coast. As this occurs, precipitation develops along a TROWAL axis across the central Appalachians to the northwest of the low pressure system. As moisture advection increased throughout the day with positive PWAT anomalies spreading into the region, significant snow was observed at Beckley as 14” fell, which makes this day the 6th greatest daily snowfall on record for Beckley. However, the snow was highly dependent on elevation, as little to no snow fell in the valleys. 12Z January 28, 1998 By 12Z January 28, the low pressure system continues to deepen as it moves northeastward through the Mid-Atlantic region. This led to another day of widespread moderate to heavy snow in the mountains, with rain in the valleys, along a deformation zone/TROWAL axis as moisture advection continued to increase. As a result, Beckley received an additional 11.5” on this day. However, as the system moved further offshore later in the day and high pressure moved into the area, snow did taper off by the end of the day.
Overview
Analysis


A potent upper level disturbance led to the development of a low pressure system just off the coast of the Florida Panhandle on February 3rd. Over the following days the surface low took a typical path of a Nor’easter as it moved northward along the Atlantic Coast towards the Northeast. However, what was unique about this particular system was how far west of the Appalachians that moisture reached due to the storm's large circulation. As a result, cities such as Cincinnati and Louisville received nearly 2 feet of snow. The greatest impacts across West Virginia occurred across the southern parts of the state where over 2 feet of snow fell in Beckley and between a foot to a foot and a half fell across the Tri-State region near Huntington. 12Z February 3, 1998 On 12Z February 3, a strong 130+ kt upper level jet is in place across the southern US and northern Mexico and a potent mid level shortwave is digging across the Gulf of Mexico. As a result, there is an area of strong upward vertical motion throughout the Gulf Coast region, leading to the development of a low pressure system in the area. In addition, surface analysis shows an arctic high centered over northern Ontario, aiding in a supply of cold air across the central Appalachians and Ohio Valley. Light snow starts to spread into the area from south to north as the surface low moves to the northeast along the coast on the east side of the upper trough axis, but precipitation intensity is expected to increase in the days ahead. 12Z February 4, 1998 By 12Z February 4, the surface low is centered just off the coast of the Southeast US and is deepening quickly as the upper level trough axis becomes more negatively tilted. Meanwhile, significant moisture transport has led to PWAT anomalies on the east side of the low pressure led to widespread precipitation developing along a TROWAL axis to the northwest of the system. Thus, moderate to heavy now occurred across a large area of the central Appalachians and the Ohio Valley with Beckley receiving 8.3” of snow on this day and Huntington 7.1". 12Z February 5, 1998 As the surface low continues to move offshore of the Mid-Atlantic region, several bands of snow continue to impact the area along the lingering TROWAL axis to the west of the surface low. In addition, a tight pressure gradient is in place between the surface high across the Upper Midwest and surface low offshore of the Mid-Atlantic region, supporting gusty NNE winds and restricting visibilities throughout the area. While daily snowfall totals were showing sings of decreasing as Beckley only received 3.5” for the day, Huntington still picked up an additional 6.3" on this day and another round of snow was to occur before the end of the event. 12Z February 6, 1998 Another round of heavier snow developed as enhanced banding developing along the lingering TROWAL axis. In fact, Beckley received 9.5” of snow on this day, which was the heaviest daily total throughout the duration of this event. Eventually, snow did taper off as the coastal low continued to move further offshore as it tracked towards Atlantic Canada. Temperatures continued to remain around 10 degrees below normal as the arctic high continued to slowly build towards the region, but winds started to decrease as the pressure gradient relaxed and conditions continued to improve towards the end of the period.
Overview
Analysis


There are many different names for the major winter storm that occurred in mid February 2003 such as the “Blizzard of 2003” or “Presidents’ Day Storm of 2003”, but the impacts were the same regardless of name used in this particular event. The system originally developed on February 14th in the lee of the Rockies and then tracked across southern Missouri and the Tennessee Valley over the following days before eventually moving off the coast of southern New England on the 17th . Due to the track of the system and positioning of arctic high pressure in central Canada, favorable conditions were in place for significant snowfall, which occurred across a vast area from the Ohio Valley to the Mid-Atlantic and eventually Northeast. In Clarksburg, WV, a staggering 28.5” of snow fell from this system and 1 to 2 foot totals were common all across northern WV and southeastern OH. While snow amounts were much less across southern WV, eastern KY, and southwest VA, significant icing was more common across many of these areas which led to major travel disruptions and power outages. 12Z February 15, 2003 At 12Z February 15, the upper air pattern shows a southern stream shortwave trough digging across northern Mexico/west Texas, promoting cyclogenesis across the Ark-La-Tex region. Meanwhile, surface analysis shows a west-to-east oriented frontal boundary that stretches from the mid Mississippi Valley towards the central Appalachians. Ahead of the strengthening low pressure system, moisture transport increased through the day and isentropic lift leads to precipitation coverage increasing in coverage from south to north throughout the region. In addition, an arctic high is moving eastward across central Canada, bringing a continuous supply of arctic air into the central Appalachians and Ohio Valley. As a result, Clarksburg received 4” of snow and Parkersburg 2.5" of snow on this day to start the event, but greater snowfall would occur in the coming days as the blocking high to the north prevents the system from moving out of the area quickly. 12Z February 16, 2003 By 12Z February 16, the low pressure system continues to deepen as it tracks to the ENE across the Tennessee Valley. An inverted trough extending northward from this feature and the right entrance region of a 130 kt upper level jet supported an environment favorable for upward vertical motion across the central Appalachians and Ohio Valley. In addition, continued moisture transport led to positive PWAT anomalies streaming into the region and with sufficient forcing and moisture in place, widespread moderate to heavy snow occurred. In fact, Clarksburg received 7” of snow by the end of the day and Parkersburg an additional 3", but further impacts were still to occur as the arctic high across Quebec continued to slow this system’s movement and deliver fresh rounds of arctic air. 12Z February 17, 2003 As the low pressure system started to move offshore of the Mid-Atlantic States by 12Z February 17, strong cold air advection developed and kept temperatures around 15 degrees below normal across the region. Meanwhile, a lingering TROWAL axis and upper level trough allowed heavy snow to continue across the central Appalachians as Clarksburg received an additional 16” of snow, the 3rd highest daily snowfall total on record. Parkersburg received 9" of snow by the end of the day. 12Z February 18, 2003 By 12Z February 18, precipitation coverage and intensity decreased substantially as the low pressure system moved into the North Atlantic. However, upslope flow and lingering moisture in the wake of the system did support additional minor accumulations as Parkersburg received an additional 3" of snow and Clarksburg another 1.5” of snow. High pressure eventually moved into the area from the south and any lingering snow tapered off by the end of the period.
Overview
Analysis


A nearly classic meteorological setup was in place for a major winter storm across much of the Eastern US in December 2009 with blocking high pressure over Greenland sending arctic air southward while a rapidly strengthening system moved up the eastern seaboard. On December 18, a low pressure system formed in the Gulf of Mexico and rapidly strengthened as it moved off the coast of the Carolinas the following day before tracking off the coast of New England to eventually depart out to sea. As the system tracked up the coast, bands of blinding snow swung across the area creating treacherous travel conditions for millions of people across the Eastern US just a short time before the busy holiday travel season. Due to the widespread impacts that this system had, many people that were affected may refer to the storm as “Snowpocalypse” and cities such as Beckley were among some of the hardest hit after receiving 27.9” of snow with amounts exceeding 30” locally in portions of the WV mountains. 12Z December 18, 2009 On 12Z December 18, a northern stream upper level jet is in place across the Mid Atlantic region and a southern stream upper jet is moving across central Mexico. This jet stream configuration supports a favorable environment for upward vertical motion in the Gulf of Mexico and a surface low quickly develops in this area as a result. Moisture advection increases throughout the Ohio Valley and central Appalachians and precipitation coverage increases from south to north, aided by isentropic ascent. Thus, accumulating snow started to spread into the area later in the period as the system started to approach the area. In fact, Beckley received 15" of snow on this day, which is the 5th highest daily snowfall on record. 12Z December 19, 2009 The northern and southern stream started to phase together by 12Z December 19 and a strong 130+ kt upper level streak is moving across the southeast US. This sets up a very favorable region of upper level divergence around the Mid Atlantic region and leads to rapid strengthening of the associated surface low moving up the coast. Meanwhile, widespread snow has developed across the central Appalachians and Ohio Valley along a TROWAL west of the system’s track, with many areas receiving significant amounts of snow accumulation on this day. In fact, Elkins received 19.9” of snow on this day, making it the highest daily snowfall total on record. Beckley received an additional foot of snow on this day, Charleston 10.3", and Clarksburg 5". 12Z December 20, 2009 By 12Z December 20, the low pressure system moved further offshore and precipitation coverage across the region decreased significantly. However, as cold air advection continued with 850mb temperatures dropping to the -5C to -10C range, minor additional snow accumulation did occur through December 22, with most of the activity due to the orographic lift. Clarksburg received an additional 8" of snow on the 20th. Otherwise, an arctic high continued to build into the area from central Canada and gradually brought drier air into the area through the remainder of the period.
Overview
Analysis


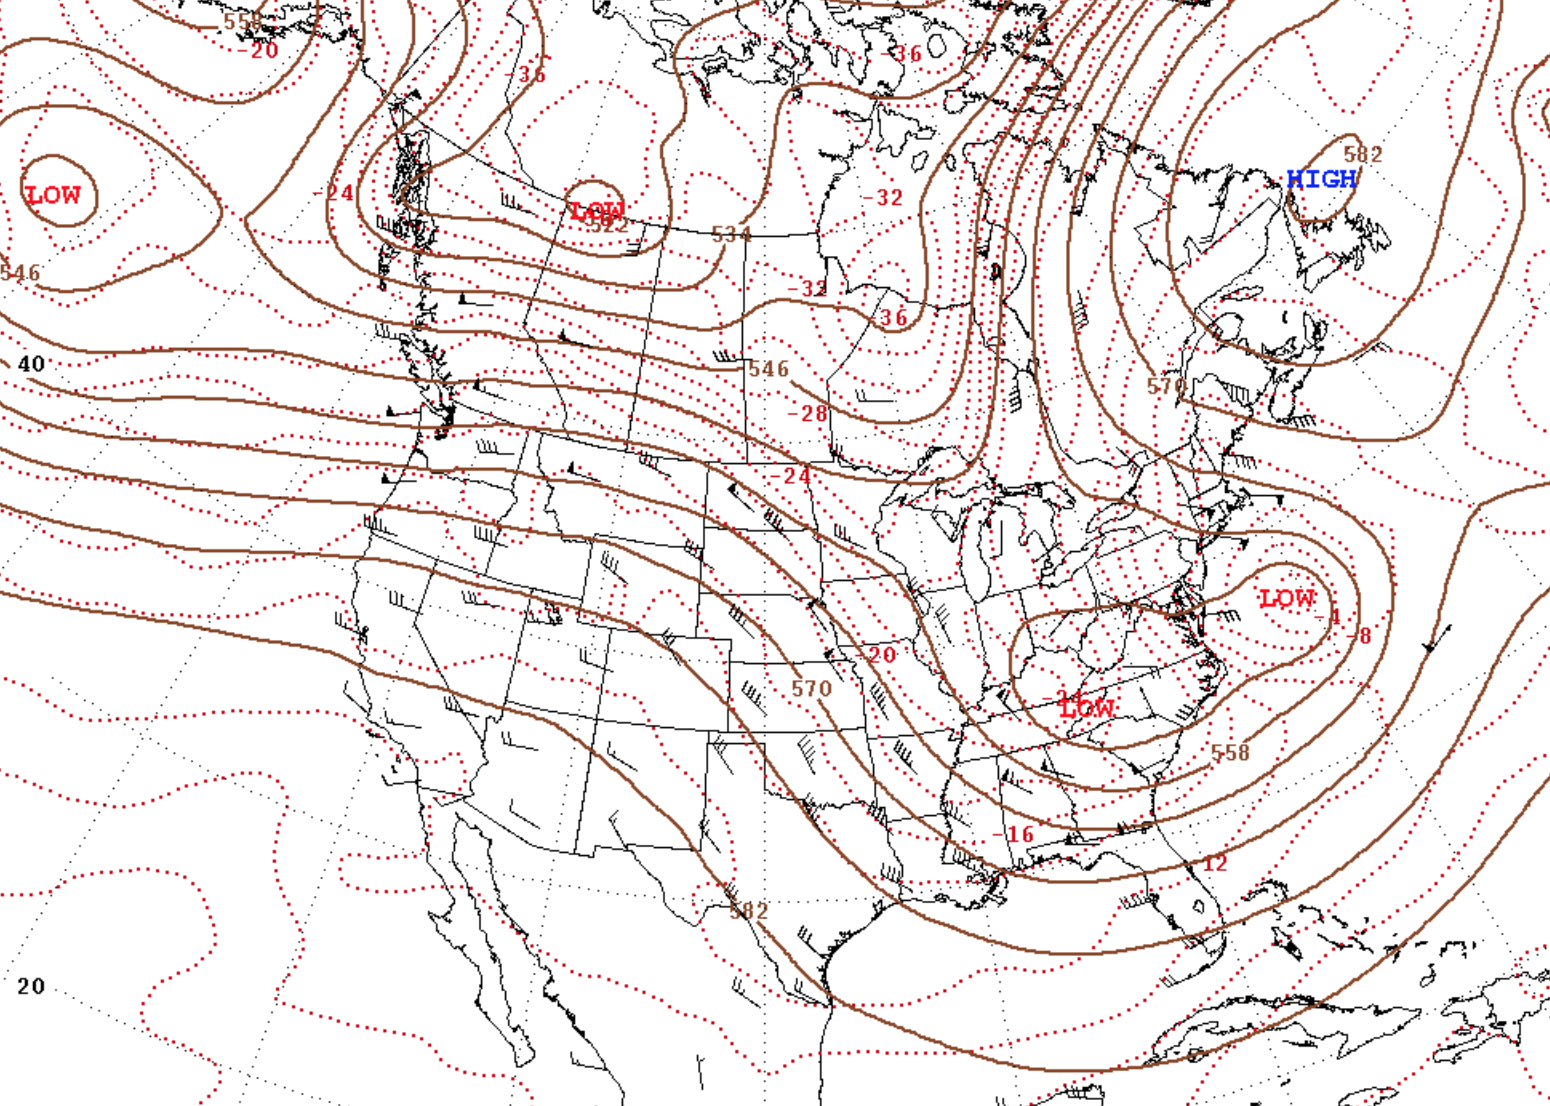
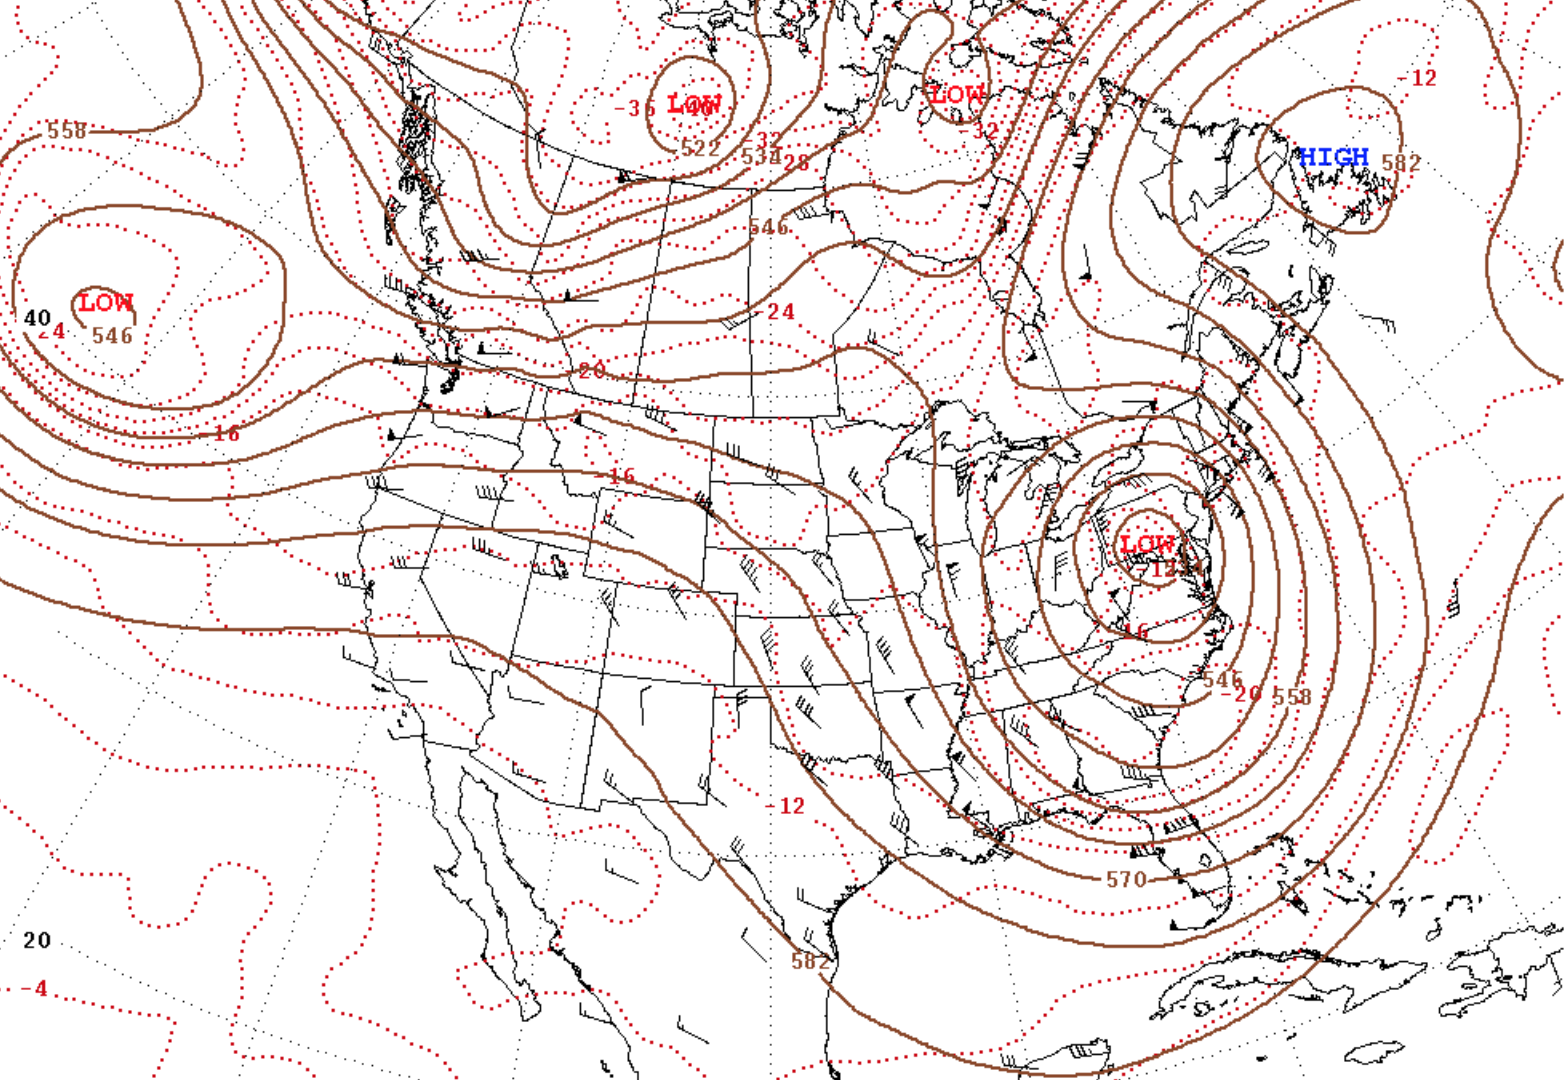
While it is not unusual for some occasional minor snow events to occur throughout the month of October in the central Appalachians, especially in the higher elevations, the month is not usually known for major snowstorms. However, this was not the case in late October 2012 as Superstorm Sandy came crashing into the Mid-Atlantic coast and delivered huge amounts of snow across much of West Virginia with cities such as Richwood receiving a staggering 36” throughout the event. While Superstorm Sandy was also known for the devastation that it caused along the coastline, Sandy’s snow was very destructive as it was a heavy wet snow that caused roofs to collapse and brought down trees and power lines to many areas. In some of the hardest hit counties in the central mountains, more than 80 percent of residents did not have power due to the storm. It was also exceptionally cold with temperatures as low as 30 degrees below normal as arctic air from Canada on the western side of the storm spread across the region. Overall, Superstorm Sandy was a rare tropical system that was able to use its abundant moisture and interaction with the cold airmass over the central Appalachians to bring historic snowfall and widespread impacts across the region. 12Z October 29, 2012 At 12Z October 29, a deep upper level trough across the eastern US interacts with a strong low pressure system offshore of the Mid-Atlantic region. This low pressure system is most widely known as “Superstorm†Sandy due to the devastation the storm produced along portions of the coastline, but residents in the central Appalachians likely remember the snowy side of Sandy more than other aspects of the storm. Conditions worsened quickly in Beckley throughout the day as Sandy continued to get steered towards the Mid-Atlantic coast due to the pronounced blocking ridge in the North Atlantic. As a result, Beckley received 9.7†on this day but conditions deteriorated even further before the extremely large storm exited the area. 12Z October 30, 2012 By 12Z October 30, Superstorm Sandy has completely transitioned to an extratropical cyclone as the storm moved inland across central Pennsylvania. Meanwhile, large scale forcing for ascent, strong cold air advection, and orographic lift led to a widespread heavy, wet snow across the central Appalachians. By the end of the day, Beckley received 12.9†of snow, which is the greatest daily snowfall total in the month of October on record. In addition, the high temperature for the day in Beckley was just 32F, nearly 30 degrees below normal. 12Z October 31, 2012 There were finally signs of conditions beginning to improve by 12Z October 31 as Superstorm Sandy becomes more vertically-stacked as the system drifts into eastern Canada. However, the massive counter-clockwise circulation around Superstorm Sandy continued to support cold air advection and upslope snow across the central Appalachians. As a result, Beckley received an additional 0.3†of snow on this day with temperatures slightly warmer than the previous day as highs now reached 34F, but were still well below normal. 12Z November 1, 2012 By 12Z November 1, what’s left of Superstorm Sandy continues to slowly weaken as it continues to drift northward into northern Canada. While there were still minor snow accumulations that occurred before the system completely exited the area as Beckley received an additional 0.1†of snow, conditions gradually improved throughout the day. As previously discussed, Superstorm Sandy remains most widely known for the devastation it caused along the coastline of the Mid-Atlantic region, especially in New York and New Jersey. However, Sandy’s snow was very impactful due to the heavy and wet nature of the snow. This storm caused downed trees, power lines, and even collapsed roofs across the region, and as a result, this turned into an unforgettable snowstorm for residents in the central Appalachians.
Overview
Analysis


A major nor’easter moved northward up the East Coast from February 11th in the Gulf of Mexico to off the coast of New England by February 14th . This system moved into a very cold air mass, which set to stage for widespread heavy snow across the central Appalachians, Mid-Atlantic, Northeast, and even potions of the Southeast on the northern edge of the storm. Significant snowfall totals of over 2 feet occurred in the WV mountains and cities such as Beckley and Elkins received 21” and 18.5” respectively. 12Z February 12, 2014 At 12Z February 12, a mid/upper level trough extends southward from the Upper Midwest into the lower Mississippi Valley. Ahead of this feature, a surface low quickly develops in the northern Gulf of Mexico and an inverted trough axis extends northward into the central Appalachians and Ohio Valley. Meanwhile, an arctic high in New England delivers a supply of arctic air throughout the region and as the low pressure system moves to the northeast through the day, snow increases in coverage from south to north. While Beckley received 9.3” of snow on this day and Elkins 2.1", precipitation intensity would increase further as the system continues to strengthen. 12Z February 13, 2014 By 12Z February 13, the mid/upper level trough continues to sharpen as it moves eastward towards the Southeast US. Meanwhile, the low pressure system continues to deepen as it moves to the NNE along the east side of the trough near the Mid-Atlantic region. Moderate to heavy snow occurred along a TROWAL axis/deformation zone to the northwest of the storm’s track, bringing substantial snowfall throughout the central Appalachians. In fact, Elkins added an impressive 16.3" of snow on this day, and Beckley added an additional 11.5”. In addition, temperatures were around 10 to 15 degrees below normal throughout the region with highs only reaching 30F in the afternoon in Elkins. 12Z February 14, 2014 While the low pressure system continues to strengthen, it was quickly lifting northward into the Gulf of Maine. As a result, conditions improved substantially across the central Appalachians as snow tapered off. In addition, temperatures recovered to near normal values by this time as Elkins reached a high of 41F and Beckley 42F for the day. However, surface analysis shows another system moving across the Great Lakes and a trailing cold front to the SSW across the Ohio Valley. This system brought another round of below normal temperatures and snow throughout the region, but snow totals were much less than the system that impacted the area in the previous days.
Overview
Analysis


A quick moving system that initially developed in the Ark-La-Tex region brought a narrow swath of significant snowfall across the central Appalachians in February 2015. Precipitation coverage rapidly increased across the region on February 21st, as this system approached. The heaviest axis of snow occurred along the WV mountains where some totals as high as 2 feet were observed along the highest ridges. However, it was also an exceptionally snowy system for Beckley as the city received 20” of snow on the 21st, making this day the second snowiest day on record. 12Z February 21, 2015 On 12Z February 21, a strong upper ridge is in place off the Pacific Coast and extends northward into northwestern Canada. Further downstream of this feature, a broad longwave trough covers nearly the entire Contiguous United States and a shortwave is rotating through the base of this feature across the Southern Plains. As a result, a surface low develops near the Ark-La-Tex region and lifts to the NNE through the day. The combination of increasing moisture transport ahead of this system and large scale forcing for ascent with height falls across the Ohio Valley and central Appalachians contributed to precipitation coverage increasing from south to north through the day. As the day progressed, precipitation intensity also greatly increased as mesoscale banding led to significant snowfall in the city of Beckley where 20” occurred on this lone day, the 2nd highest daily snowfall total on record. The snowfall was heavily dependent on elevation with much less snow falling in the valleys. 12Z February 22, 2015 By 12Z February 22, the snow quickly tapered off from west to east as the low pressure system pushed east of the central Appalachians. In addition, surface analysis shows an arctic high diving southward out of the Northern Plains and while there was no additional snow accumulation on this day, the arrival of the arctic airmass helped maintain a large snowpack across the mountains for an extended period of time.
Overview
Analysis


A warm front lifted north through West Virginia on the 3rd with rain, which caused flooding in some areas. The rain changed to sleet and wet snow from northwest to southeast during the evening hours. Heavy wet snow quickly accumulated along the Ohio River counties during the late evening on the 4th and into the morning hours of Thursday the 5th. The transition to all snow was slower from the Interstate 79 and Route 119 corridor on east into the mountain counties. The snow diminished during the afternoon of the 5th over the Ohio River counties, then by evening further east. A few snow showers lingered in the evening. A total snow accumulation of 10 to 13 inches was common from northeast Kentucky on up the Ohio Valley Counties to Wood, Pleasants, and Tyler Counties. For example, the snowfall at Huntington was 12.8 inches with a maximum measured depth of 1 foot. Snow accumulations dropped off into the 6 to 8 inch range from Clarksburg to Charleston into the mountains. The least amount of snow accumulation was on the order of 3 to 6 inches over the southern coal field counties of Wyoming and McDowell and into the southern mountains around Beckley. The wet snow accumulated on trees, especially evergreen trees. Prolonged power outages were common in the Ohio Valley Counties. A few areas waited 48 to 60 hours for their electricity to be restored. 12Z March 4, 2015 On 12Z March 4, a strong upper level ridge was positioned just off the west coast with a deep trough extending southward into the Baja California Peninsula. Downstream of the upper trough, a very strong and moist southwest flow is in place across the Central Plains and Ohio Valley, transporting moisture from the Pacific and Gulf of Mexico into the region. Meanwhile, surface analysis shows a strong cold front stretching from the Northeast US through the central Appalachians and into the Southern US. This cold front marks the edge of an arctic high that is centered across the Canadian Prairies. Initially, rain was the dominant precipitation type due to strong warm air advection ahead of the cold front, but temperatures plunged by the end of the day as arctic air started to fill into the area. While Huntington received nearly 2 inches of rain on this day but only reported a trace of snow, there were major changes by the next day as lingering moisture interacted with the incoming arctic air. 12Z March 5, 2015 By 12Z March 5, the arctic high is now centered across the Central US and cold air advection in the wake of the frontal passage has brought temperatures lower than 20 degrees below normal as Huntington reached a high of just 30F for the day. As a result, precipitation rapidly transitioned to snow across the region as the atmospheric column cooled with periods of moderate to heavy snow area-wide. In fact, Huntington received 12.8 inches of snow on this day, which ranks as the 3rd highest daily snowfall on record. 12Z March 6, 2015 As the arctic high settles right over the central Appalachians and Ohio Valley by 12Z March 6, any lingering snow showers across the area tapered off as Huntington reported just a trace of snow. However, frigid temperatures remained for one more day as Huntington reached a high of just 26 degrees, which is more than 25 degrees below normal. The cold air did eventually depart the area later in the period and temperatures returned to normal the following day.
Overview
Analysis


A historic Nor’easter affected areas from the mid-south to southern New England in late January 2016 with substantial amounts of snow and blizzard conditions in many areas. The greatest snowfall totals with this system stretched from eastern WV and northern Virginia into southern Pennsylvania and eastward towards major metropolitan areas in the Northeast where amounts of 2-3 feet were common. While snowfall amounts were slightly less across the central Appalachians and Ohio Valley, many areas still received 1- 2 feet of snowfall as a result of this storm system and major travel disruptions. The system originated as a low pressure system in Texas on January 21st and quickly moved northward along the Mid-Atlantic coast over the following days, rapidly deepening throughout this time. In addition to the snow, temperatures were about 20 degrees below normal across the region throughout the duration of the event. 12Z January 21, 2016 On 12Z January 21, upper ridging builds into western Canada and a shortwave trough is digging into west Texas and northern Mexico further downstream. Ahead of the shortwave trough, a surface low begins to develop near the Sabine River Valley in east Texas. Meanwhile, an expansive surface high is in place across much of the northern US from the Northern Plains to the Mid-Atlantic and Northeast. This feature provided a continuous supply of arctic air across the entire Ohio Valley and central Appalachians and laid the groundwork for a significant snowstorm in the coming days. 12Z January 22, 2016 At 12Z January 22, the upper trough has shifted east with its base digging into the Gulf of Mexico and becoming more neutrally tilted with time. In response, a strengthening surface low is moving northeastward across the Tennessee Valley and will continue to work its way up the coast along the east side of the upper trough axis. Widespread precipitation begins to increase from south to north over the Ohio Valley and central Appalachians as abundant moisture streams into the region and interacts with a TROWAL axis north and west of the center of the storm’s track. In addition, the supply of arctic air continues around the circulation of a surface high in the upper Great Lakes, which kept the O°C isotherm well south of the entire area. This scenario did support bands of moderate to heavy snow across the region and Huntington received 9.6" of snow, while Elkins received 6†of snow, but more would occur later in the event. 12Z January 23, 2016 A closed low is beginning to develop in the mid/upper levels as it moves across the region and the low pressure system is quickly “bombing out†off the Mid-Atlantic Coast. As cold air advection continues, a lingering TROWAL or deformation zone continues to support additional bands of snow throughout the region. Clarksburg received 18.0" of snow on this day - their 2nd highest daily snowfall on record. Other noteable snowfall amounts on this day included Elkins with 11.8†of snow and Parkersburg with 11.0" of snow. Strong and gusty north to northeast winds combined with the bands of snow continued to create hazardous travel conditions across the entire area. The snow eventually did taper off from west to east by the end of the day and conditions did improve throughout the area, but large piles of snow were left in its wake. 12Z January 24, 2016 While Clarksburg still received 8†of additional snow on this day, the low pressure system that has impacted the area the last several days moved further offshore and snow tapered off quickly as the day progressed. In addition, temperatures remained around 10 degrees below normal through the end of the as drier air continued to build into the area.
Overview
Analysis