A Severe Weather and Tropical Cyclone Climatology for the Florida Keys
William South and Joe Barrett
1. Introduction
As part of the modernization and restructuring of the National Weather Service, the Weather Forecast Office (WFO) in Key West, Florida assumed full forecast and warning responsibility for the Florida Keys and the adjacent coastal waters in November of 1999. Different types of severe weather are possible given the right atmospheric conditions. Severe thunderstorms are defined as those that produce large hail with a diameter of inch or greater, damaging wind gusts of 50 knots or greater, and/or tornadoes. Tropical cyclones making landfall across the Keys, as well as waterspouts over the adjacent coastal waters of the Florida Keys are also included in this study. The purpose of this paper is to present the most common types of severe weather and their frequencies in Monroe County and surrounding coastal waters. In turn, this paper should enhance a forecasters ability to anticipate and warn for severe weather.
The Florida Keys (figure 1) consists of a chain of islands extending west-southwest from the southeastern tip of the Florida peninsula. Upper Key Largo is on the northeast end, with Key West on the southwest end. All of the Keys are near sea level, making them vulnerable to coastal flooding. However, flash flooding is not a major concern due to lack of watersheds. The climate is maritime tropical, with a dry season (November through April) and a wet season (May through October). Strong cold fronts occasionally affect the Keys in winter. The population of Monroe County is around 80,000 (2000 census). Population density across the Keys is high, so severe weather reports for land areas are fairly representative of actual occurrences. However, severe weather reports for the adjacent coastal waters of the Florida Keys are difficult to obtain due to low mariner density over an enormous marine area.

Figure 1: Map of the Florida Keys and surrounding waters.
2. Data
Severe thunderstorm and waterspout reports were obtained from the National Climatic Data Center Storm Events Database. Waterspout reports are available from 1993 to 2001, tornado reports are available from 1950 to 2001, and damaging winds and large hail reports are available from 1959 to 2001. Severe thunderstorm and waterspout reports from 1993 to 2001 originate from the National Weather Service Storm Data publication, while severe thunderstorm and waterspout reports from 1950 to 1992 originate from the National Weather Service Storm Prediction Center.
The data sources for tropical cyclone landfall tracks across the Florida Keys are the Global Tropical/Extratropical Cyclone Climatic Atlas and Tropical Cyclones of the North Atlantic Ocean, 1871-1998. Hurricane intensity is determined by the Global Tropical/Extratropical Cyclone Climatic Atlas. Hurricanes are categorized according to the Saffir-Simpson hurricane scale.
3. Climatology
a. Tornadoes
For the purpose of this paper, the dry season is defined as the period comprising the six driest months in the Florida Keys - November through April. The wet season is defined as the period comprising the six wettest months in the Florida Keys - May through October. Based on the 1971 to 2000 climatic normals, Key West receives an average of 26.51 inches of rainfall from May through October, but only 12.43 inches of rainfall from November through April. During dry season months, most reported tornadoes were associated with frontal passages or squall lines. During wet season months, upper-tropospheric westerlies were typically weak or absent. As a result, wet season tornadoes usually occurred with tropical cyclones or as waterspouts moving onshore. Tornadoes have also been associated with weak cold frontal passages early and late in the wet season.
Tropical cyclone related tornadoes generally develop within the rainbands of a tropical cyclone. Conditions are most favorable for tornadoes to develop in stronger thunderstorm cells, located in the outer rainbands of the right-front quadrant of a tropical cyclone that has moved less than 25 nautical miles over land (Ramage 1995). The frictional slowing of the surface wind creates a large vertical shear strongly favoring tornado formation (Ramage 1995).
- YEARLY DISTRIBUTION
Figure 2 shows the decadal distribution of tornadoes in Monroe County. The trend in tornado climatology indicates an increase in reported tornadoes over the past 51 years in Monroe County. Between 1950 and 1980, there were 15 tornadoes reported. From 1980 to 2001, there were 35 tornadoes reported. There were twenty tornadoes reported in the 1990s, which are by far the most tornadoes reports in any decade. One possible explanation of this increase in tornado reports could be attributed to the National Weather Service severe thunderstorm verification program, which began in 1980. Additionally, population increases, improved verification techniques, and data collection methods can alter statistical results, leading to an apparent increase in tornado reports (Hales and Kelly 1985, Hales 1993).
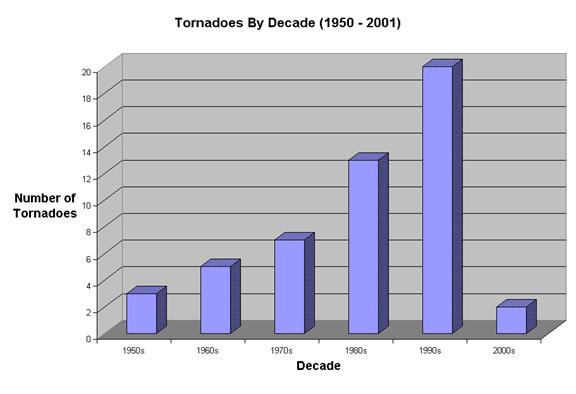
Figure 2: Decadal distribution of tornadoes in Monroe County.
- MONTHLY DISTRIBUTION
Figure 3 indicates the monthly distribution of tornadoes in Monroe County. Tornadoes occur most frequently during the west season, where three times as many tornadoes were reported as compared to the dry season. The month of June exhibited the highest monthly tornado frequency. The month of January exhibited the lowest monthly tornado frequency, with zero reports. Tornado frequency increased steadily from January to March, with a rapid increase occurring from May to June. Tornado frequency dropped sharply from June to July, with a rapid increase observed from July to August. Tornado frequency was steady from August to September, followed by a gradual decline in observed tornadoes from October to December.
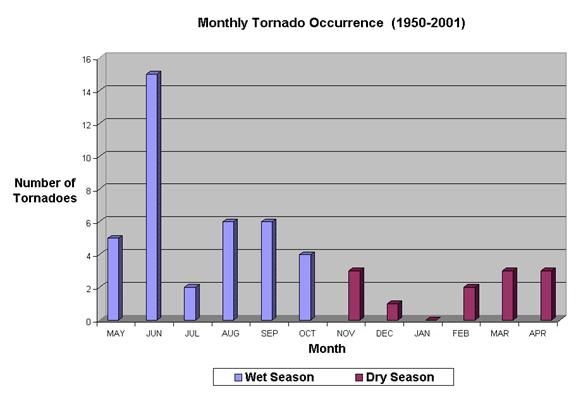
Figure 3: Monthly distribution of tornadoes in Monroe County.
- HOURLY DISTRIBUTION
Figure 4 shows the hourly distribution of tornadoes in Monroe County. There is a distinct peak of tornado occurrence during the wet season in the mid-afternoon to early evening when most thunderstorms occur. Over half of the reported tornadoes occurred between the hours of 1400 and 2000 EST. A significant percentage of tornadoes, 28%, occurred during the hours of 1600 and 1700 EST. Almost half of the tornadoes reported during the dry season, 42%, occurred between the hours of 1700 EST and 1900 EST.
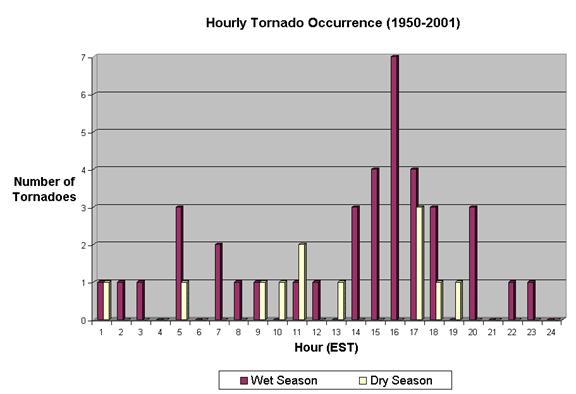
Figure 4: Hourly distribution of tornadoes in Monroe County.
- FUJITA SCALE
The Fujita scale, (Table 1), was developed by Fujita (1981) for the purpose of classifying tornadoes by wind speed. Table 2 shows the distribution of tornadoes in Monroe County by the Fujita scale. There has never been a tornado-related fatality recorded in the Florida Keys. Of the 50 tornadoes reported, 27 were rated F0, and only five injuries were caused by these tornadoes. Fourteen tornadoes were rated F1, with no reported injuries resulting from these tornadoes. Only five tornadoes were rated F2, but these were responsible for 71 of the 76 reported injuries caused by all tornadoes. Of the five F2 tornadoes reported, three were associated with tropical cyclones. Two F2 tornadoes were associated with Hurricane Agnes in 1972, and one was associated with Tropical Storm Mitch in 1998. Four F2 tornadoes occurred in the Lower Keys, while one occurred in the Upper Keys. Three F2 tornadoes were observed in June, one was observed in April, and one was observed in November. No F3, F4, or F5 tornadoes were reported. Four tornadoes were of unknown intensity.
|
F-scale
|
Intensity
|
Wind Speed
|
|
F0
|
weak
|
40-72 mph
|
|
F1
|
weak
|
73-112 mph
|
|
F2
|
strong
|
113-157 mph
|
|
F3
|
strong
|
158-206 mph
|
|
F4
|
violent
|
207-260 mph
|
|
F5
|
violent
|
261-318 mph
|
Table 1: Fujita scale.
|
F-scale
|
Number of Tornadoes
|
|
F0
|
27
|
|
F1
|
14
|
|
F2
|
5
|
|
Unknown
|
4
|
Table 2: Fujita-scale distribution of tornadoes in Monroe County from 1950 to 2001.
b. Waterspouts
A waterspout is simply a tornado over water (Glickman 2000). Waterspouts may be classified as either supercell tornadoes over water or nonsupercell tornadoes over water. Supercell waterspouts are primarily associated with intense, baroclinic, synoptic-scale disturbances with attendant strong vertical wind shear, or with tropical cyclones. Approximately 10% of waterspouts in Florida are supercell waterspouts (Henry et al. 1994). Most waterspouts on Florida Keys coastal waters are of the nonsupercell variety. Less intense synoptic-scale disturbances, such as a weak trough of low pressure or an easterly wave, favored nonsupercell waterspout development, as did weak wind shear in the lower troposphere coupled with an unstable atmosphere to at least 5000 feet (Golden 1974). On average, waterspout duration is 14 minutes (Henry et al. 1994).
- YEARLY DISTRIBUTION
Figure 5 shows the yearly distribution of waterspouts on Monroe County coastal waters. Between 1993 and 1998, there were 242 waterspouts reported. From 1999 to 2001, there were 284 waterspouts reported. The increase in waterspout reports can be attributed to such factors as population awareness, improvements in communication, and enhanced verification efforts. The Lower Keys Waterspout Project, conducted from May to September 1969, recorded 390 waterspouts and funnel clouds within 50 nautical miles of Key West (Golden 1970). Therefore, even with the increase of public awareness and improvements in communication, one is led to the conclusion that waterspouts are grossly underreported.
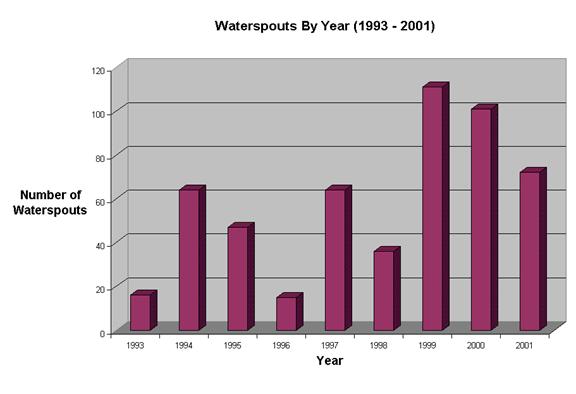
Figure 5: Yearly distribution of waterspouts on Monroe County coastal waters.
- MONTHLY DISTRIBUTION
Figure 6 shows the monthly distribution of waterspouts in Monroe County coastal waters. For the period 1993 to 2001, 90% of all waterspouts occurred during the wet season, which is consistent with the findings of Golden (1973). The summer months of July, August, and September are the peak months for waterspout formation, with approximately 60% of waterspouts reported during this three-month stretch. Sea surface temperature, air temperature, and specific humidity are generally greatest during these months, which creates a favorable environment for waterspouts to occur. Also, wind shear is generally most favorable for waterspout formation during the summer months of July, August, and September.
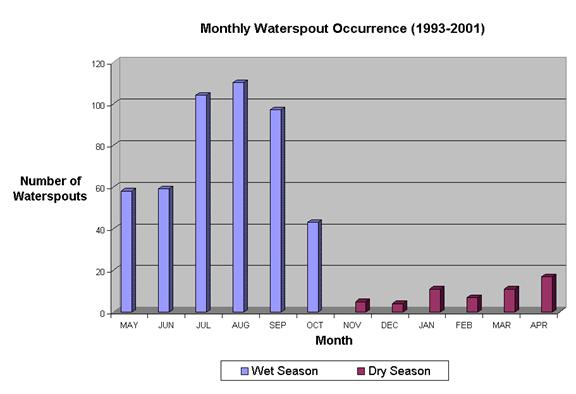
Figure 6: Monthly distribution of waterspouts occurring on Monroe County coastal waters.
- HOURLY DISTRIBUTION
Figure 7 shows the hourly distribution of waterspouts on Monroe County coastal waters. During the wet season, the peak time for waterspout occurrence is from 1200 to 1800 EST. This peak time roughly corresponds to the time of the maximum growth of the Keys' cumulus congestus cloud line. As a result, it can be concluded that most waterspouts during the wet season are indeed nonsupercell waterspouts. Of particular interest is the number of waterspouts reported during the morning hours of the dry season. Approximately 45% of waterspouts during the dry season occur between the hours of 0600 and 1000 EST, possibly as a result of relatively cooler air aloft over the warm waters, enhancing deep-layered instability.
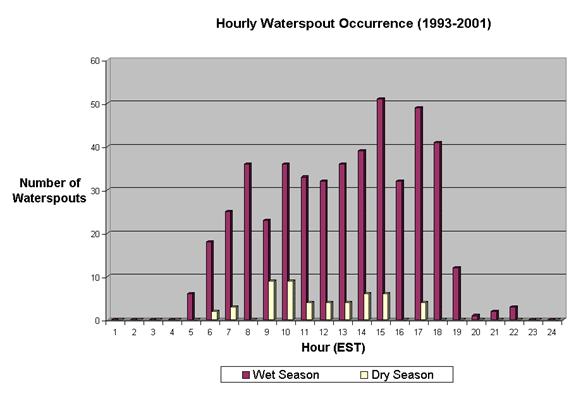
Figure 7: Hourly distribution of waterspouts occurring on Monroe County coastal waters.
c. Damaging Wind
One National Weather Service criterion for defining a severe thunderstorm is wind gusts of at least 50 knots. Hence, wind gusts of at least 50 knots will be used as the criteria for damaging wind.
- YEARLY DISTRIBUTION
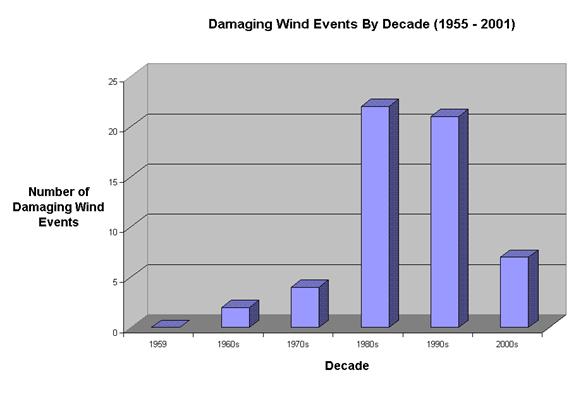
Figure 8 shows the decadal distribution of damaging wind events in Monroe County. There was a significant increase in damaging wind events since 1980. Between 1955 and 1980, there were six damaging wind events reported. From 1980 to 2001, there were 50 damaging wind events reported. The significant increase in damaging wind events is likely due to the creation of the National Weather Service severe thunderstorm verification program in 1980. During the last 10 years, the increased use of cellular phones has probably allowed the public to report storm damage in a more prompt fashion.
Figure 8: Decadal distribution of damaging wind events in Monroe County.
- MONTHLY DISTRIBUTION
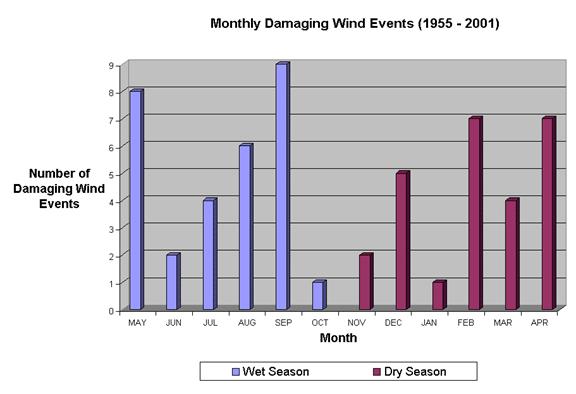
Figure 9 shows the monthly distribution of damaging wind events in Monroe County. Unlike tornadoes and waterspouts, there is not an overwhelming number of damaging wind events during the wet season. For the period 1955-2001, 54% of damaging wind events occurred during the wet season. Approximately 34% of damaging wind events occurred from March through May. Squall line development is most likely to produce damaging winds from March through May. Approximately 34% of damaging wind events occurred from July through September.
Figure 9: Monthly distribution of damaging wind events in Monroe County.
- HOURLY DISTRIBUTION
Figure 10 shows the hourly distribution of damaging wind events in Monroe County. The peak time period for damaging wind events is during the late afternoon to early evening hours. Approximately 55% of damaging wind events occurred from 1600 to 2100 EST. A relatively large number of damaging wind events, about 20%, occurred at the peak hour of 1700 EST. This is consistent with the peak in tornadic activity (1600 and 1700 EST).
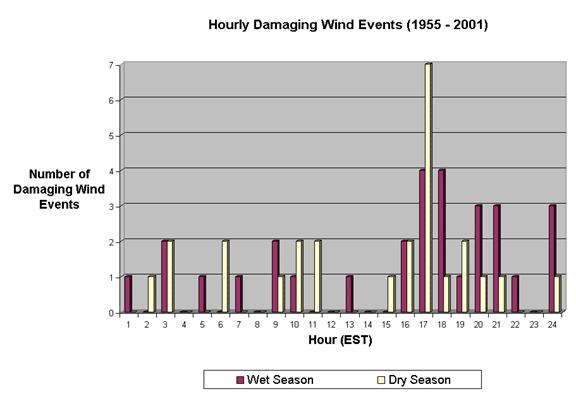
Figure 10: Hourly distribution of damaging wind events in Monroe County.
d. Severe Hail
Severe hail is large hail with a diameter of � inch or greater. Well-developed thunderstorms, whose tops may extend above 50,000 feet, are most likely to produce large hail (Ramage 1995). The probability of hail reaching the ground increases with the height of the cloud tops of the associated thunderstorm (Ramage 1995). In summer, when clouds are at their maximum potential for producing hail, the freezing level is usually above 15,000 feet, and thunderstorm updrafts are seldom strong enough to support hail growth (Ramage 1995). This explains the infrequency of severe hail reports in the Florida Keys.
For the period 1955-2001, there were only three severe hail reports in Monroe County. There has never been a hail report of over one and three-quarters of an inch in diameter in Monroe County. Due to the lack of severe hail events, inadequate data is available for any type of climatological conclusion. The following climatological summary of hail in Florida, from Henry et al. (1994), most likely applies to Monroe County as well:
Except for the panhandle of Florida, the sunshine state can expect a hail event about once every other year, or even less frequently. The hailstones are almost always small and in most cases the intensity is light. Because of the thick surface layer of warm air in summer, most hail occurs before the warmest months, with May being the number one month, followed in order by June and April; these three months account for approximately 60 percent of hail occurrences. Fifty-four percent of hail with a diameter of three-quarters of an inch or greater occurs in spring. Thirty-five percent of hail with a diameter of three-quarters of an inch or greater occurs in summer. Hail is most frequent between 1300 and 1400 EST. Hail is infrequent before 1200 EST and after 1600 EST.
e. Tropical Storms
A tropical storm is a tropical cyclone with maximum sustained winds between 34 and 63 knots. The term tropical cyclone encompasses tropical depressions, tropical storms, hurricanes, and typhoons. The tropical cyclone is one of the most intense and feared storms in the world. Mature tropical cyclones range in diameter from 60 to well over 600 miles (Glickman 2000).
Table 3 shows tropical storms that made landfall in the Florida Keys between 1871 and 2001. There have been relatively long periods with no tropical storm landfalls in the Florida Keys (e.g. 1892-1927). From 1871 to 2001, the average periodicity of tropical storms in the Florida Keys is approximately 10 years. Landfall estimates are not as reliable prior to the 1850s due to poor communications and sparse development along the United States coastline.
|
Name
|
Date
|
Name
|
Date
|
|
Not Named
|
September 23, 1888
|
Not Named
|
September 4, 1945
|
|
Not Named
|
October 4-5, 1889
|
Not Named
|
February 2, 1952
|
|
Not Named
|
October 6, 1891
|
Greta
|
September 27, 1970
|
|
Not Named
|
August 12, 1928
|
Dennis
|
August 16, 1981
|
|
Not Named
|
August 29, 1932
|
Marco
|
October 9-10, 1990
|
|
Not Named
|
July 28, 1936
|
Gordon
|
November 14-15, 1994
|
Table 3: Tropical storms that made landfall in the Florida Keys from 1871 to 2001.
- MONTHLY DISTRIBUTION
Figure 11 shows the monthly distribution of tropical storms that have made direct landfall in the Florida Keys between 1871 and 2001. From 1871 to 2001, 9 of 12 tropical storms to hit the Florida Keys occurred in August, September, and October. Only one tropical storm made landfall in the Florida Keys during July, and only one tropical storm made landfall in the Florida Keys in November. One tropical storm made landfall outside of hurricane season in February. More specifically, 9 of 12 tropical storms to hit the Florida Keys occurred from mid-August to early October. This data corresponds closely to tropical cyclone activity across the entire Atlantic Basin, which peaks in early September.
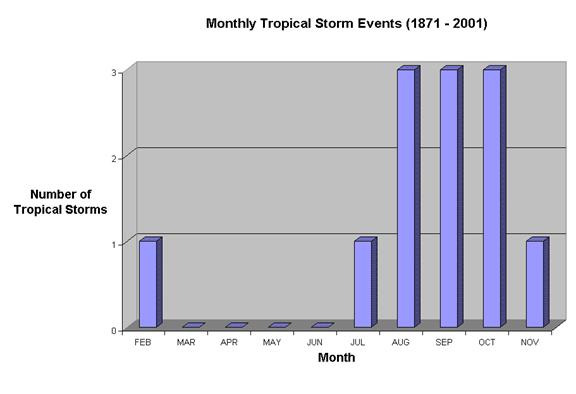
Figure 11: Monthly distribution of tropical storms in the Florida Keys.
- TRACK DISTRIBUTION
Figure 12 shows the tracks of tropical storms that made landfall in the Florida Keys between 1871 and 2001. From 1871 to 2001, 4 of 12 tropical storms to hit the Florida Keys moved northward through the western Caribbean Sea, passing between the Yucatan Peninsula and western Cuba. Three of these four tropical storms formed over the Caribbean Sea, and one developed east of the Lesser Antilles. Approximately 33% of tropical storms that crossed the Florida Keys passed between the north coast of Cuba and the northern Bahamas, and the remaining 25% of tropical storms that made landfall in the Florida Keys moved parallel to the island of Cuba.
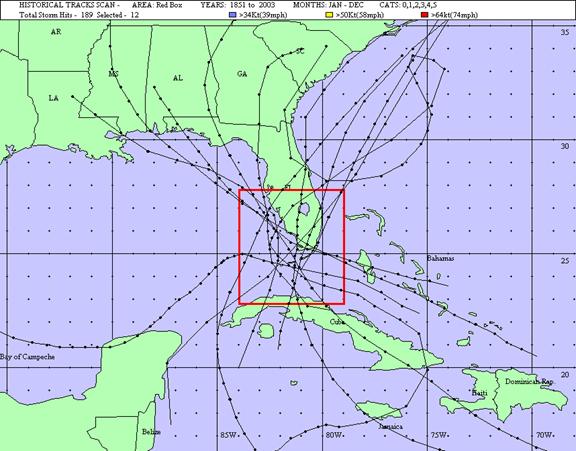
Figure 12: Track distribution of tropical storms in the Florida Keys.
f. Hurricanes
A hurricane is a tropical cyclone with maximum sustained winds of 64 knots or greater. Monroe County (including both the Florida Keys and mainland portion) is the most hurricane-prone county in the United States (Elsner and Kara 1997). Monroe County's hurricane return period, or average time between successive hurricanes, is only four years. Monroe County's hurricane wait time, or number of consecutive years in which the probability of receiving at least one hurricane becomes greater than 50 percent, is just two years.
Table 4 shows hurricanes that made landfall in the Florida Keys between 1871 and 2001. There have been relatively long periods with no hurricanes making landfall in the Florida Keys (e.g. 1967-1986). In contrast, there have been multiple hurricanes in the same year (e.g. 1948 and 1966). Of the 24 hurricanes of known intensity to cross the Florida Keys, half were major hurricanes (category 3 or higher). The Labor Day Hurricane of 1935, which tracked across the Middle Keys, is one of only three category 5 hurricanes to make landfall in the United States since the 1850s. Landfall estimates are not as reliable prior to the 1850s, due to poor communications and sparse development along the United States coastline. Some hurricanes had a significant impact on portions of the Florida Keys, despite not making landfall over the area. This was the case with Hurricane Andrew, which in 1992 caused significant damage in portions of the Upper Keys.
|
Name
|
Date
|
Intensity
|
Name
|
Date
|
Intensity
|
|
Not Named
|
October 19, 1876
|
Unknown
|
Not Named
|
October 18, 1944
|
Category 3
|
|
Not Named
|
September 7-8, 1878
|
Unknown
|
Not Named
|
October 11, 1947
|
Category 1
|
|
Not Named
|
September 24-25, 1894
|
Category 2
|
Not Named
|
September 21, 1948
|
Category 3
|
|
Not Named
|
September 10, 1897
|
Category 1
|
Not Named
|
October 5, 1948
|
Category 3
|
|
Not Named
|
June 16-17, 1906
|
Category 1
|
Easy
|
September 3, 1950
|
Category 1
|
|
Not Named
|
October 17-18, 1906
|
Category 4
|
Donna
|
September 9-10, 1960
|
Category 4
|
|
Not Named
|
October 11, 1909
|
Category 2
|
Isbell
|
October 14, 1964
|
Category 3
|
|
Not Named
|
October 17, 1910
|
Category 3
|
Betsy
|
September 7-8, 1965
|
Category 3
|
|
Not Named
|
November 15, 1916
|
Category 1
|
Alma
|
June 8, 1966
|
Category 3
|
|
Not Named
|
September 9-10, 1919
|
Category 4
|
Inez
|
October 4-5, 1966
|
Category 1
|
|
Not Named
|
September 28, 1929
|
Category 2
|
Floyd
|
October 12, 1987
|
Category 1
|
|
Labor Day Hurricane
|
September 2-3, 1935
|
Category 5
|
Georges
|
September 25, 1998
|
Category 2
|
|
Not Named
|
October 6, 1941
|
Category 3
|
Irene
|
October 15, 1999
|
Category 1
|
Table 4: Hurricanes that made landfall in the Florida Keys from 1871 to 2001.
- MONTHLY DISTRIBUTION
Figure 13 shows the monthly distribution of hurricanes that made landfall in the Florida Keys between 1871 and 2001. From 1871 to 2001, 23 of 26 hurricanes to hit the Florida Keys occurred during September and October. Only two hurricanes made landfall in the Florida Keys during June, none in July and August, and just one in November. Of the major hurricanes that crossed the Florida Keys, 10 of 11 hurricanes occurred during September and October. This data corresponds closely to tropical cyclone activity across the entire Atlantic Basin, which peaks in early September.
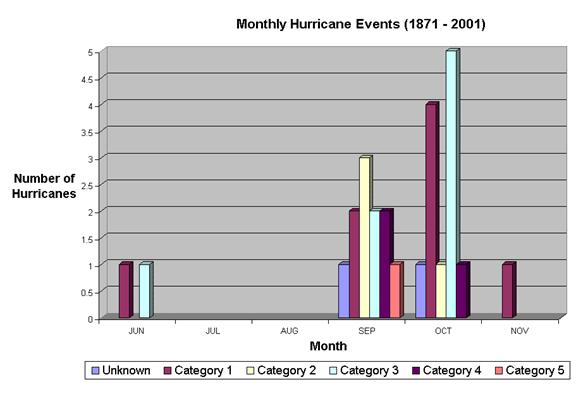
Figure 13: Monthly distribution of hurricanes in the Florida Keys.
- TRACK DISTRIBUTION
Figure 14 shows the tracks of hurricanes that made landfall in the Florida Keys between 1871 and 2001. From 1871 to 2001, 14 of 26 hurricanes to hit the Florida Keys moved northward through the western Caribbean Sea and over western Cuba. Of these 14 hurricanes, 12 formed over the Caribbean Sea, one developed over Nicaragua, and one developed east of the Lesser Antilles. Approximately 31% of hurricanes that crossed the Florida Keys moved between Cuba and the northern Bahamas, while the remaining 15% of hurricanes that made direct landfall in the Florida Keys moved parallel to the island of Cuba.
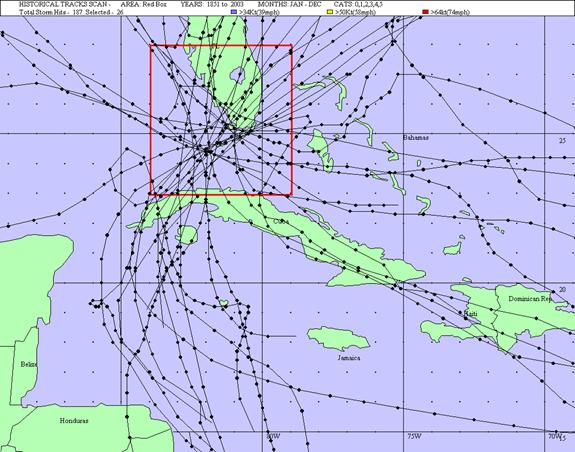
Figure 14: Track distribution of hurricanes in the Florida Keys.
4. Summary
Tornadoes over the Florida Keys mostly occur during the wet season, with June being the most active month. The majority of tornadoes, 54%, were rated F0. Approximately 28% of tornadoes were rated F1. Only five F2 tornadoes occurred, however they resulted in 71 of the 76 injuries caused by all tornadoes. No F3, F4, or F5 tornadoes were reported. Over half of the reported tornadoes occurred between the hours of 1400 and 2000 EST.
Most (90%) of the waterspout events occurred during the wet season, and most of the wet season waterspouts were probably nonsupercell waterspouts.The summer months of July, August, and September are the peak months for waterspout occurrence. During the wet season, the peak waterspout occurrence is between 1200 to 1800 EST.
The majority of damaging wind events occurred from March to May, and from July to September. The peak time period for damaging winds to occur is the late afternoon to early evening hours, very similar to the peak time for tornadoes.
From 1959 to 2001, there were only three severe hail reports. Two of the reports were from February, with one from August. There has never been a hail report of over one and three-quarters of an inch in diameter in Monroe County.
Tropical storms are less frequent than hurricanes in the Florida Keys. Tropical storms are most likely to hit the Florida Keys from mid August to early October. Since 1871, there is an even distribution of tropical storm tracks ranging from northward through the western Caribbean Sea to west to northwestward through the Florida Straits.
Hurricanes are frequent in the Florida Keys, and are most likely in September and October. Since 1871, approximately 54% of hurricanes to hit the Florida Keys moved northward through the western Caribbean Sea and over western Cuba.
5. References
Burkman, Bruce, Michael Berry, Timothy Doyle, and Donovan Landreneau, 1999: A Severe Weather and Tropical Cyclone Climatology for the NWSO Shreveport, Louisiana County and Parish Warning Area. NOAA Technical Memorandum NWS SR-201, National Weather Service Southern Region, Fort Worth, TX.
Fujita, T. T., 1981: Tornadoes and Downbursts in the Context of Generalized Planetary Scales. J. Atmos. Sci., 38, 1511-1534.
Glickman, Todd S., 2000: Glossary of Meteorology, Second Edition. Boston, MA, American Meteorological Society.
Golden, J.H., 1970: The Lower Keys Waterspout Project, May-September, 1969. Bulletin of the American Meteorological Society, 51, 235-236.
Golden, J.H., 1973: Some Statistical Aspects of Waterspout Formation. Weatherwise, 26, 108-117.
Golden, J.H., 1974: Scale-Interaction Implications for the Waterspout Life Cycle II. Journal of Applied Meteorology, 13, 693-709.
Hales, John E. Jr. and Donald L. Kelly, 1985: The Relationship Between the Collection of Severe Thunderstorm Reports and Warning Verification. Preprints, 14th Conference on Severe Local Storms, Indianapolis, IN, American Meteorological Society.
Hales, John E. Jr., 1993: Biases in the Severe Thunderstorm Data Base: Ramifications and Solutions. Preprints, 13th Conference Weather Forecasting and Analysis, Vienna, VA, American Meteorological Society.
Henry, James A., Kenneth M. Portier, and Jan Coyne, 1994: The Climate and Weather of Florida. Sarasota, FL, Pineapple Press, Inc.
Elsner, J.B. and Kara, A.B, 1997: Hurricane Return Periods Along The Gulf Coast And Florida. NOAA Technical Memorandum NWS SR-192, Florida State University and National Weather Service Southern Region, Fort Worth, TX.
National Climatic Data Center, 2002: Storm Events Web Page. https://lwf.ncdc.noaa.gov/oa/ncdc.html
Neumann, Charles et. al, 1999: Tropical Cyclones of the North Atlantic Ocean, 1871-1998. Historical Climatology Series 6-2, NCDC and TPC, Fifth revision, Asheville, NC.
Ramage, Colin S., 1995: Forecasters Guide to Tropical Meteorology. Air Weather Service Technical Report 240 Updated, Air Weather Service, Scott Air Force Base, IL.
Spaulding, Paul, 1997: A Severe Weather and Hurricane Climatology for the WFO Corpus Christi County Warning Area. NOAA Technical Memorandum NWS SR-188, National Weather Service Southern Region, Fort Worth, TX.
U.S. Navy and National Climatic Data Center: Global Tropical/Extratropical Cyclone Climatic Atlas, September 1996.