Coastal Flooding in the Florida Keys
When coastal flooding is expected or ongoing, the latest text-based products/updates will be available here.

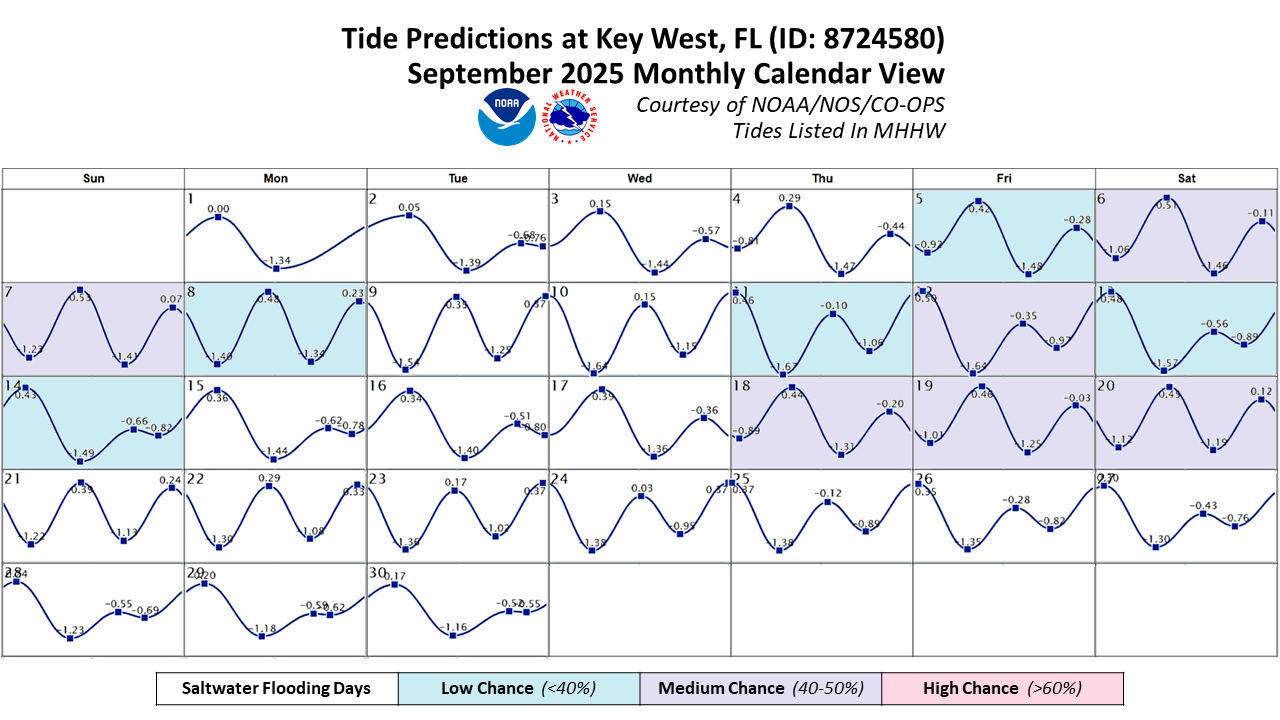
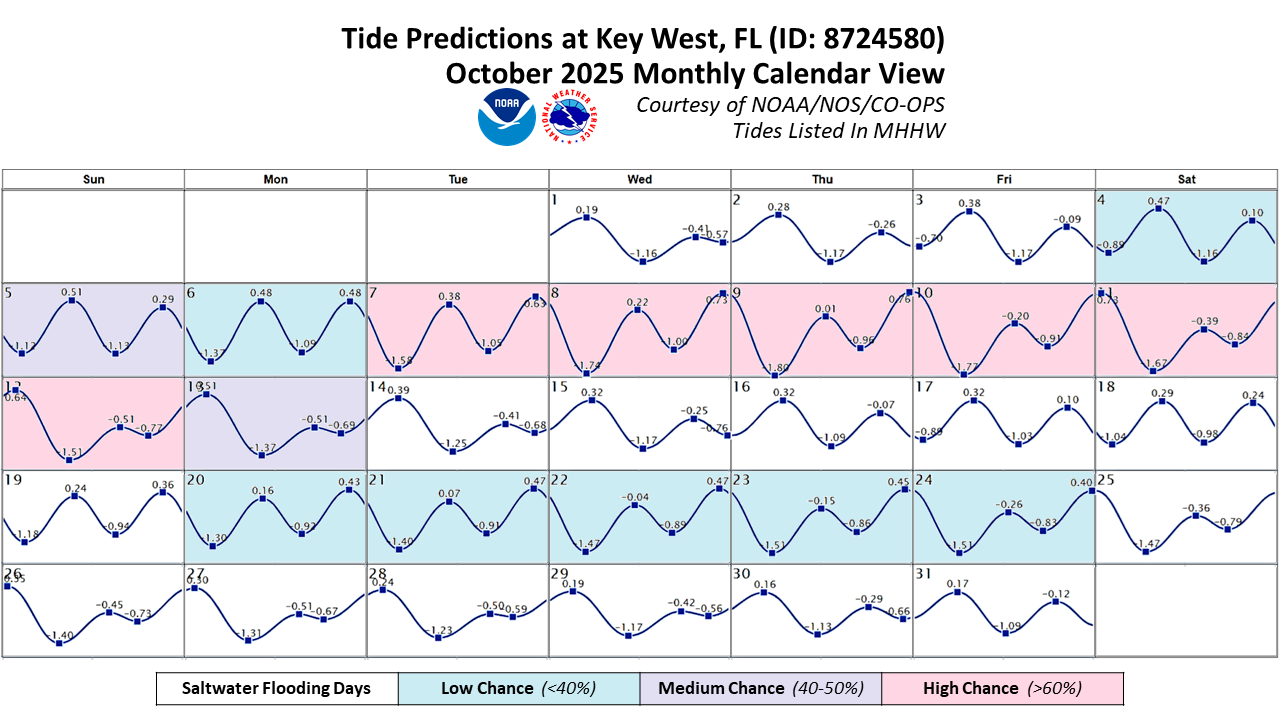
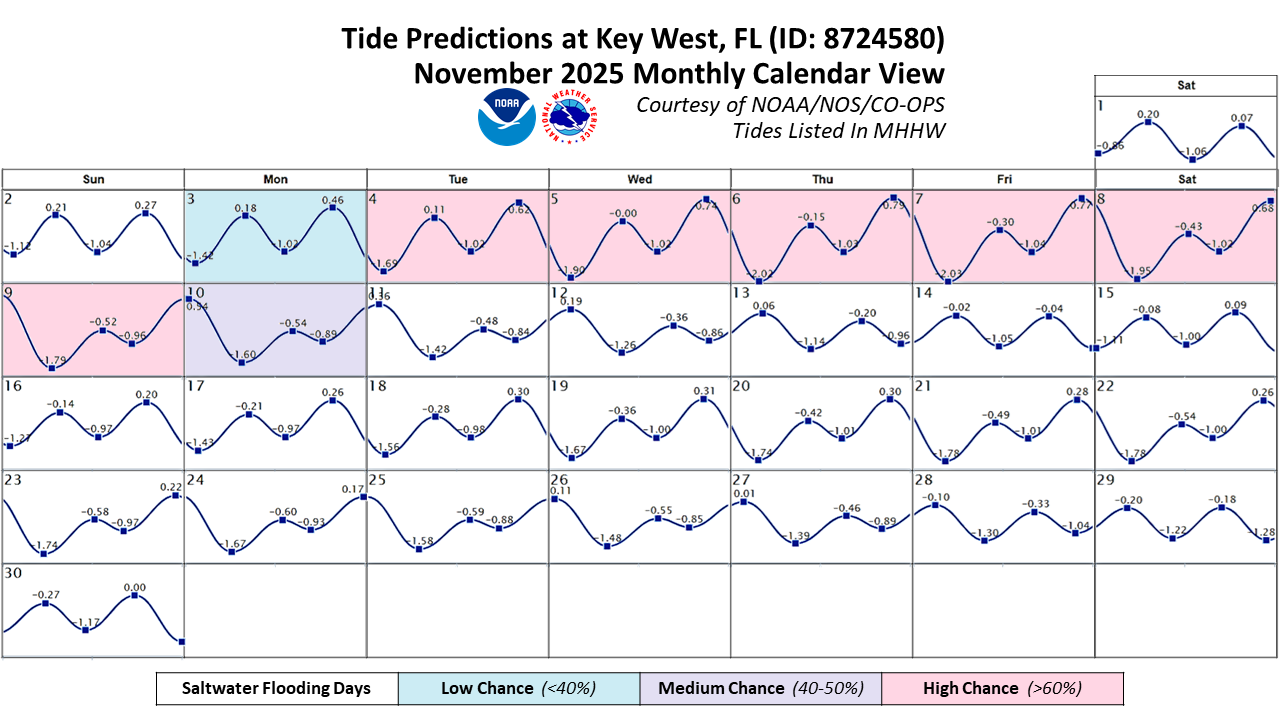
Below are calendar-view Key West tides for upcoming autumn months, with the chances of coastal flooding highlighted for 'low chance', 'medium chance', and 'high chance' of flooding. (Click to enlarge.)
 |
 |
|
| September 2025 | October 2025 | |
 |
 |
|
| November 2025 | December 2025 |
About Coastal Flooding in the Florida Keys
The low elevation and porous nature of the Florida Keys make us prone to coastal flooding, on average, several times each year. Low-lying areas can easily experience flooding due to higher tides, despite not being particularly close to shore. One part of this is that the limestone that makes up the island chain is a porous rock, consisting of fossilized coral reef (Upper/Middle Keys) and sand bars (Lower Keys). This allows water to eventually seep up through the rock, inundating areas that may not otherwise be visibly connected to the flooding's source.
Another important aspect when it comes to coastal flooding is the topography and bathymetry of the area. The shape of Florida Bay can act as a funnel, aiding in the piling up of water that then results in saltwater flooding of the bayside communities in the Upper Keys. The bathymetry of the Bay then leads to slowly receding water levels, extending the period of flooding for Upper Keys residents and visitors.
Gulf Stream Impacts on Coastal Flooding
Occurrences of Minor Coastal Flooding at Key West
Sea Level Rise and Coastal Flooding
How does the Florida Keys National Weather Service know when there may be coastal flooding?
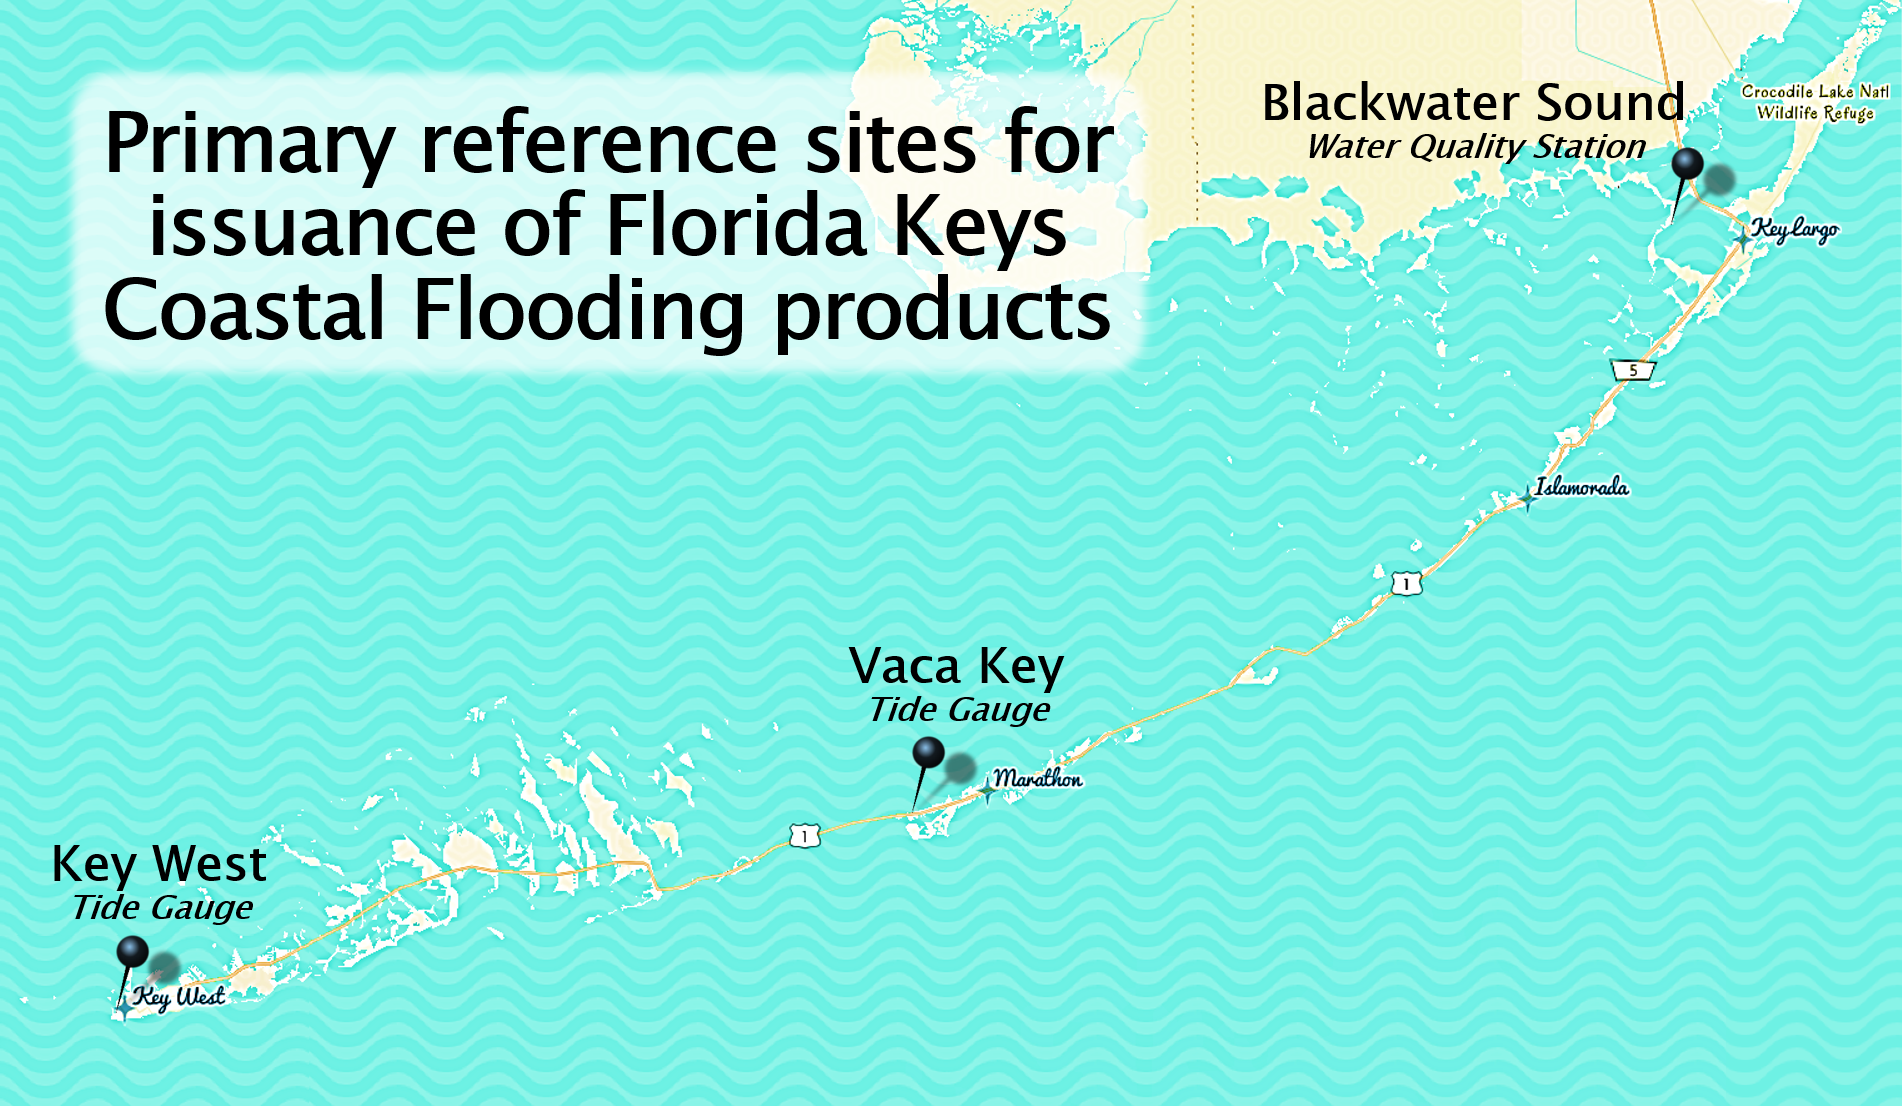
The Florida Keys have three reference locations to evaluate the need for coastal flooding products.
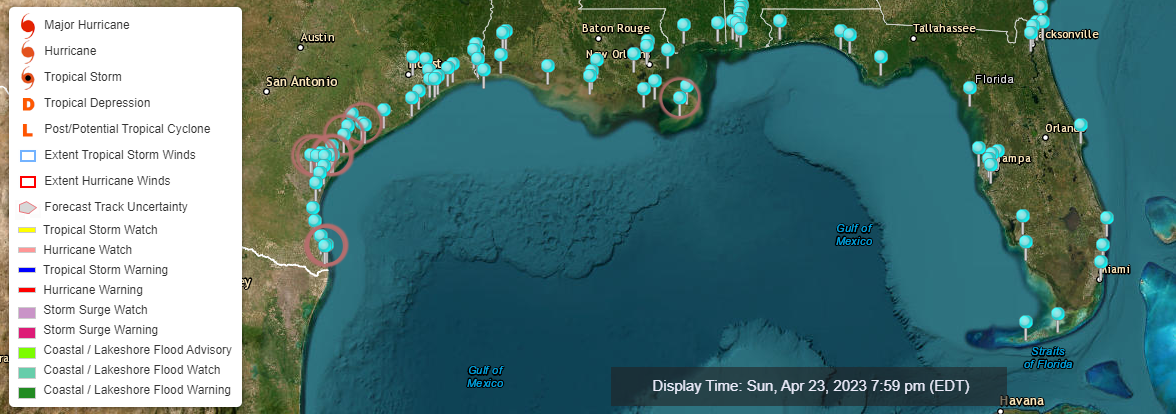
Another great resource to see when there could be coastal flooding impacts is NOAA's Coastal Inundation Dashboard, provided by the National Ocean Service's Center for Operational Oceanographic Products and Services. This dashboard depicts tide gauge stations around the country and indicates when a station may be experiencing flooding conditions (noted by red rings around a station below). Users also have the ability to overlay watches and warnings on the map, as well as see projections for sea level rise, among other tools.
What coastal flood products are issued by the Florida Keys National Weather Service and when are they issued?

What water levels are typically associated with the need for a coastal flood product?
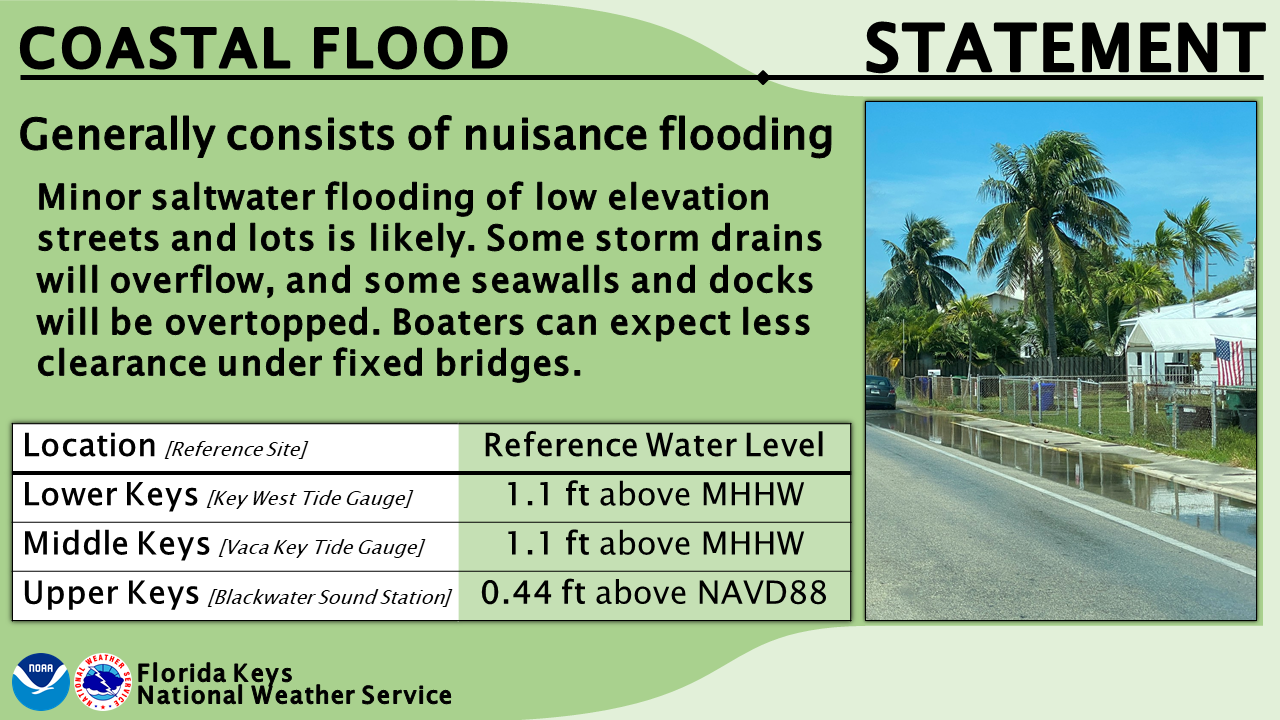
The table below (and on each respective graphic above) shows the basic level at which certain products could be needed. Florida Keys NWS meteorologists evaluate each event on its own, taking into account these water levels, current/expected weather patterns, and the reading departures from the predicted tide levels.
| Coastal Flood Statement | |
| Reference Site | Reference Water Level |
| Key West Tide Gauge | 1.1 ft above MHHW |
| Vaca Key Tide Gauge | 1.1 ft above MHHW |
| Blackwater Sound Water Quality Station | 0.44 ft above NAVD88 |
| Coastal Flood Advisory | |
| Reference Site | Reference Water Level |
| Key West Tide Gauge | 1.6 ft above MHHW |
| Vaca Key Tide Gauge | 1.6 ft above MHHW |
| Blackwater Sound Water Quality Station | 0.74 ft above NAVD88 |
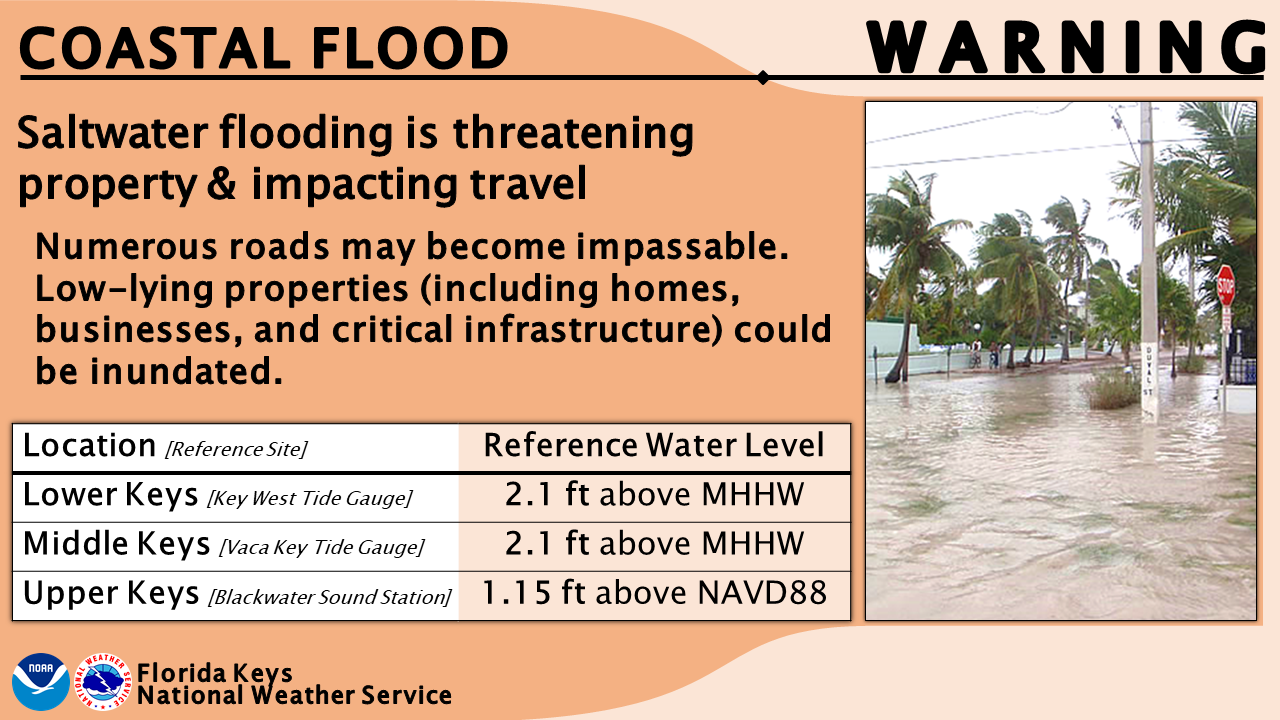
| Coastal Flood Warning | |
| Reference Site | Reference Water Level |
| Key West Tide Gauge | 2.1 ft above MHHW |
| Vaca Key Tide Gauge | 2.1 ft above MHHW |
| Blackwater Sound Water Quality Station | 1.15 ft above NAVD88 |
What are the measurement units these tables are referencing?
MHHW (Mean Higher High Water): The average of the higher high water height of each tidal day observed over the National Tidal Datum Epoch.
NAVD 88 (North American Vertical Datum of 1988): A vertical control datum established in 1991 that is used as a reference system by surveyors, engineers, and mapping professionals to measure and relate elevations to the Earth's surface.
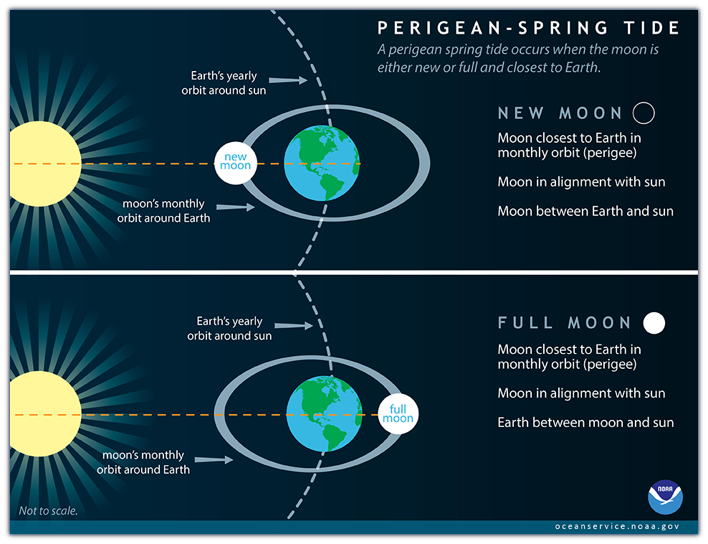
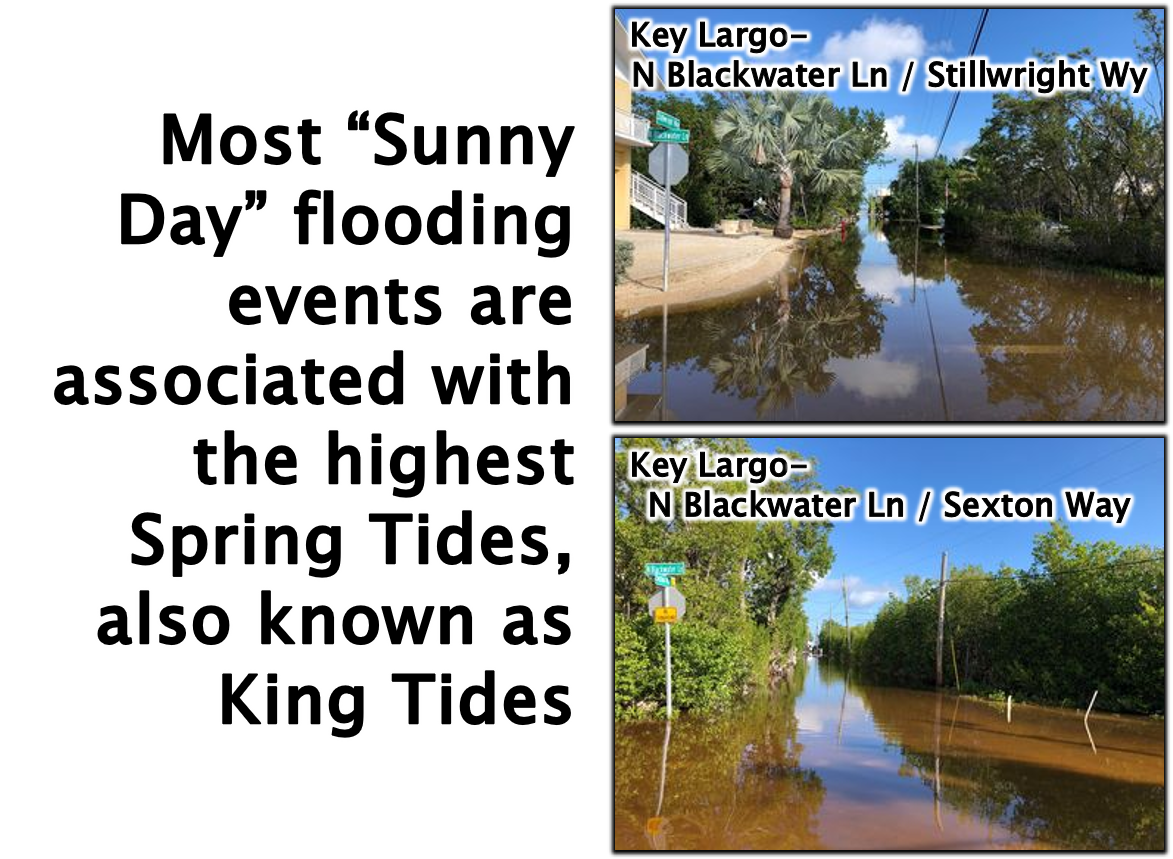
What are Spring Tides or "King" Tides and how do they affect us?
Most 'Sunny Day' flooding events in the Keys are related to Spring or "King" Tides. These are the highest of the high tides in our tidal cycle. Contrary to what the name may imply, highest of these tides typically occurring in the fall and early winter and get their name from the tide 'springing forth' rather than the season. They peak around the time of new and full moons during these months, when the Earth, sun, and moon align.
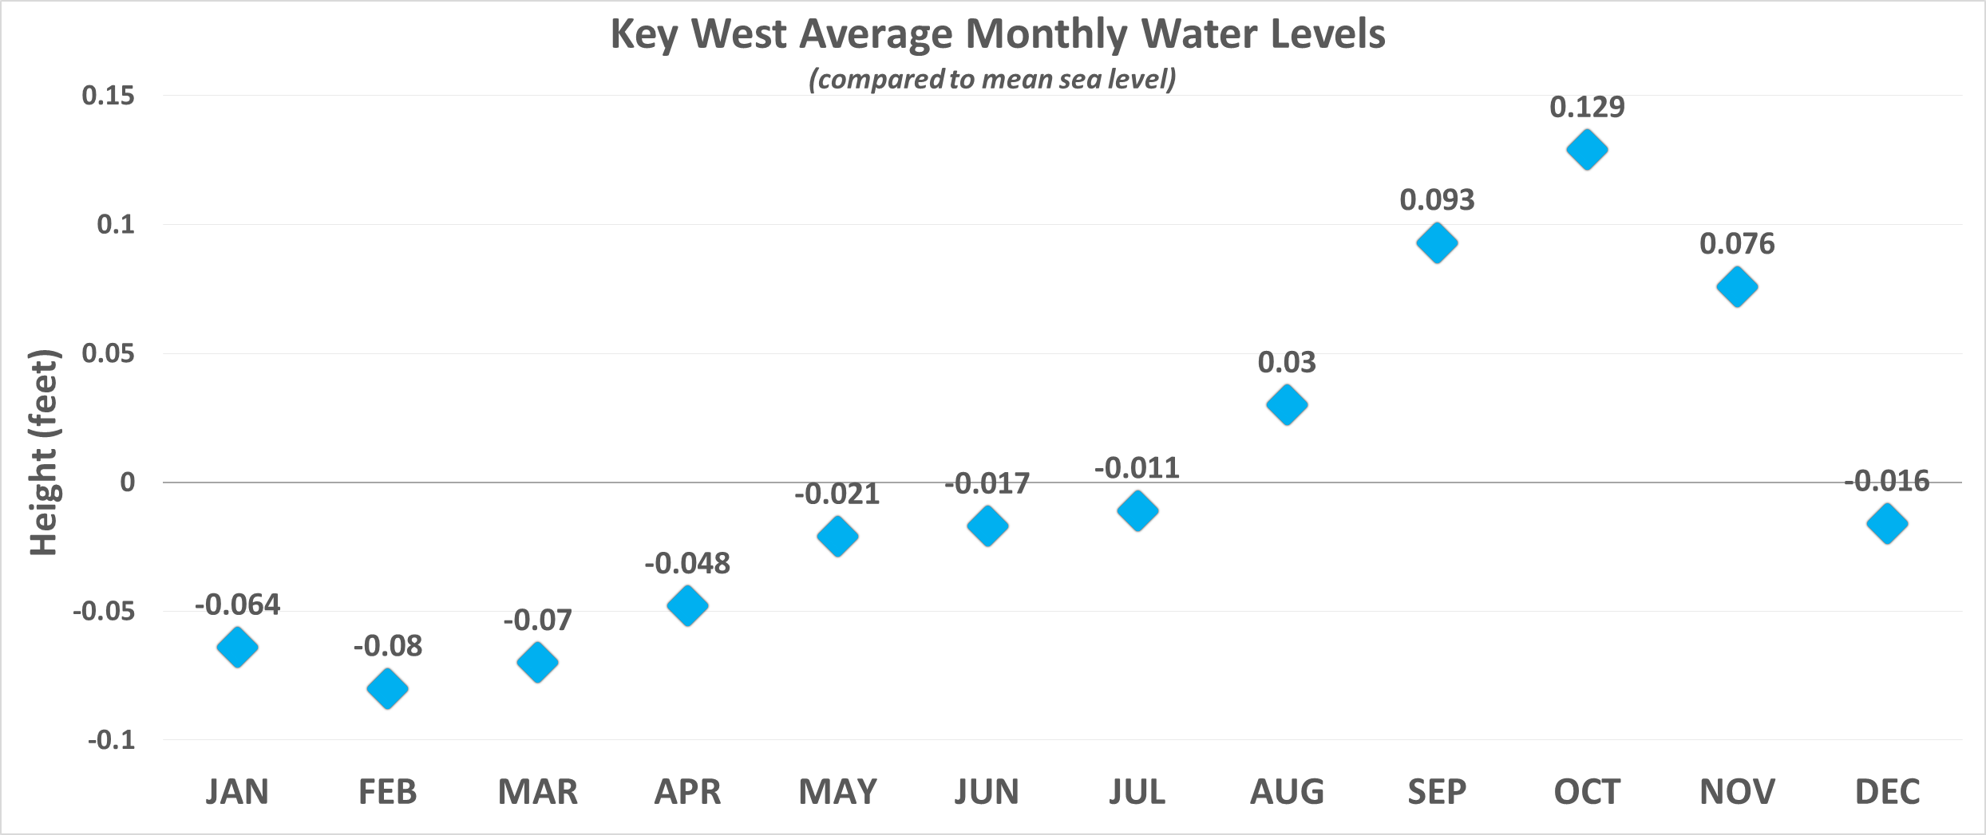
Are our tides the same all year long?
Nope! The chart below depicts the average monthly water levels in Key West, showing the peak in the fall months of September, October, and November. Nearby, or even distant, storms and weather events can have an impact on our tides in the Keys. When our average water levels peak, so too does the Atlantic basin's hurricane season activity. Tropical cyclones can significantly affect the height of tides along the island chain, particularly if they make a landfall or close approach around the time of high tide, as was the case with Hurricane Ian in September 2022. Even when the system itself may not pose a threat to the Keys the chances for coastal flooding can be enhanced, this will be discussed in the next section.
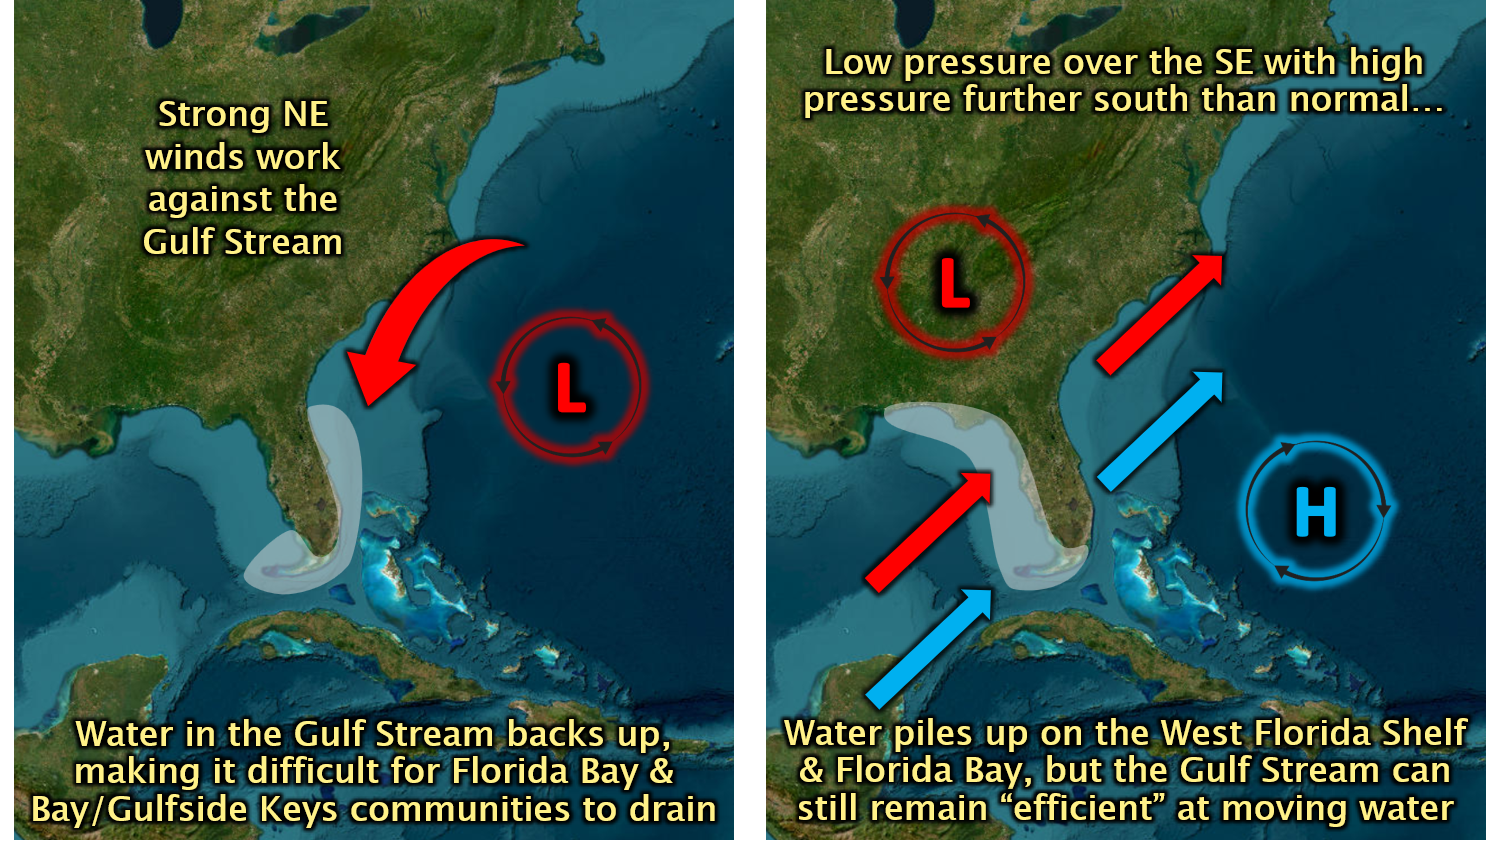
How can distant weather systems play a role in 'Sunny Day' flooding?
Below are just a couple additional scenarios that can lead to 'Sunny Day' flooding in the Florida Keys. Low pressure systems (these can be tropical cyclones during hurricane season or even Nor'easters during the winter months) off the east coast of the U.S. can work to 'back up' the Gulf Stream, which is the strong ocean current that moves warm water from the Gulf into the Atlantic as it continues northward along the eastern seaboard. When winds consistently blow against the current it becomes less efficient at moving this water, eventually creating a backlog. Even once a system has moved on and the Gulf Stream returns to its typical flow, it takes a while to move all the excess water remaining around the Keys, which can delay the return to average water levels and the end of coastal flooding. Another example is low pressure over the SE with high pressure over/near The Bahamas. This setup works to pile up water along the West Florida Shelf and into Florida Bay. In this scenario the Gulf Stream still remains efficient at moving water and may be able to help alleviate flooding sooner than in the previous scenario.
How often have we met Coastal Flood Statement criteria?
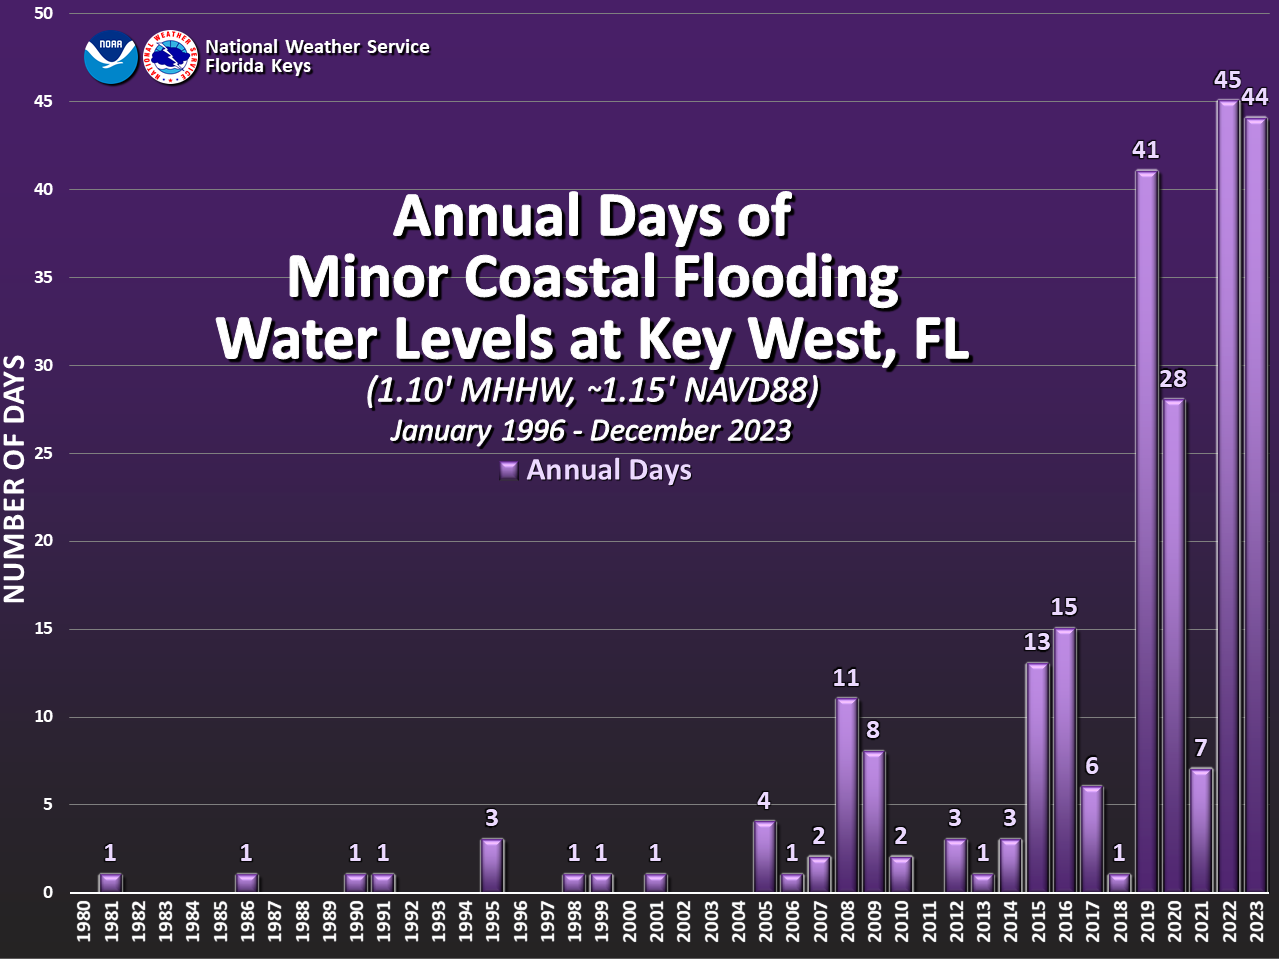
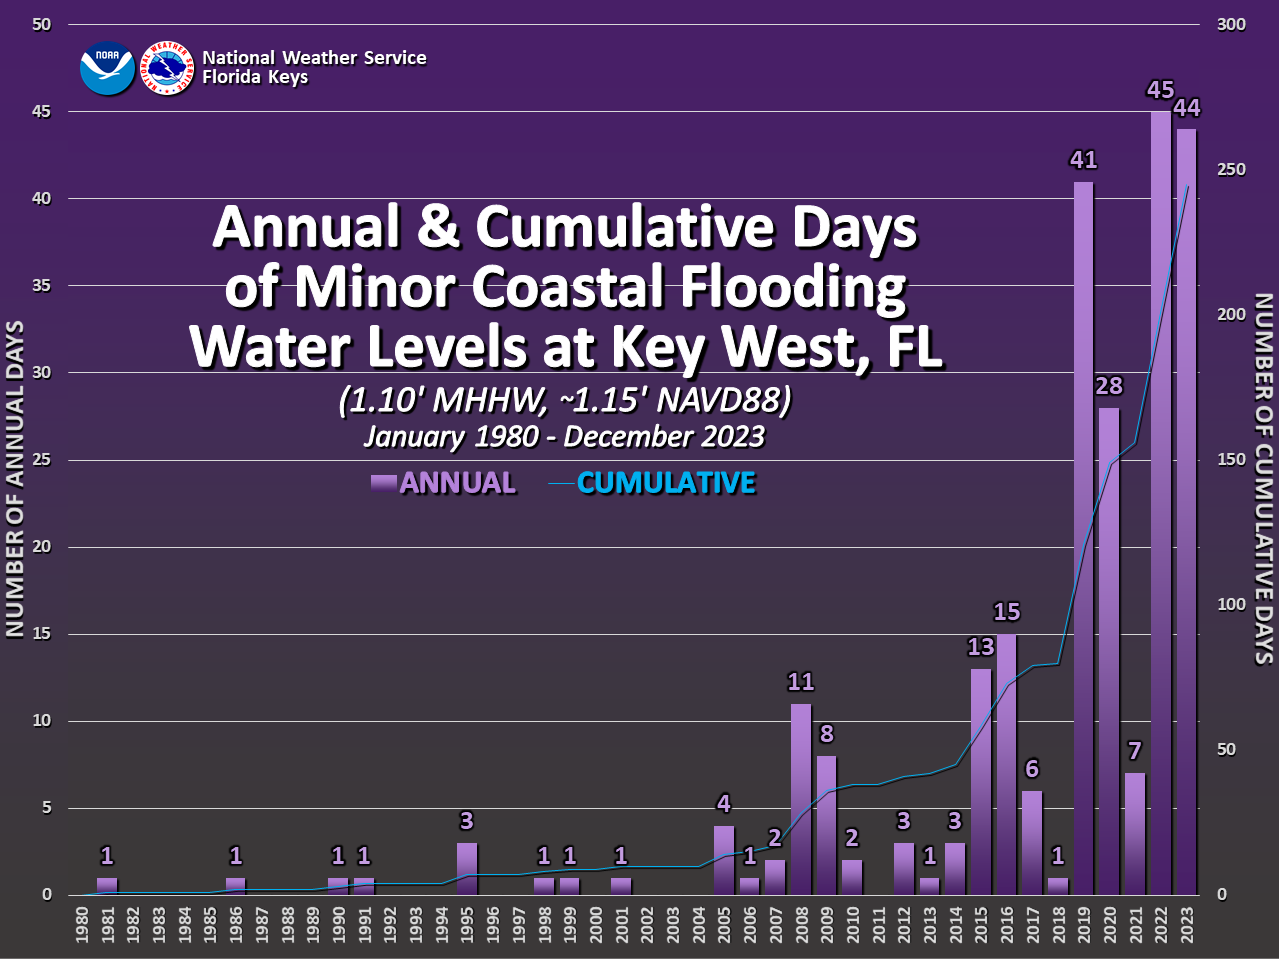
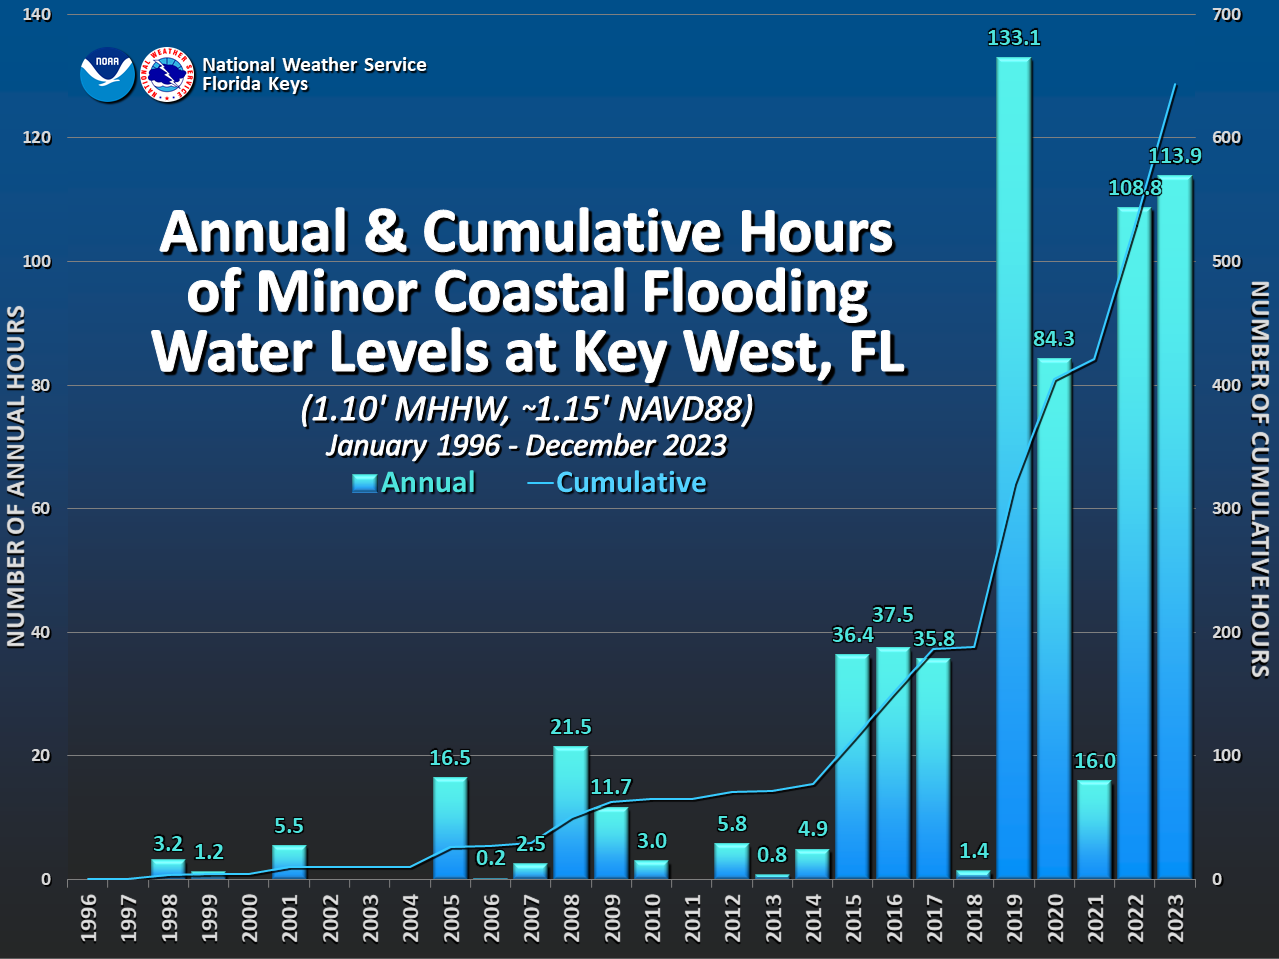
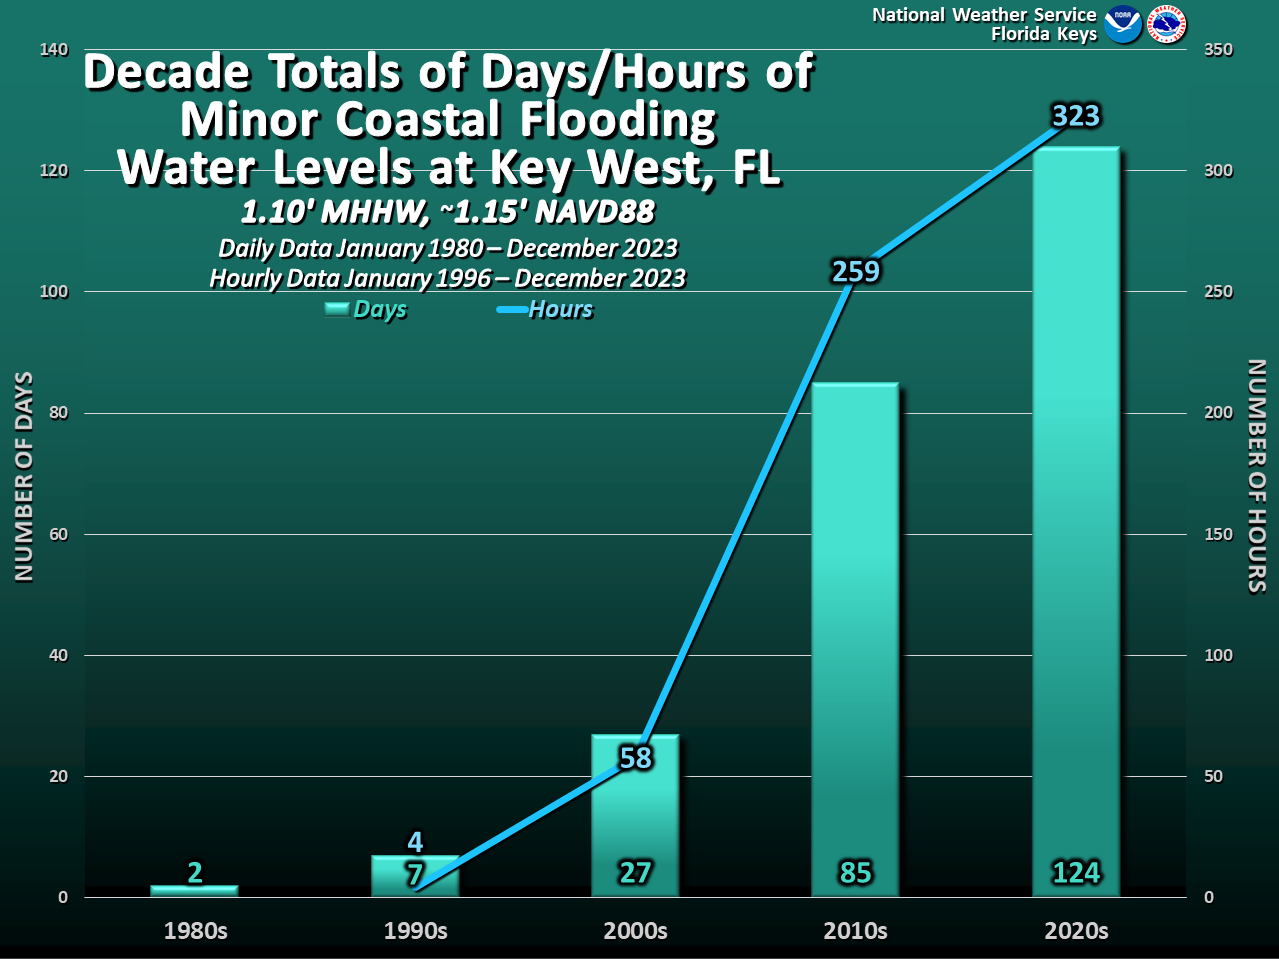
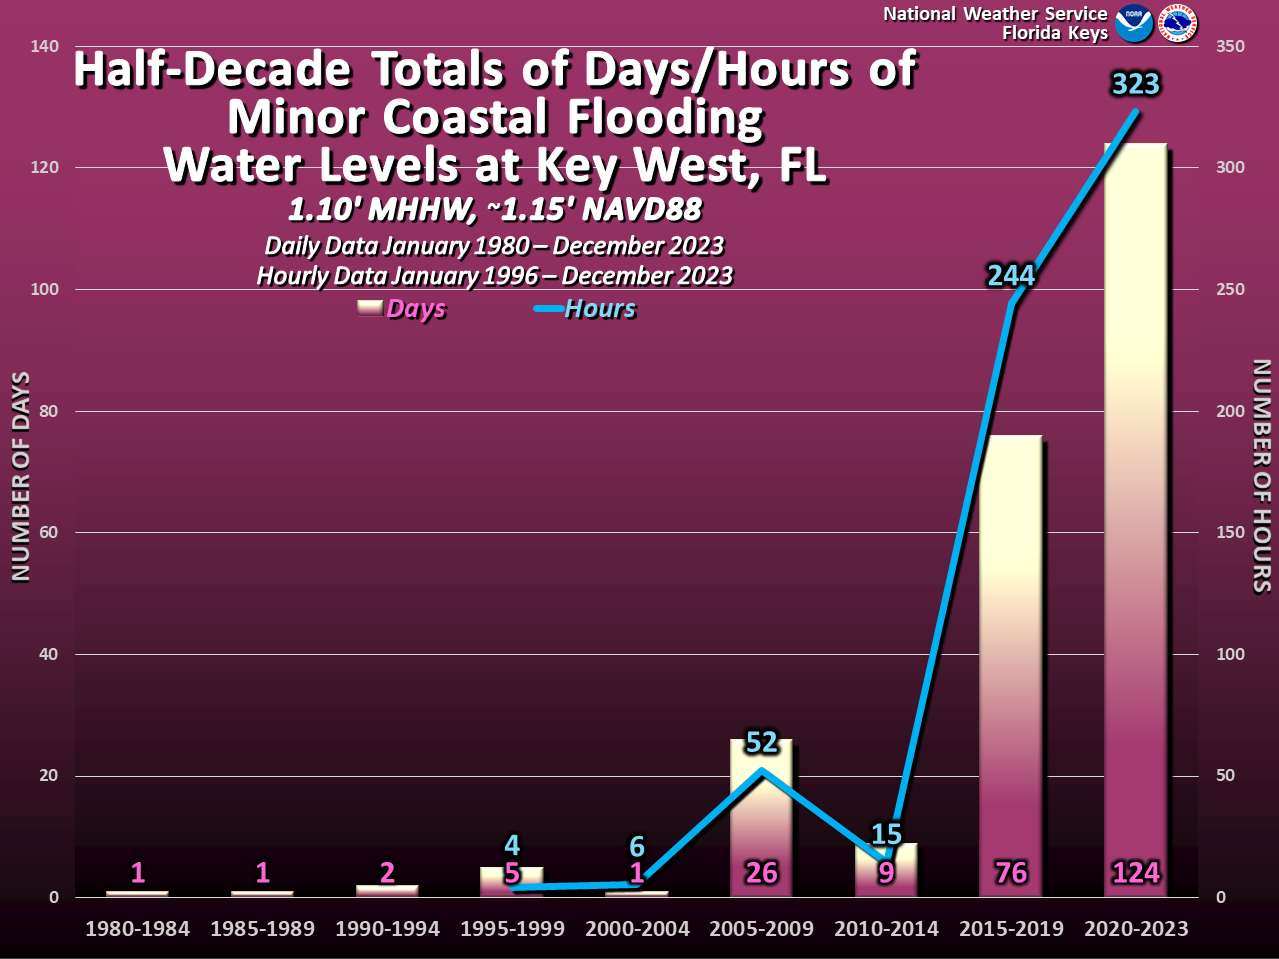
The graphics and tables below show days/hours/months where there was at least minor coastal flooding in Key West.
 |
 |
|
| Annual Number of Days of Minor Coastal Flooding Water Levels at Key West, FL (January 1980 - December 2023) | Annual & Cumulative Days of Minor Coastal Flooding Water Levels at Key West, FL (January 1980 - December 2023) | |
 |
 |
|
| Annual Number of Hours of Minor Coastal Flooding Water Levels at Key West, FL (January 1996 - December 2023) | Annual & Cumulative Number of Hours of Minor Coastal Flooding Water Levels at Key West, FL (January 1996 - December 2023) | |
 |
 |
|
| Days and Hours of Minor Coastal Flooding Water Levels at Key West, FL (January 1980/1996 - December 2023) broken down by decade | Days and Hours of Minor Coastal Flooding Water Levels at Key West, FL (January 1980/1996 - December 2023) broken down by 5 year periods |
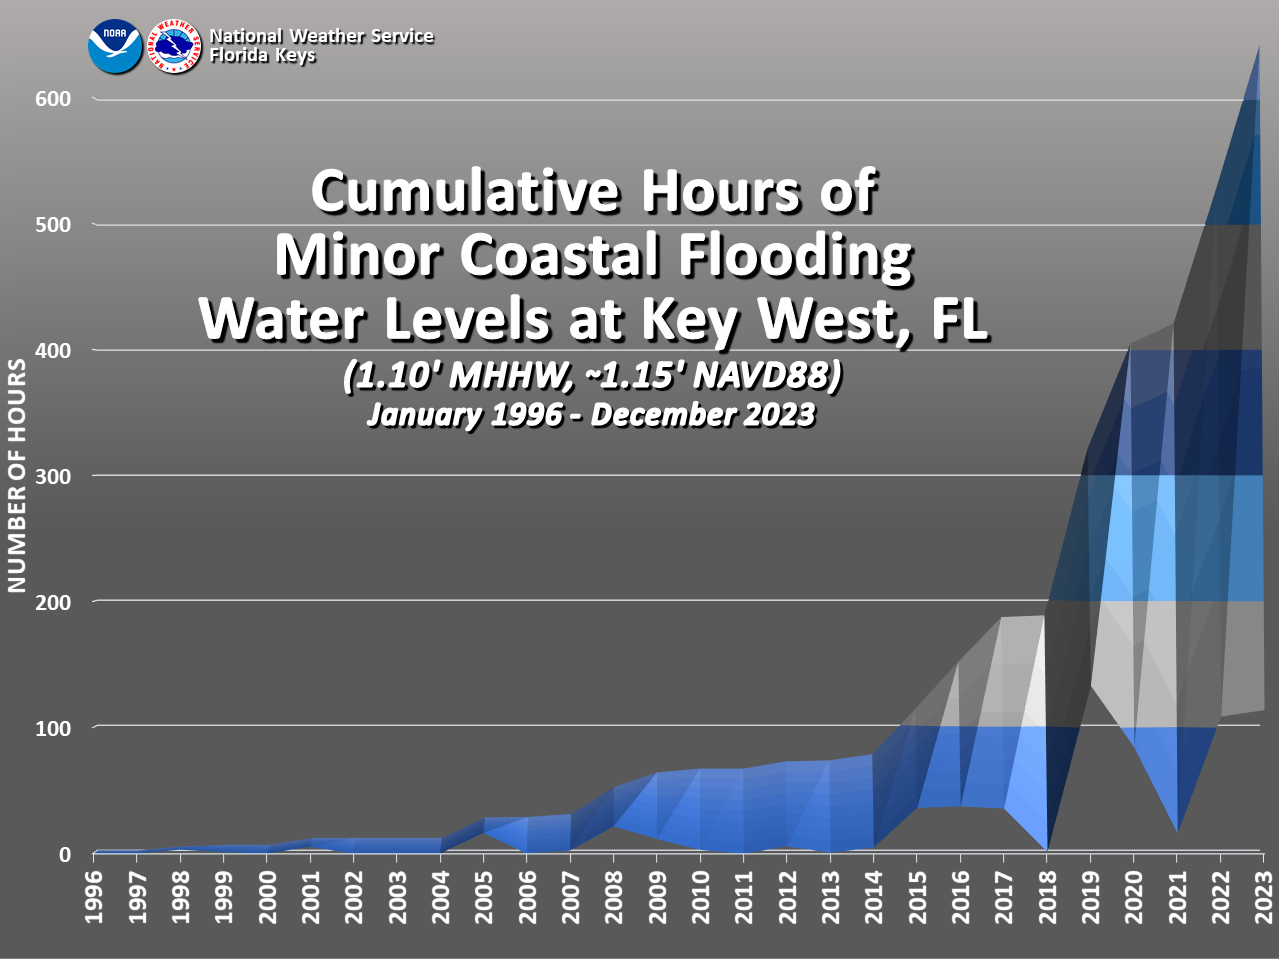 |
| Cumulative Hours of Minor Coastal Flooding Water Levels at Key West, FL (January 1996 - December 2023) |
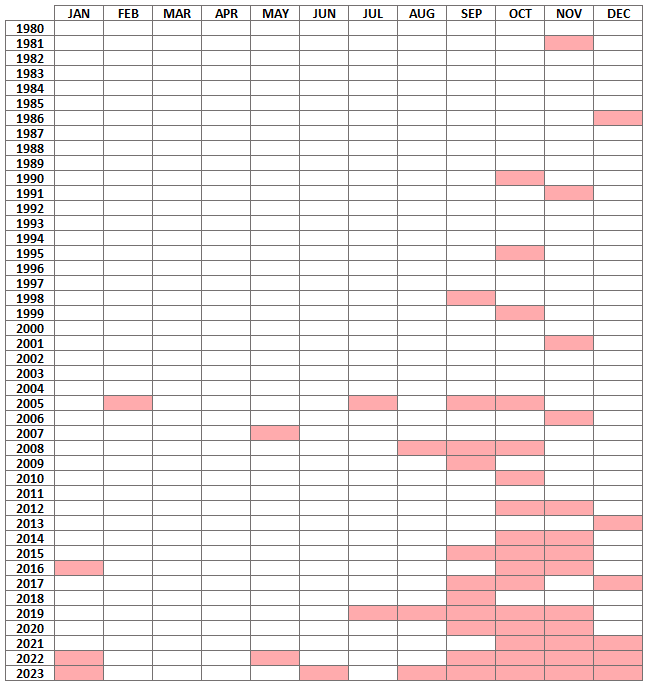
This table shows (highlighted in red) where the highest tide of the month (January 1980-December 2023) met criteria at the Key West Tide Gauge.
This table shows a summary of the table above, indicating how many months per year (January 1980-December 2023) met the criteria at the Key West Tide Gauge.
| Monthly counts of Coastal Flood Statement criteria being met at least once at Key West |
|||||||||
| 1980 | 0 | 1990 | 1 | 2000 | 0 | 2010 | 1 | 2020 | 3 |
| 1981 | 1 | 1991 | 1 | 2001 | 1 | 2011 | 0 | 2021 | 3 |
| 1982 | 0 | 1992 | 0 | 2002 | 0 | 2012 | 2 | 2022 | 6 |
| 1983 | 0 | 1993 | 0 | 2003 | 0 | 2013 | 1 | 2023 | 7 |
| 1984 | 0 | 1994 | 0 | 2004 | 0 | 2014 | 2 | ||
| 1985 | 0 | 1995 | 1 | 2005 | 4 | 2015 | 3 | ||
| 1986 | 1 | 1996 | 0 | 2006 | 1 | 2016 | 3 | ||
| 1987 | 0 | 1997 | 0 | 2007 | 1 | 2017 | 3 | ||
| 1988 | 0 | 1998 | 1 | 2008 | 3 | 2018 | 1 | ||
| 1989 | 0 | 1999 | 1 | 2009 | 1 | 2019 | 5 | ||
| Decade Total | 2 | 5 | 11 | 21 | 18 | ||||
How will sea level rise affect the Keys' coastal flooding?
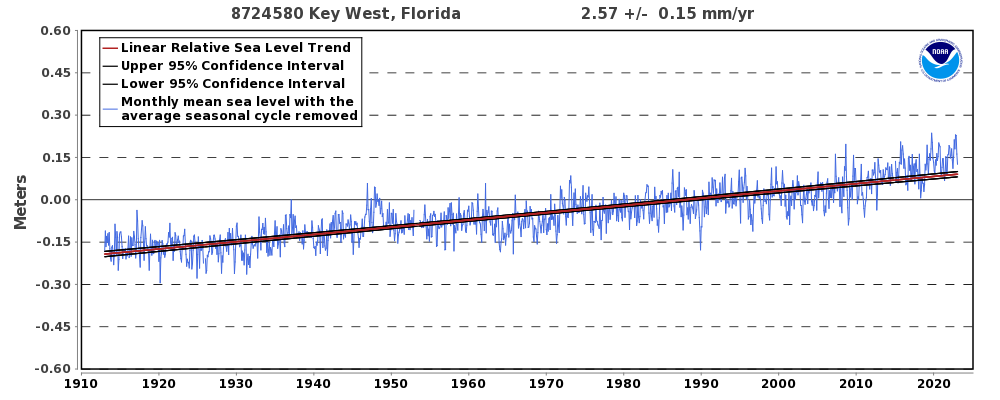
With an increase in local sea levels, it will take less and less outside influence to result in coastal flooding events. When there is a higher starting point, these same weather features that result in higher tides and flooding now will only be more impactful to our island communities. The chart below depicts the monthly mean sea level at Key West, dating back to 1913, with a trendline overlaid on top.
|
Line graph showing the monthly mean sea level at the Key West, FL, tidal station each year from 1913–2024. Overlaid are black and red lines showing the trend and upper/lower confidence levels of the trend. Plot courtesy of NOAA Tides & Currents. |

| This is the NOAA 50-year linear relative sea level trend for Key West Harbor. The most recent data point is centered on the year 2000 (spaning 1975 to 2025). The slope of this line is 3.53 mm/yr, or 13.9" per 100 years. [The 95% confidence interval is 12.5-15.3" per 100 years.] |
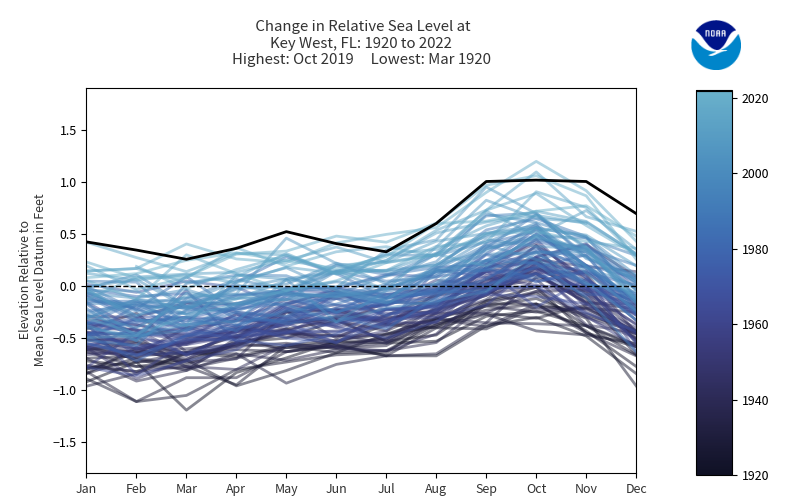
|
Line graphs of monthly sea level at the Key West, FL, tidal station each year from 1920–2022, showing how they compare to the local mean sea level (1983–2001, dashed black line). Each year appears first as a black line, and changes to a permanent color as the animation plays. Darker-colored lines indicate earlier years; lighter-colored lines indicate more recent years. Click for a static image of the final frame. NOAA image by Julia Engdahl. |
NOAA projections for sea level rise include multiple scenarios and range from ~1.5 feet to ~7 feet by the year 2100 here in Key West. The chart below shows these different scenarios, which helps to visualize the potential increase in number of 'Sunny Day' flooding events.
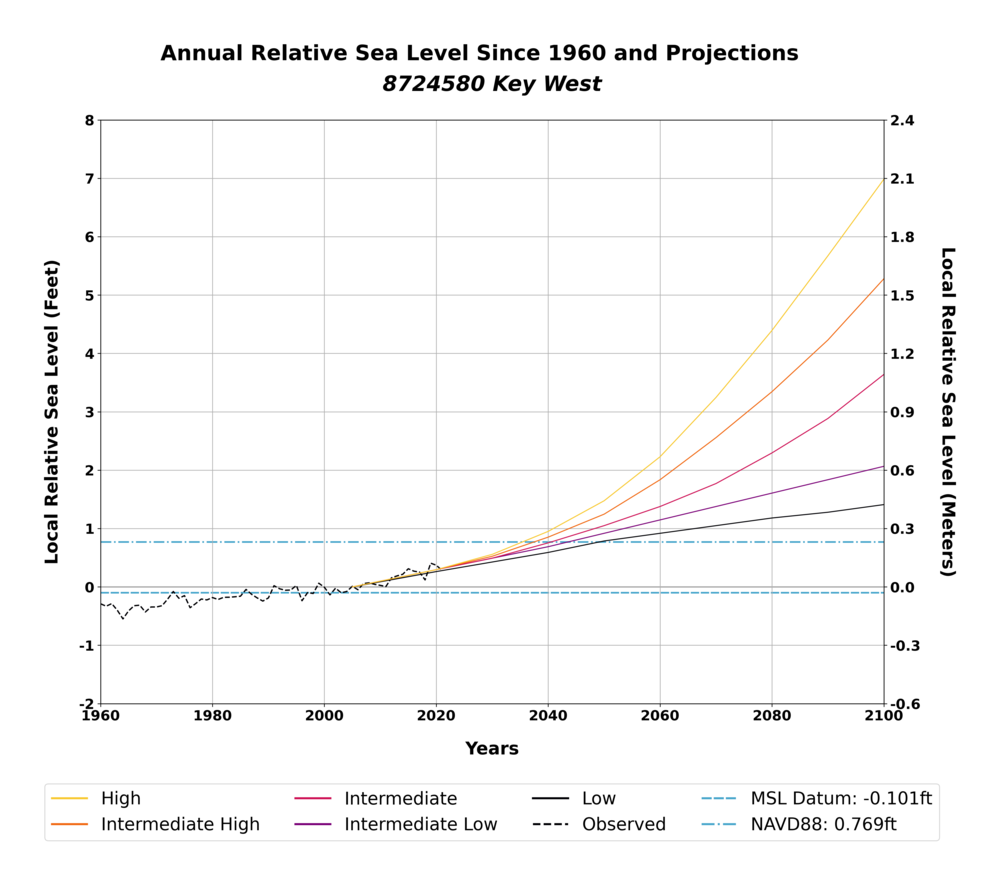
|
The figure above shows the station's annual mean sea level since 1960 and five regionalized sea level rise scenarios plotted relative to a 1996-2014 baseline period, with the year 2005 as the 'zero' for the figure. The relative position of the Mean Sea Level datum established by CO-OPS is also shown. The relative position of the geodetic datum NAVD88, which is the 'zero' used for land elevations, is also provided. |

